EURUSD - Mark up for the rest of the weekAfter the CPI data was released today we had a lovely upside move. The move has caused us to trade into the previous weak higher timeframe high which I am hoping we can break and close above before the day is out.
I am now focusing on what kind of pullback we may get into out POI's. Because there is no buy side liquidity on the first POI I will need to see a structural shift on the 15min TF to confirm that internal structure swing to move back towards the upside.
If the 1st POI fails to hold I will be more aggressive with my secondary POI as that will be the premium discount price in order for us to move higher.
If that POI fails and we break the 4H structure swing then this could signal we are about to move lower.
If I can be of any assistance to anyone don't be shy to give me a message
Markup

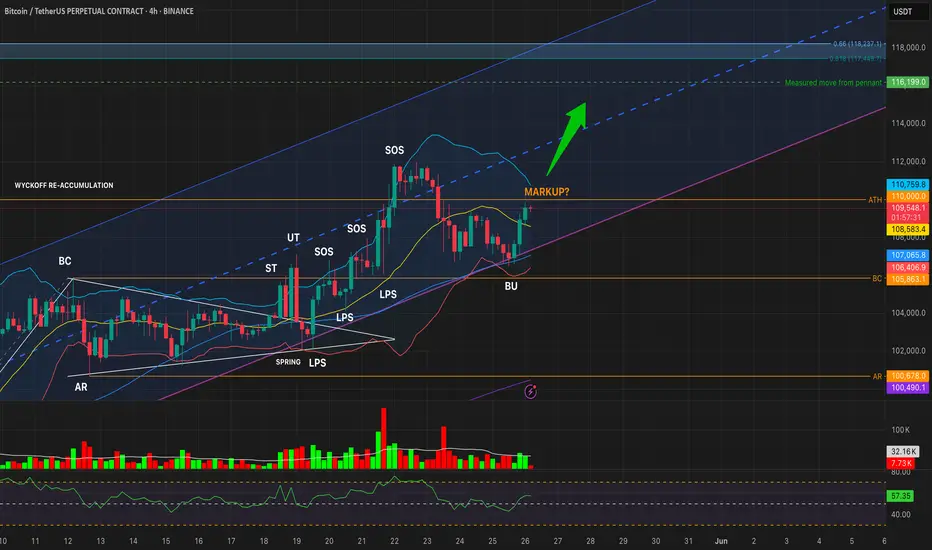
BTCUSDT 4H – Reaccumulation Apex Compression | Decision Time📌 Price is now being squeezed between major trendline support and ATH resistance (~110K) — forming an apex structure, typical of Wyckoff Phase D → Phase E transitions.
🧠 Wyckoff Structure So Far:
Phase A/B/C: BC → ST → UT → Spring → LPS
Phase D: Multiple SOS rallies followed by a BU (backup to edge of creek)
Now: Testing the upper boundary of the range again — is this the launch point for Markup (Phase E)?
🔼 Bullish Breakout Conditions:
✅ 4H close above 110,625
✅ Rising volume above 27.4K MA
✅ RSI > 60
🟢 Targets:
TP1: 116,199 (measured move from pennant)
TP2: 117,449–118,237 (Fib confluence zone)
TP3: Trailing TP with 1.0% callback
🔽 Bearish Breakdown Risk:
❌ Close below 107,867 with RSI < 45 + rising volume
Would signal failure of the BU and reversion toward:
BC: 105,863
AR: 100,678
📊 Indicators:
RSI: 55.77 (neutral/bullish)
Volume: Still below average — shows compression
55 SMA: 107,762.7
BB Midline: 108,653.9
⚖️ No hedge short entry valid yet
Let the apex resolve — patience until confirmation.
#Bitcoin #BTCUSDT #Wyckoff #CryptoTrading #TechnicalAnalysis #BTC

BTCUSDT – Reaccumulation Breakout or Bearish S/R Flip?Timeframes: 1W • 1D • 4H
Structure: Wyckoff Reaccumulation nearing Phase E — but ATH is acting as resistance
🔹 WEEKLY OUTLOOK: Macro Structure Points to Markup
Last weekly candle closed above the reaccumulation Buying Climax (BC), showing bullish intent
Weekly upper Bollinger Band is rising toward 113k
RSI at 67, strong but not overbought
Structure suggests we’re entering Wyckoff Phase E
Weekly Targets:
🟢 TP1: 113,049 (Upper BB)
🟢 TP2: 116,199 (measured move)
🟢 TP3: 118,237 (Fib 0.66 extension)
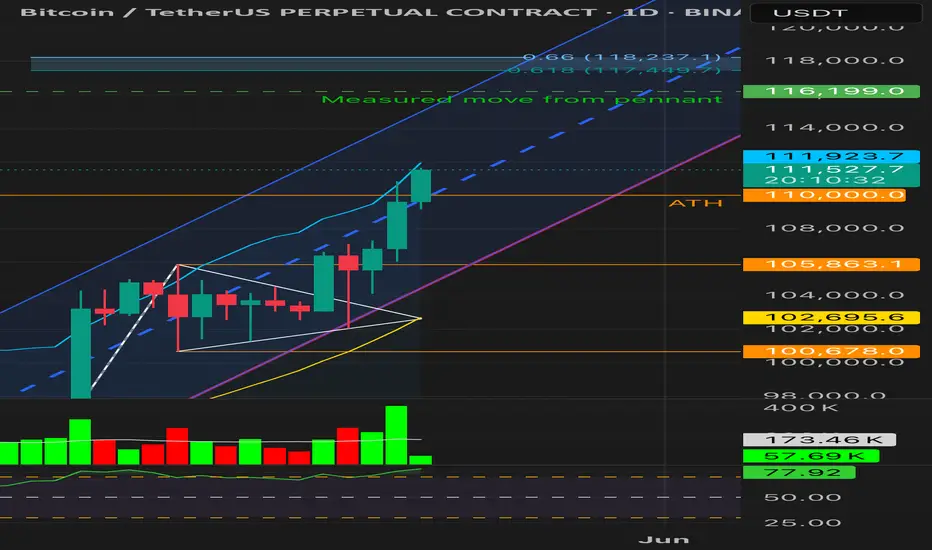
🔹 DAILY OUTLOOK: Still Holding Above Reaccumulation Range
Multiple daily closes above the BU (backup) zone, but all below 110k ATH
RSI is strong (~66), and price is tracking near the upper BB, but volume is not convincing
Until a daily close above 110,000, breakout remains unconfirmed
🔹 4H OUTLOOK: Structure Valid, Momentum Rising
BU zone held; price made two lower lows followed by a higher high
RSI has reclaimed 57+, and volume is picking up modestly
4H structure looks like an early Phase E breakout attempt, but...
⚠️ Caution: Is This a Bearish S/R Flip?
While the broader Wyckoff structure suggests a transition into markup, we must also consider the bearish scenario:
BTC may be failing a support/resistance flip at 110k
All timeframes have rejected at or below 110k, despite multiple attempts
If we see a lower high under 109k + 1D close below 105,863 with red volume and RSI < 45 → this becomes a confirmed bull trap
📊 TL;DR:
BTC is structurally bullish — but we are at the final test zone.
🔓 Breakout confirmed: Daily close above 110k
🔒 Failure confirmed: Close below 105,863 + red volume + RSI breakdown
Stay nimble. This is either the last shakeout before markup… or the top of the range before reversal.
#Bitcoin #BTCUSDT #Wyckoff #CryptoTrading #TechnicalAnalysis #Reaccumulation #Breakout #SupportResistance
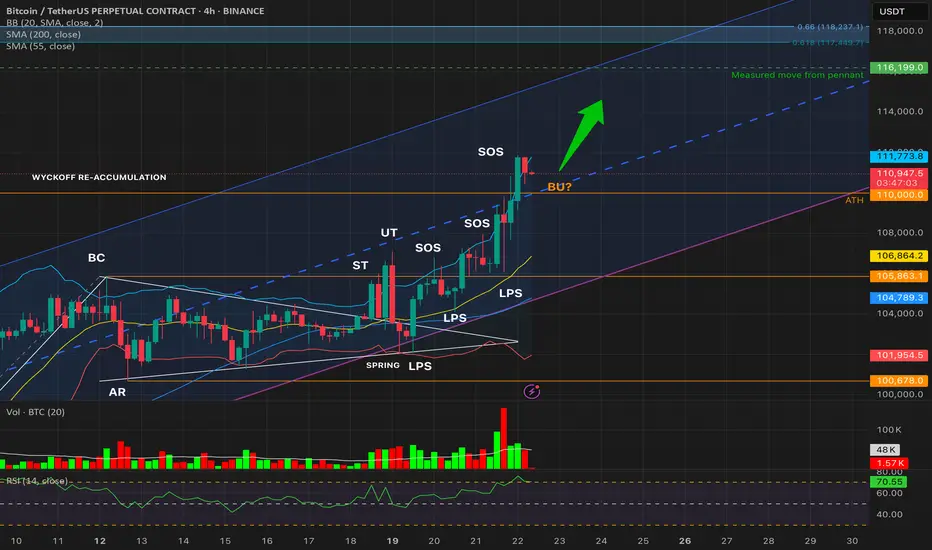
BTCUSDT – Wyckoff Re-Accumulation Breakout ContinuesBitcoin is advancing through a textbook Wyckoff Re-Accumulation structure on the 4H chart. After the Spring and multiple LPS confirmations, price surged above the previous range high (~110k), entering a strong Sign of Strength (SOS) rally.
We now observe:
✅ Second 4H candle close above ATH (110,000)
✅ RSI: 70.9 → Strong bullish momentum
✅ Volume: Above MA during breakout, healthy but slightly declining
✅ Bollinger Bands: Price hugging upper BB (111,227)
✅ Structure forming a Backup (BU?) test near ATH
The current move targets a measured pennant breakout projection:
🎯 TP1: 115,224
🎯 TP2: 116,199
🎯 TP3: 117,449 – 118,237 (Fib extension confluence)
This aligns with Wyckoff Phase E and continuation of the markup cycle.
No short setups valid — trend remains firmly bullish. Pullbacks to 110k could offer high-conviction long entries as BU confirmation.
#Bitcoin #BTCUSDT #Wyckoff #CryptoTA #BTCAnalysis #Reaccumulation #TradingView
BTC | Testing ATH — Breakout or Trap?Daily close just under ATH at 109,609
We had only 1H confirmation above ATH, with the first 4H close above ATH likely in 30 minutes. The breakout volume is well above average (Volume MA: 172.89k), but daily candle still below resistance.
This could be:
• A Sign of Strength (SOS) transitioning into Phase E markup,
• Or a premature breakout without higher timeframe validation.
⸻
Breakout Validation Checklist:
1. 1H Close Above ATH (~110k) ✅
▸ Initial signal confirmed, but not sufficient alone.
2. 4H Close Above ATH (Pending ~30 mins)
▸ Must close above 110k, with no strong upper wick.
▸ Confirms intermediate-term strength.
3. Daily Close ≥ 110k
▸ Still missing. Required for macro breakout confirmation.
▸ Watch for candle body, not just wick.
4. Throwback & Support Hold at 109.6–110k
▸ Ideally after 4H confirmation, a retest and bounce = textbook
SOS → BU → Markup pattern.
5. Invalidation Risks:
▸ Daily close <109k with high volume
▸ RSI divergence on 4H
▸ Rejection from 114k–116k Fib cluster
▸ Large bearish engulfing below ATH
⸻
Wyckoff Context:
We’re likely in Re-Accumulation Phase D, testing the breakout.
No signs of UTAD or distribution — but low conviction breakouts at ATH are known trap zones.
⸻
What’s Next?
If 4H + Daily confirm, momentum may push toward:
• TP1: 114,449 (Fib 0.618)
• TP2: 116,199 (Measured move)
• TP3: 118,237 (Upper Fib extension)
⸻
Follow for real-time BTC setups based on structure, RSI, and volume — no hopium.
Like & share if this helps clarify the levels you’re watching.
BILI | China's Gaming Industry will RiseBilibili, Inc. is a holding company, which engages in the provision of online entertainment content. The firm enables broad video-based content consumption scenarios centered around professional user generated videos supplemented with live broadcasting, occupationally generated videos, or occupationally generated videos. The company was founded by Xu Yi in June 2009 and is headquartered Shanghai, China.

Accumulation complete, re-rating starts now ?There is some very bullish price action being observed in Biontech. This could mean a catalyst for all the vaccine stocks could be coming soon.

Solana - Wyckoff Mark Up ExampleSolana vs. Wyckoff Logic
SOLUSD example of mark up in the Wyckoff logic schematic. If unfamilar, there are market phases according to Wyckoff Logic:
Accumulation: The phase where the market stops falling and begins to form a base, suggesting that demand is starting to overcome supply. It is characterized by a selling climax, where the price falls sharply, and the volume is high, indicating panic selling. After the climax, there is typically a phase of sideways movement, with occasional tests of the lows. This phase is labeled as the cause, setting up for a new upward trend (effect).
Markup: After accumulation, the price starts to rise, signifying that the market is entering the markup phase. This phase is indicated by a rise in price away from the accumulation zone, often with increasing volume, which is interpreted as the start of a new uptrend.
Distribution: This is the phase where the market tops out and is characterized by a buying climax. Supply begins to overcome demand as the "smart money" starts to distribute their holdings to the market. The distribution phase is also labeled as the cause for the subsequent downtrend.
Markdown: Following distribution, the market enters the markdown phase where prices start to fall consistently. This phase is shown by a break of support levels with increasing volume, indicating a strong presence of selling pressure.
The image also depicts the concept of "Volume" with a histogram at the bottom. The volume bars are colored in red and blue, generally indicating selling and buying volume, respectively. The histogram helps traders identify moments of high or low volume, which can be a sign of the strength or weakness of a particular price movement.
Wyckoff's analysis technique is grounded in the study of price action, volume, and time, as they relate to supply and demand. It is a tool for understanding the market's structure and potentially predicting future price movements by identifying the actions of large institutional traders and investors.

Bulls Ready To Take ItSPY has been undergoing accumulation, markup activated 10/21 above 373.93 (will want to see continuation next week for the path to play out in timeline detailed below):
Initial Target 388-393 by end of October 2022 (SoS)
Slight pullback to 377-382 into early November (BU/LPS)
Estimated trajectory following above scenario:
408-419 by December 2022
371-384 going into Jan 2023, likely will re-accumulate here
Attempt breakout of larger downtrend at 395-400 level around Feb. 2023
Goal Target 515-550 (new ATH) by Summer 2023 to end the 13 year bull cycle ; will begin major distribution there
Bigger picture is SPY shows indication that it has completed wave IV via a tripple combo and has been accumulating to start of wave V.

SNOW is rising this Winter ❄️Hello TradingView Family / Fellow Traders,
❄️ NYSE:SNOW has been stuck inside a big range in the shape of a symmetrical triangle.
🏹 For the bulls to take over from a long-term perspective , and the Markup phase to start, we need a weekly candle close above the 210 resistance.
Meanwhile, as SNOW approaches the lower bound of the triangle, we will be looking for short-term buy setups on lower timeframes.
📚 Always follow your trading plan regarding entry, risk management, and trade management.
Good luck!
All Strategies Are Good; If Managed Properly!
~Richard Nasr

Bullish Structure GBPUSDin 4H Structure is Bullish and EX Order Block worked .
in 15min Structure is Bullish because Price Move from 4H EX order block and we have 15min BOS
in 15min we have 1 EX Unmitigated Order Block .
==> if Structure create new 15min BOS we must Fund new LPP and new Order Block .
==> if Structure cant it , we have just 1 ZONE for BUY

Breakout Retracement Continuation in NikkeiThe weekly chart of Japanese stock market index Nikkei 225 is exhibiting possible breakout, retracement continuation at old resistance turned support zone.
Will this be the decisive move the Japanese stock market bulls are looking for?

EURUSD Support and resistance markupI decided to display how I mark up my charts. I will be trading EURUSD going forward. I intend on leaning closed into naked trading as I don't use many indicators.

BTC Wickoff 2022-2023 Shake out-Mark up?Hi dear community and my lovely followers.
I would like to add another analysis which add more confluence to my previous analyses that BTC is preparing for another huge jump.
As you see I Have drown BTC wickoff accumulation model 2022-2023 which shows that BTC hasn't only bottomed out but also has finished its main accumulation phase/A,B,C,D/ and now it is in a phase E /both profit-taking and acquisition of additional shares (“re-accumulation”) by Smart money/. In phase E can be small shakouts which we show at the moment, stay level headed, keep patience as BTC is preparing for Mark up to 35-37K.
As I published in my previous analyses, I expect BTC to pump from 26K zone and think BTC has bottomed testing 200 weekly MA and 100 daily MA, but the worst case scenario could be test of previous support zone at 24.2-25K where Smart money will add their bags before new highs.
I don't expect lower prices specially after taking out huge amount liquidity below 27K and 26.5k. BTW taking into account some bearish chart patterns/like H&S, rising wedge breakdown/ 99% expect 25K and even lower prices, as a contrarian trader I always go against the herd and expect bounce from this zone/although I have plan for both scenarios/.
Don't forget to check my previous analyses/below this one/ where I shows you what are other factors which force me to expect higher prices. Don't be shake out, BTC will surprice everyone. I will also add more charts below this one, where you can find very interesting views.
Don't forget to follow, like, comment, retweet. I will appreciate any kind of support.
Have a good day , I wish you good trades.

P2P | DXY - Anybody Else Feeling Like This?Hey family sorry I've been a bit MIA this week, things happen so we gotta get through and keep pushing!
Take a look into this #DXY mark up and see if you see what I'm seeing (/0.0\)
Trade well gang and keep moving that stop loss into profit!

EURUSD 12TH MARAfter the NFP on Friday, Euro USD has been left in a bit of a middle ground. Looking at what we have directly in front of us with this price action, we have a clear unmitigated one hour supply above along with a demand at the base of our impulsive shift and with the demand, we also have clear trend line equality which looks too clean to be left.
So following what we said about gold, I'm looking for either a downward shift to lead us into a corrective push up, Or a push high to lead us into the corrective, move to the downside.
Make sure that you always use your confirmations to get into a trade and always be flexible with your analysis. Remember, sticking to your trading plan and consistently entering the same setups will bring you profitability.
If you like this idea, drop us a boost and a comment down below.
We hope you all have a profitable and successful trading week.

P2P | DXY - Let the manipulation beginSo we can see the trade was activated on the push up into the zone. Typically most of my setups are based on 1-2 trades, whereas I will place a 2nd trade if my 1st trade was to get stopped out.
I will allow a 2 - trade setup as long as it makes sense to me and I'm comfortable with my amount of risk.


EURUSD Trade Breakdown Hello traders
-Today we had a trade on EUR/USD which is currently in profit due to the NEWS event.
- In the next steps, we will break down this trade and explain why it is risky to trade if you have strong news.
- Chart breakdown
1) On the left side you can see that the major low has not been broken, therefore the price has the potential to continue bullish.
2) Negative confirmations are bearish reactions and big wicks that you can see at the end of momentum.
3) The price is in an overall corrective PA, the structure is more bullish than bearish because we have not broken the major low.
4) But be careful with such trades because we had a lot of negative confirmations, you have to breakdown the whole chart and then make a decision for the trade.
WARNING!
-Strong news was present here. The news was on our side in this case. But be careful when trading the NEWS event, because the main reason why some prop trade firms do not allow you to trade the NEWS event is "slippage". If "slippage" happens there is a chance that the price will "forget" you SL and you will lose more than you should have.
-That was all about this part, if you want more education like this, don't forget to leave a like and write us a comment if something is not clear to you.

EURUSD Price Action BreakdownHello guys 👋
- This is the first video on our profile. We want to break down the chart as best as possible and show you our view of the chart with the help of a video. Leave a comment and like if you want more clips like this.
Forecasting in forex helps us prepare as well as possible for a potential entry and reduce the chance that emotions will affect us. Forecasting should be done at least twice every day, in the morning and night. On the weekends, you can do the forecast only once. Higher and lower timeframes should be analyzed during the weekends in preparation for the coming week.
1D timeframe chart breakdown
1)Daily Timeframe shows us that the price moved in a long downtrend.
2)At the end of the downtrend, we see that the price has made a Change of Character, and we notice the presence of Bullish Orderflow, which indicates that we can expect the beginning of an uptrend.
3)After a long downtrend, the price finally breaks the descending structure with strong bullish momentum, which indicates that we can expect the beginning of an uptrend.
4)After the bullish momentum, we see that the price has slowed down with the momentum (weakness), but again we see the presence of bullish order flow + EURUSD has the characteristic of going up impulsively from this kind of price action + it has a lot of liquidity to pick up.
5)In the end, the price is bullish, but it can easily change to bearish
1D timeframe forecast:
1)We see a nice change of character after a long downtrend, nice bullish momentum, bullish order flow, and we can expect the price to continue bullish.
2)The price has left wicks that tell us that the price has no more momentum to continue upward, and we expect a reversal to happen.
3)If we see a corrective pullback, wicks will be respected, and we can expect a continuation of the uptrend.
4H Timeframe chart breakdown
1)We see that we are moving in a longer ascending channel, and we see that: we are placing new HHs; we make impulses, corrections, impulses, which indicates that we will continue to move in the ascending channel.
2)But this is EURUSD, and we know we can expect to see a smaller ASC PA after this PA and see a trend change or continuation to the upside from this PA.
3)In the end, we have no bias, and we look at what will most likely happen and react to it.
4H timeframe forecast:
1)We see that the price is placing new HHs, and we notice an impulse correction impulse movement, so we can expect the price to continue to place new HHs and continue bullish.
2)After a longer ASC channel, EURUSD likes to make a smaller ASC PA and then change the trend, so we can expect that.
1H timeframe chart breakdown:
1) Currently, we see a very corrective PA; the price is between high and low.
2) we also see that the price moves from des PA to asc PA, which indicates a correction.
1H timeframe forecast:
1) Here, we expect a correction because everything points to it
2) There is a chance that the price will go bullish because they make an inverted head and shoulders pattern, but we do not want to trade in such a PA
Don't forget to leave a like and comment for more posts like this.

EU 1D TF Chart Markup Hello traders.
This is EUR/USD 1D timeframe.
In this analysis, you will see a detailed breakdown of this pair and my forecast.
IMPORTANT
-It is very important that you read every part of the PA, so that you can better understand the PA and the language of the market. We will start with a detailed breakdown from left to right.
Chart recap
1. Here we can see that the price is in a long downtrend, after the reaction from the first supply zone , we see a nice bearish momentum.
2. After the impulsive BOS price leaves wicks, when we see wicks, it tells us that the price has no more momentum, but in this situation, the wicks are respected because the price went correctively towards the supply zone .
3. After a long downtrend, the price finally breaks the supply zone , here we see a change of character and bullish momentum.
4. When the price makes an impulsive change of character where we see momentum is present, we can expect a change in trend.
5. In the end, the price left wicks, which tells us that the price has no more momentum.
Forecast
1. We see a nice change of character after a long downtrend, and here we expect a change in trend.
2.The price has left wicks that tell us that the price has no more momentum.
3.If we see a corrective pullback, wicks will be respected, and we can expect a continuation of the uptrend.
4.That's all about this analysis, if you have any additional questions, drop a comment down below.

The Shop Model - Trading Mindset This is a look into the way I see markets and how I see my trading using the Wyckoff Method and comparing it to standard business models. More of a mindset video but I feel is very useful when trading and seeing your trading as a business.
Let me know what you think,
Cheers for watching

ETH Update - BullishAlmost completed the accumulation, buy above 1323.82
Target range by early Nov. is 1480-1700, Dashed path is most bullish scenario, dotted least bullish - expected path somewhere in between (solid green trajectory)
Will re-eval once it hits the target range
