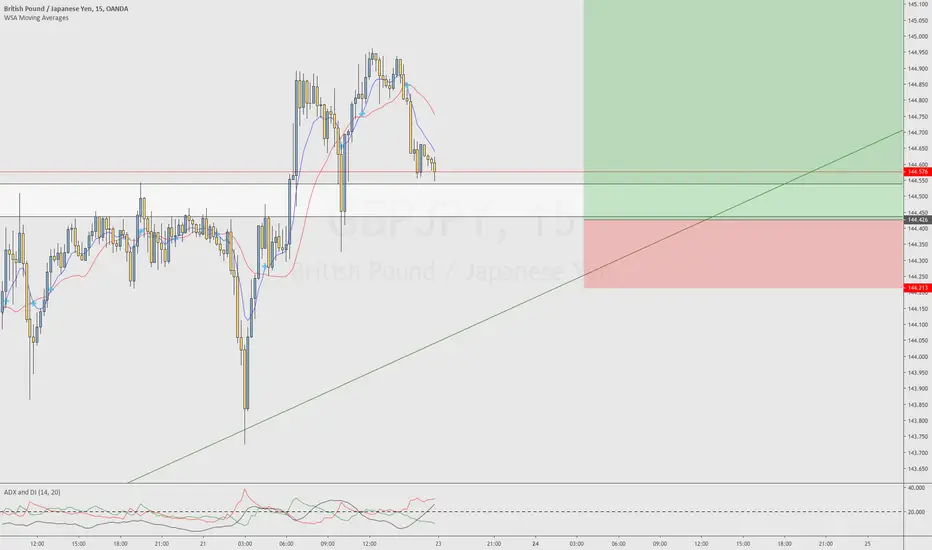
Weekend Chart Mark-up's : GBP JPYIf you are looking for a buy or a sell I feel price will use these prior zones to find its way through structure in price movement .
Markup

Weekend Chart Mark-up's : GBP CHFIf you are looking for a buy or a sell I feel price will use these prior zones to find its way through structure in price movement .

Weekend Chart Mark-up's : NZD JPYIf you are looking for a buy or a sell I feel price will use these prior zones to find its way through structure in price movement .

Weekend Chart Mark-up's : NZD USDIf you are looking for a buy or a sell I feel price will use these prior zones to find its way through structure in price movement .

Bitcoin ShortWhats up traders,
Before I give my analysis I want to thank you guys for all the likes, comments, and follows. This is our 50th post on Trading View, and trust me we will not be going anywhere any time soon. Expect more from us in the future! -LobFXEmpire
If you been trading Bitcoin you know its been going up in value a TON, but what goes up MUST come down! If you're like me your going to try to catch the bulls and the bears! I'm seeing price retest a key area and going down to about 11700-11600, or even the daily support I have plotted. The daily candlestick closed while price was attempting to make a move towards the bears, and then obviously opened a new candlestick an started to rise, but its most likely a fake out. Just a thought, what do you guys think?
P.s. I also spotted a head and shoulder on the 4HR TF indicating downward movement

DIALOG Bullish Continuation by WyckoffianMarket move in phases as I learned in Smart Saham course to become Versatile Wyckoff Trader by Alwi Adam.
1.Accumulation,
2.mark-up,
3.re-accumulation,
4.distribution,
5.mark-down
6.back to accumulation again..
Understand these phases able to help us determine where to enter and exit the market.
For this counter..we expect the price continues higher as 10% (TP1) and 20% (TP2). enjoy!

BTC: 9430 | 10800 | 6500 | 17500 || The Plan where liquidity is where the deal crystallizes
shoulders are costs of sponsor
head is bench of banker
the right should shall be REWARD of BANKER to the MINER
-
when everyone is flushed out.. then 2021 should be a rewarding moment to folks with VOLUME below 9k levels
note: cost of JD and S is 4k to 8k
that should be a nice zone to eyeball


U30 TRADE IDEAHey Traders!
This is definitely an interesting Index to look at, a lot of gaps which definitely falls in hand with its sensitivity to news.
I'm mainly looking for a bearish breakout move as price approaches a very respected demand zone (24918).
If you agree hit me with a like! If not comment below love to hear trade perspectives!
Happy Trading guys.

GBPUSD (old markup)This was my markup from last week that I forgot to post!
Decent swing trade
New Markups coming :)


GBPJPYPrice broke Exhaustion and created new High since Mid December.
Waiting on retest of exhaustion, H4 Trendline.
Wait for double bottom, Bullish Engulfings, selling exhaustion, MA's Being respected
Price is currently buying from support zone 1.91716 expecting gpPrice is currently buying from support zone 1.91716 expecting gpbaud to continue buying toward resistance zone 1.9464 then sell long term

EURGBP LONGS BABYCheck the price labels.
For further details on this trade or any help please message me, and happy trading! :)

AUD/USD 1hr MARK-UPThis was a mark up was on
9/30/19 - 10/3/19
I didn’t take any trades. I was simply practicing my analysis and see where i was heading with this.
4hr and the daily showed a confluence of the 61.8 and the 38.2 matching and where price continued to fail to the and make its way to the downside. With the overall view of the daily showing two pushes to the downside and the 4hr showing the same showed me that there could be a possibility for price to head and the same direction.
With the daily showing a complete down trend and also doing my analysis on the daily and the 4hr. It made me believe that there will be a bearish trend continue to happen on the 1hr.
the candles of the bulls where weakening while the bears where continuing to dominant them.
It broke the HL sequence while it made new LL.
With price at (.68012) Where the pull back is just 10.2 pips shy away from the fib 38.2 it still qualify in my rules for a pull back which gave us a continuation of the bearish trend and for price to keep going at the direction of the market. plus it hit a resistance level with the 38 as well.
Looking forward Also with the resistance level and support level you can see a small Consolidation within a range. I was looking for the resistance level to be tested by price and to break out of Structure . If price come to test that level and respects it we would see the push continue within the box, breaking the previous low which at (.66875) which was at support and break the trend line and retest it and fail down to the downside before turning over to the opposite direction which is bullish. So allowing the price to finish box 2 projection before tuning over.
I use news as a references, i don't trade with the news. But the FED cuts and the employment rate cuts in Australia also had a impact on the market as well for it to continue it in a bearish market.

Marked this 2 Days ago lets goooooo, Waiting for retest of TL.Waiting for retest of TL for a buy, until will short.

Wyckoff Analysis EUFirst go at Wyckoff chart analysis here on EU. Markdown appears to be on the way!


Interesting Markup of USDJPYThis kind of looks confusing but "bull" with me.
Basically, I was practicing the top-down analysis to mark up the graph and so far its currently looking like a buy.
The Larger purple box represents the weekly candlestick that I had highlighted, from them we zoomed in on the hour 4-time frame and highlighted the most recent candle in green and began identifying the structure of the highs and lows with the orange boxes.
Currently waiting for a good entry with the M15 time-frame

JSE:PSG Markup StartingPSG was in an accumulation TR and is currently breaking out. After a last point of support (LPS) and back up (BU) to the TR we now see a break out with some volume indicating the markup has started.
