Maskusdt Update Maskusdt
I am expecting price to breakdown from this channel after this uptrend as i mentioned
Let's see, for now we have to wait for confirmation no need to take unnecessary risk
Note : This is jist an early prediction, do your own research before taking any decision
MASKUSDT

MASK/USDT - Mask Network: BBand_Breakout◳◱ A Bollinger Band breakout has been identified on the $MASK / CRYPTOCAP:USDT chart, as the price has breached the upper Bollinger Band. This occurrence suggests the emergence of a potential bullish trend. Noteworthy resistance levels can be observed at 3.917 | 4.241 | 4.888, while significant support zones are located at 3.27 | 2.947 | 2.3. It is advisable to contemplate initiating a buy position within the present price range of 3.828 with the objective of attaining higher price levels.
◰◲ General info :
▣ Name: Mask Network
▣ Rank: 108
▣ Exchanges: Binance, Kucoin, Bybit, Huobipro, Gateio, Mexc
▣ Category/Sector: Services - Data Management
▣ Overview: None
◰◲ Technical Metrics :
▣ Mrkt Price: 3.828 ₮
▣ 24HVol: 17,949,148.173 ₮
▣ 24H Chng: 0.552%
▣ 7-Days Chng: 6.04%
▣ 1-Month Chng: -3.22%
▣ 3-Months Chng: -18.17%
◲◰ Pivot Points - Levels :
◥ Resistance: 3.917 | 4.241 | 4.888
◢ Support: 3.27 | 2.947 | 2.3
◱◳ Indicators recommendation :
▣ Oscillators: NEUTRAL
▣ Moving Averages: STRONG_BUY
◰◲ Technical Indicators Summary : BUY
◲◰ Sharpe Ratios :
▣ Last 30D: 0.33
▣ Last 90D: -0.43
▣ Last 1-Y: 1.27
▣ Last 3-Y: 0.69
◲◰ Volatility :
▣ Last 30D: 0.66
▣ Last 90D: 0.88
▣ Last 1-Y: 1.65
▣ Last 3-Y: 31.84
◳◰ Market Sentiment Index :
▣ News sentiment score is N/A
▣ Twitter sentiment score is 0.48 - Bearish
▣ Reddit sentiment score is 0.74 - Bullish
▣ In-depth MASKUSDT technical analysis on Tradingview TA page
▣ What do you think of this analysis? Share your insights and let's discuss in the comments below. Your like, follow and support would be greatly appreciated!
◲ Disclaimer
Please note that the information and publications provided are for informational purposes only and should not be construed as financial, investment, trading, or any other type of advice or recommendation. We encourage you to conduct your own research and consult with a qualified professional before making any financial decisions. The use of the information provided is solely at your own risk.
▣ Welcome to the home of charting big: TradingView
Benefit from a ton of financial analysis features, instruments and data. Have a look around, and if you do choose to go with an upgraded plan, you'll get up to $30.
Discover it here - affiliate link -

MASKUSDTHello, I posted a signal (pinned at the bottom of the post) regarding this position. Please, if anyone has opened it, let's discuss it here. Market analysis indicates a bearish trend, and we might potentially experience a slight decline. Thank you.

Mask long idea hello Traders, here is the full analysis for this pair, let me know in the comment section below if you have any questions, the entry will be taken only if all rules of the strategies will be satisfied. I suggest you keep this pair on your watchlist and see if the rules of your strategy are satisfied. Please also refer to the Important Risk Notice linked below.

MASKUSDT📊 #MASKUSDT
⏱ TIME: 1D
📝It is reaching very important areas for spot purchases, and you can make purchases in a gradual and managed manner. It has also been checked for fundamental analysis and is a sustainable and strong project for the future.
📍The initial buying limit: 3.660 $
📌TP1: 4.74 $
📌TP2: 5.84 $
📌TP3: 7.19 $
❌SL: 3.04 $

MASK – Break out of Descending Channel• MASK is trading inside a Descending Channel for 110 days.
• Currently, it looks as if MASK is breaking out of the channel to the upside.
• Confirmation: break above 3.92 USDT and hold it as support.
• Target: 5.88
Trade Idea:
• Entry: 3.92
• SL: 3.54 (tentative, SL below previous low)
• TP: 4.94, 5.88.
• Target: 5.88 (Could go a lot higher)
• R: R: 1:4.76
NFA.
What do you think? Please share in the comments.
Best Wishes

MASK final target 912h time frame
-
MASK retesting the downtrend and creating a 1h triangle structure
Here~3.1 is good entry zone to get great RRR
TP:
1) 5.4
2) 6.5~7.2
3) 8.9~9.8
SL: 3


Seems Like Is Ready For Massive Bullish Impulse Seems Like Ready For Massive bullish Impulse Falling Wedge breakout Has already Confirmed Retesting In Process Incase Of Successful Retest expecting Move towards 7$

maskResistances can be seen in the red lines, if it can pass, it will have a very good growth. For a more suitable purchase, the green lines can be checked.

MASK is Having a Hard Time
For the time being MASK is still stuck in a bearish Channel.
On June 21st -22nd, MASK had a chance to break above a former support trendline, now turned into resistance. Unfortunately, it failed.
Next stop, IMO, is the 3.26 USD Support level. If it holds MASK can try for higher.
This could also be a chance to try a long position with the invalidation below support. Not a high-confidence trade but the R:R ratio is insane.
If MASK fails to hold the 3.26 USD level, next stops are 3.06 USD and 2.6 USD.
Just to be clear, I am bullish on MASK. I think it has enormous upside potential. The only question IMO is when will MASK resume its uptrend, not if.
Trade Idea:
Entry: 3.06
SL: 2.87
Target: 7.2

MASK Network Falling Wedge PatternCrypto MASK has recently formed a falling wedge pattern, which could potentially signal a bullish reversal in the near term. The falling wedge is a chart pattern characterized by a series of lower highs and lower lows, converging towards a point. This pattern typically suggests diminishing selling pressure and a potential breakout to the upside.
In the case of MASK, the falling wedge pattern indicates that selling momentum may be waning, and buyers might be stepping in. This could lead to a potential price surge towards the projected price target of $4.50.
Looking forward to read your opinion about it!

MASK long positionMask start bull run from bottom of channel.
Targets are midline and top of channel.

📉 Massive Market Shakeup! MASKUSDT Plunging Towards New Lows! Triangle Breakdown: MASDKUSDT recently experienced a significant breakdown from a triangle pattern, indicating a shift in market sentiment. This breakdown has captured the attention of traders and investors alike.
Multiple Touch Trendline Support: After the breakdown, MASDKUSDT found support at a well-established trendline that has been touched multiple times in the past. This support level is crucial for determining the cryptocurrency's next move.
Retest of the Triangle: The current price action suggests that MASDKUSDT is poised to retest the triangle from which it broke down. This retest will serve as a critical juncture, potentially determining whether the downward momentum will continue.
Potential Downward Momentum: Traders are closely monitoring MASDKUSDT as it approaches the triangle retest. If the cryptocurrency fails to reclaim the triangle's support and continues to show weakness, it could pave the way for further downward pressure.
Trading Strategy: Traders with a bearish outlook might consider entering short positions if MASDKUSDT confirms the triangle retest and demonstrates sustained downward momentum. Proper risk management and stop-loss orders are essential to navigate the volatile market conditions.

MASK - The Cleanest Shirt in the Dirty Laundry• MASK has been one of the coins that performed the best during 2023. During the month of October 2022 MASK made an astonishing 500% on the back of the hype of Elon Musk’s purchase of Twitter. Since then, it has kept the uptrend and only lost the 200D EMA on June 10th, 2023.
• Unlike other coins, MASK’s uptrend is not completely lost. MASK needs only an 11% price appreciation to be above the up-trending support line, the 200, 50 & 21 EMA’s. MASK doesn’t have a lot to go to be bullish again.
IMO, the only factors that can work against MASK are:
1. All the resistance is clustered together in a tight range.
2. A recovery of the crypto market is not yet certain.
• If Bitcoin regains bullish momentum and pushes up, IMO, MASK will outperform not only Bitcoin but many of the altcoins.
• If we assume that MASK’s performance during the bear market is indicative of future performance; I fully expect MASK to at least make it to its ATH, maybe more.
My Trade Ideas:
1. This one is a bit risky. The premise of this idea is that the Bitcoin correction is over, which is not certain. It is not a bad idea if you have high conviction about MASK and you want to buy a spot bag or trade without leverage.
Entry: 3.64
SL: 3.04
TP: 4.87, 7.33, 13.26
2. This is a more conservative approach. Let MASK reclaim the trendline and the EMAs and go long above resistance.
Entry: 4.87
SL: Below the trendline
TP: 7.33, 13.26 and leave a moon bag.
NFA
What do you think? Please share in the comments
Best wishes to all

MASKUSDTAfter a good performance, the mask has now taken a bearish shape and is under a static resistance and a dynamic resistance, which caused the formation of a double top pattern a few days ago. My prediction for the next few days is that the price will move towards historical support and possibly Failure is support. which you can see in the chart.
⚠️ "Daily crypto market analyses I provide are personal opinions & not financial advice. Trading carries risks, so do your own research & seek advisor's help."

The MASK Has Fallen 🤿 Now What?Hello TradingView Family / Fellow Traders. This is Richard, also known as theSignalyst.
MASK is overall bullish trading inside the rising channel in blue, and we are currently in a correction phase approaching the lower blue trendline.
Moreover, the zone 3.5 is a support zone .
🏹 So the highlighted purple circle is a strong area to look for buy setups as it is the intersection of the green support and lower blue trendline.
As per my trading style:
As MASK is sitting around the purple circle zone, I will be looking for bullish reversal setups (like a double bottom pattern, trendline break , and so on...)
📚 Always follow your trading plan regarding entry, risk management, and trade management.
Good luck!
All Strategies Are Good; If Managed Properly!
~Rich

MASKUSDT → Preparing to break through the resistanceBINANCE:MASKUSDT is squeezed in a triangle, a breakthrough of resistance can form an implus within which the cryptocurrency pair can strengthen to 6.990.
BINANCE:MASKUSDT is in an uptrend. It is worth paying attention to the strong support of the uptrend channel and the 200-day uptrend average. The line confirms the presence of a strong support, which was false-break-down three days ago.
Statistically, the strongest moves occur after a false-break-down.
We might see a break-up of the local resistance, but in that case the bulls will have to be tough to control the market.
MA-200 is a strong support
MA-50 is a resistance that might be tested soon.
Strong support: uptrend channel support at 3.758
Strong resistance: downside line, 4.840 level
I expect the end of the consolidation by break of the resistance and bullish momentum to 4.840, and then to 6.990.
Regards R.Linda!

MASK IS LOOKING STRONG AND BULLISH!MASK did a breakout on 1H and 24H Timeframe it looks bullish to me.
i think that MASK will go UP after this Breakout. I will wait for the Retest and watch for the volume to come! Looks good to Book some profits!
MASKUSDT Analysis on 1H and 24H time frame ⏰.
The line coming from upside is 24H TF TRENDLINE!
STOPLOSS IS MUST!
THIS IS NOT A FINANCIAL ADVICE. JUST SHARING MY IDEA WITH YOU GUYS.
Trade safe. :)

SHORT ZONES 5 - 5.5On daily TF
BINANCE:MASKUSDT has touched and declined 4 times from #AscendingChannel
Now, it's around 4.61 and moving up to 5 - 5.5 before drop again.
Let's wait and see

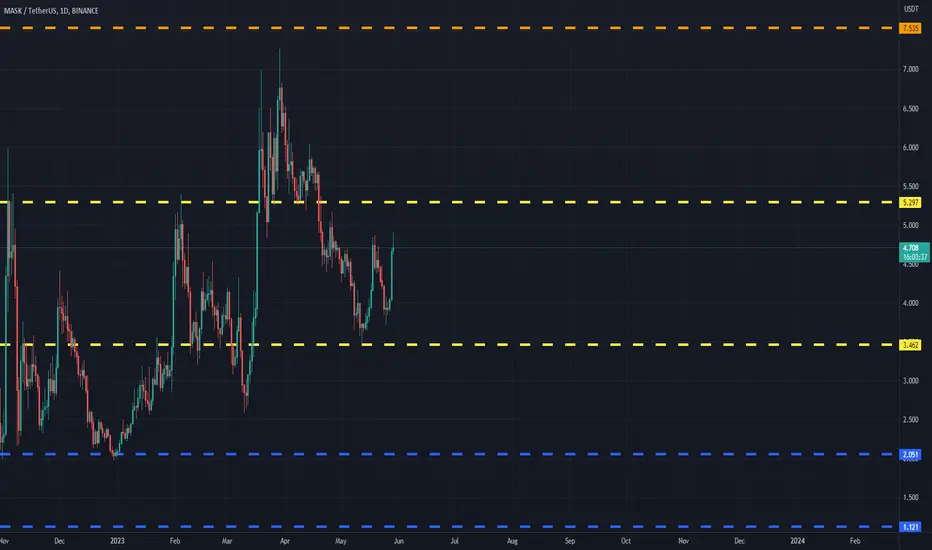
MASKUSDT(Mask Network) Daily tf Range Updated till 29-05-23MASKUSDT(Mask Network) Daily timeframe range. nothing changed much ever since i last updated the chart. dropped back to #3.462 and retraced back. #5.297 still a valid open space. volume is still not there if it comes its possible to reach there again.
MASK Short Trade reason of this trade
*Rejection from 1Hr Resistance Zone
* After Fake Brake-out
* Buyers are trapped
I'm in this trade

