Ascending PositionMATIC, positioned at the top of the Fibonacci 0 zone, indicates a potentially strong base for growth, particularly if Bitcoin's price rises.
This correlation with Bitcoin's movement implies that a positive trend in Bitcoin could significantly benefit MATIC.
This analysis is for informational purposes only and should not be considered as financial advice.
Matic

Uptrend turning point : 0.9483Hello traders!
If you "Follow" us, you can always get new information quickly.
Please also click “Boost”.
Have a good day.
-------------------------------------
(MATICUSDT chart)
(1M charts)
Since it has not yet risen above the MS-Signal indicator, it is difficult to say that it has turned into an upward trend.
Accordingly, the key is whether it can rise above 0.9279.
(1W chart)
The key is whether the price can be maintained above 0.7529 and rise above 0.9391.
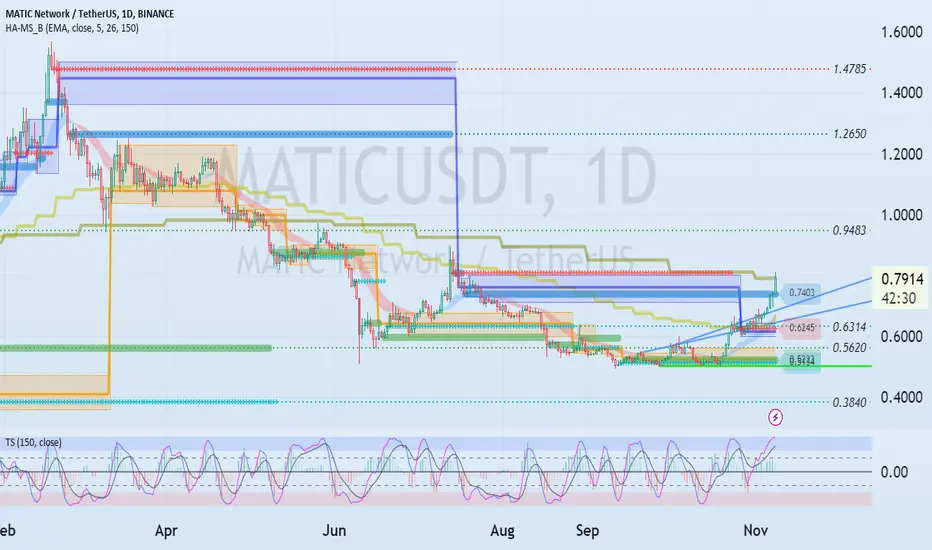
(1D chart)
Looking at the overall picture, I think the range from 0.3840-0.5620 to 0.9483 is an important support and resistance range.
Accordingly, the direction in which one deviates from this section is important.
This is the current 1M chart's M-Signal indicator touched.
Therefore, the key is whether it can rise above the M-Signal indicator on the 1M chart and rise above 0.9483.
If this is not the case and it falls below 0.7403, there is a possibility that it may fall to around 0.6314, so you need to think about a response plan.
If the price rises above 0.9483 and holds, it is expected to turn into an upward trend.
--------------------------------------------------
- The big picture
The full-fledged upward trend is expected to begin when the price rises above 29K.
This is the section expected to be touched in the next bull market, 81K-95K.
-------------------------------------------------- -------------------------------------------
** All explanations are for reference only and do not guarantee profit or loss in investment.
** Trading volume is displayed as a candle body based on 10EMA.
How to display (in order from darkest to darkest)
More than 3 times the trading volume of 10EMA > 2.5 times > 2.0 times > 1.25 times > Trading volume below 10EMA
** Even if you know other people’s know-how, it takes a considerable amount of time to make it your own.
** This chart was created using my know-how.
---------------------------------

🔥The Whales Support Tezos Price: Breakout Of Huge Channel❗️🔥XTZ in a bullish trend since whale support the price at the bottom of the channel (green area). Now XTZ breaks the channel and tests it as the support which is bullish sign.
If Bitcoin continue it's grows or consolidation at least, the price of all altcoins will go up. Especially, price of altcoins that still close to the bottom as XTZ.
💥 The two targets are on chart. $2 and $4 are the biggest resistances.
like❤️ and follow

🔥RSR Broke 2-Year Wedge: LOOK AT THE BUY SIDE❗️🔥Reserve Rights broke it's massive resistance and now have a huge growth potential. The pump of altcoins is possible only in case of Bitcoin growth and RSR have to become one of the gainers.
Now the price tests the key level and support (buy side). It's a bullish sign.
💥The 2 main (mid- and long term) targets are on chart.
like❤️ and follow

Is a double top forming on MATIC?I want to draw your attention to the fact that a technical analysis pattern called a double top is forming on the MATIC chart.
In case the local neckline, which is at a strong Fibonacci level of 0.618, is broken, we can expect the price to drop to around $0.56.
I believe it may be a good idea to place buy orders for the asset in the zone of $0.58-$0.60.
Please note that this is not financial advice, and any actions you take are at your own risk!

🔥 MATIC: Preparing For A Bearish MoveMATIC has yet again rejected from the main bearish resistance that has been plaguing the bulls for years. I'm not sure if we will go all the way down, but in case we do, I want to be prepared.
I'm eyeballing the bottom support as a major area of buying, therefore I'm going to be patient until this area has been reached. Bears can play, but bulls will in the end win.
With a stop below the October lows and a target at the all-time high we can construct a highly profitable trade. Patience.

🔥SNX Trying to Break 1-year Channel: What Are The Targets❓🔥SNX is the top gainer and grow for 2 months straight. Now the chart shows that SNX doesn't have enough power for the futher growth. Only the breakout of the channel and test it as the support will confirms the bull power.
Possible that price can fall to the middle of the channel. I think that it will be a good entry point in long. You need to pay attention on Bitcoin of course to make the right decision.
💥The 2 targets are on chart. Enjoy it!
like❤️ and follow

🔥FTX RESTART CAN SEND THE TOKEN TO NEW HIGHSThe first wave of FTT growth begins on the news about the exchange relaunch. I bought this altcoin at $1 and wrote about it here.
The second wave of growth could start on the news about Binance regulation and upcoming FTX relaunch.
💥 The targets are on chart!
like❤️ and follow
MY FIRST IDEA ABOUT FTX Token. The FTT/BUSD pair was delated and I can't make an update of the idea. Check it!

Altcoins bearish short term? Hello everyone,
On today's video we talk about several Alts that result being bearish in the following weeks.
However, this might change with new year comming.
Seb.

#Matic Wait For ConfirmIn case of breaking the 88 cents range, which a high-pressure candle wants to buy, you can enter a buy transaction in pullback. Considering that in the 4-hour period, it is placed in a corner of density, this failure from above can continue up to the specified supply area and the specified areas can continue.

🔥1INCH Is Still At The Bottom: $2 Is A Top Target❗️1INCH is still at the bottom and testing the top of the channel. If the price will break the channel, the price will go up.
I marked 2 targets on the chart. The closest target is at $0.91 key level and the next target is $2.
💥 Is the altseason coming soon❓
like❤️ and follow

Matic and BTC getting bullish!? Hello everyone,
Today we are talking about BTC and MATIC and the huge potential cryptocurrencies still got.
Please note all the %s given in the video are simply base on assumption and could not be accurate.
Please do not use this video to invest your finances in hope for future profit.

Polygon Portal Live as New Era Beckons for EcosystemEthereum-based layer-2 scaling solution Polygon (MATIC) has scrapped its proprietary Wallet Suite in favor of its newly launched Polygon Portal.
New era ushered in
With the Polygon Portal, the protocol says users and developers can now gain proper access to most of the solutions associated with the Polygon Chain. Through the Polygon Portal, users can now explore comprehensive dashboards for Polygon PoS, Polygon zkEVM and Ethereum.
Among the benefits of the new portal include Unified UX for bridging, Third-Party Bridges, the ability to refuel gas and access to explore developer tools. The Polygon Portal also comes with comprehensive documentation, and users will have access to support and the ability to provide feedback.
Polygon is constantly evolving, and this evolution is showcased in its ability to revamp its solutions such that they are typically more usable by both developers and users alike.
The advancement in its design accounts for why the protocol is the top destination for many enterprises and organizations entering the Web3 ecosystem. The soccer world-governing body FIFA just moved its non-fungible token (NFT) collections from the Algorand blockchain to Polygon.
This complements related moves by other firms like Starbucks and Flipkart with active loyalty programs hosted on Polygon.
MATIC price in mix
The broad-based improvement in the Polygon ecosystem has an underlying, though indirect, impact on price. At the time of writing, Polygon has jumped by 2.67% to $0.8646, extending its weekly gains to 8.16%, according to data from CoinMarketCap.
With the launch of the Polygon Portal a show of consideration for developers, we may see more of an influx of innovators into the ecosystem, with new dApps introduced that can drive demand for MATIC.
Alongside the POL rebranding that is underway, the upside for the protocol’s native token in the long run is enormous.

🔥Litecoin Is The Top Underperformer: Let's See in 4 Weeks❗️Litecoin is the underperformer among the top altcoins. OP, AVAX, SOL, INJ are already skyrocketing.
It's very important to note, that close inside the channel will be a strong bullish signal. If it not happen, the price will go down to the key local.
💥 The 2 local bull targets are on chart. Let's print!
like❤️ and follow

MATIC target 1.4712h time frame
-
MATIC is creating a potential double bottom structure. Taking a step forward to the lower time frame, MATIC just retested 0.5 Fibonacci Projection, which final target is 1.47. Also, use Fibonacci Extension on the wave from 1.568~0.492, it shows the first target at 1.44, which is closer to target from Fib Projection, and 1.44~1.47 is the neckline of this potential double bottom. Further, if MATIC complete this double bottom, final target will be 2.64.
-
TP: 1.44~1.47
SL: 0.7145

🔥Cyber Is a Future Binance Top Gainer: Pay Attention To It🚀🔥CyberConnect (CYBER) is the fresh altcoin on Binance. As usually, this is a low cap altcoin with the huge growth potential.
It fall and liquidate a lot of leverage traders along with Bitcoin pullback to $40,000. I think that the small "window" of opportunities is open before the real altseason.
💥 The 2 local targets for this altcoin is on chart.
like❤️ and follow

SasanSeifi 💁♂ A Price Analysis of the 4-Hour TimeframeAs you can see in the 4-hour timeframe, the price has been in an uptrend from the demand zone at 0.73. It broke through the HIGH at 0.79 and grew by approximately 14% to the price range of 0.83. After the growth, the trend is currently range-bound in the price range of 0.80. In the 4-hour timeframe, it is very important to maintain the support levels of 0.80/0.79 cents for the continuation of the bullish trend of the symbol.
The expectation that we can consider in the 4-hour timeframe is that, if the support levels are maintained, we will see the price grow to the liquidity range of 0.87. Then, after a partial correction and pullback, it will again be accompanied by further growth up to the supply area and the bearish order block of the price ranges of 0.90 cents and 1 dollar. The possible trend is also shown in the above image. In the event of positive fluctuations, it will be important to see how the price reacts to the liquidity range of 0.87 cents to better understand the continuation of the movement.
🔵Remember, always conduct your analysis and consider other factors before
making any trading decisions. Good luck!"✌️
❎ (DYOR)...⚠️⚜️
Sure, if you have any more questions or need further clarification, feel free to ask. I'm here to help!
if you found my analysis helpful, I would appreciate it if you could show your support by liking and commenting. Thank you!🙌✌

MATIC/BTC huge move About to happenMATIC / BTC
This massive horizontal support against BTC was greatest one for MATIC since 2021 and never broken since that
Price is testing it again and on a quickly reaction the weekly candle got absorbed indicating bulls are buying here
If bulls will save their ass here again, mega bullish move will be followed for MATIC in next weeks in both BTC and USDT charts
If this support lost we gonna cash hard
#DYOR

MATIC/USDT 4HInterval CHARTI invite you to review the MATIC chart taking into account the four-hour interval. As we can see, the price has broken the downtrend lines, but currently we can see the price climbing the local upward trend.
Looking at the current growth, using Fib Retracement we will determine the places of further resistance that the price must face. And here you can see that we have gone above the resistance at the level of 0.618FIB, and are approaching a strong resistance zone from $0.93 to $0.98, when the price breaks above the resistance and positively tests it, we can see a move to around 1, $15.
Looking the other way, there is support at $0.84, then we have a second support around $0.79, and then there is a support zone from $0.76 to $0.72.
The CHOP index indicates that the energy is currently used for an upward movement, the RSI indicator is approaching the upper limit, but there is still room for a larger move, while the STOCH indicator is moving above the upper limit, which may limit the price increase in the coming time.

LDO vs MATIC 3day ChartLDO and MATIC here, as you can see on MATIC, when 200MAs formed it went parabolic (14,000%)
History doesn't always repeat, but it does rhyme. LDO should moon eventually, maybe after BTC halving.
These moving averages will form in about 20 days. If they form under price, in theory, it should be bullish. Also, it is possible for price to get pulled into these newly formed moving averages and then spring off of them. Notice it happened on MATIC.
I don't want to miss the LDO train when it leaves the station. I will probably acc. from here and dip down into the 3day white 100 if we get that.
Thanks for your time. Please follow here for more!

Matic short ⏰ period analysis 📌Completely ⚡ short period analysis based on Trend support and supply and demand
With movement shift // pls #DYOR
👉 I am expecting COINBASE:MATICUSD shifted 🙄 it's movement bullish side 😛 in day frame LL >> HL
Use 1% position size of ur liquid 💰
Leverage must be below 4X cross 🤞
⏰ expecting 30-50 day's below later invalid 📌
🔥Buy :: $0.5 - $0.54 < split liquid 💰 60% - 40% >
🎯 :: $0.6238 - $0.6475 < move stop lose to entry or profit >
🎯 :: $0.7280 - $0.7575 < 💯% exit >
Stop 🚏 lose < #SL > ::- $0.4804

The Crypto Bull Run has Begun: SOL to 20xLONG TERM CRYPTO VIEW
The crypto bull run has begun and with the BTC halving coming in 2024, it's just a matter of time before BTC hits new highs and altcoins follow.
BTC is, of course, the bellwether of the crypto market but it is not my biggest position. I am heavily weighted to Solana as I believe it will act how Ethereum did in the previous 2021 peak cycle. Solana is a similar "platform-type" cryptocurrency like ETH that allows for applications to be built upon it, but the network is far superior. Transaction fees are lower, speed is higher, and I believe SOL has the scalability to compete with ETH in the long run. I am not suggesting SOL will overtake ETH's market cap any time soon because ETH will rise in a bull run too. ETH's market cap is about 10.6x that of SOL. If my predictions for the bull run peaks are accurate, this will decline to about 3.75x as SOL outperforms ETH by 3x in the coming cycle.
The charts here are a logarithmic analysis and if I'm correct about Sol being the ETH of this cycle, we should see a $1200 peak, give or take. $600 minimum and up to $2500 wouldn't surprise me. Crypto can surpass even your wildest expectations.
In the short term, I expect a BTC consolidation and maybe a local top when ETF approval hits.
Best of luck out there.
