🔥Bitcoin Is About to Make a HUGE Move:$47,000 or $23,000 first❓🔥My thought on Bitcoin and amazing opportunities for my followers. Watch the video till the very end!
like❤️ and follow
Matic

🔥Bitcoin and Altseason: Do You Still Have Chance To Buy Crypto❓🔥Bitcoin is growing from $17,000 to $44,000 in less then a year. I bought it there and still hold it with other the most promissing altcoins.
I explained my thoughts about crypto and the upcoming opportunities in the NEW video. Enjoy watching!
like❤️ and follow

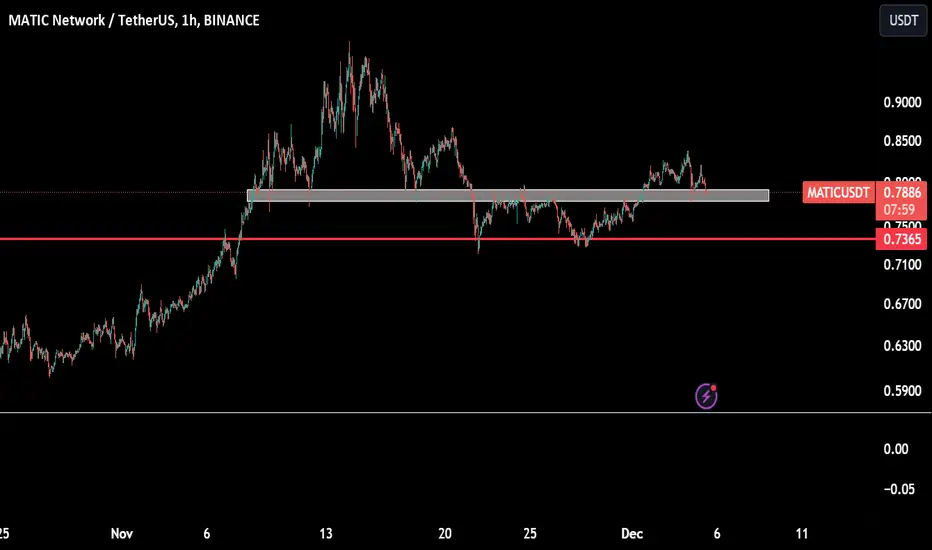
MATIC Doesn't look goodLose the rectangle box, and MATIC doesn't look so good. Red line could be next very fast
#QUICK #quickswap is extremely undervaluedThis important DEX has not played it' s move yet... Technicals are showing a great potential to make an unforgettable pump, especially on #binance derivatives.
NOT FINANCIAL ADVICE.

MATIC keep bouncing off 78.6 FIB, preppin for UPSIDE.MATIC, keeps touching the 78.6 FIB level -- and it keeps being rejected to the upside. This convey a strong order block support at this range.
Expect matic to go horizontal for a bit before a significant price change to the upside. The squeeze to the upside is imminent.
Spotted at 0.98
TAYOR.
MATIC/USDT Navigating the Bullish Wave? 👀🚀MATIC Today Analysis💎 Paradisers, set your sights on #MATICUSDT, as it weaves an intriguing narrative in the crypto arena. Grasping a pivotal support level, MATIC teases us with the high prospects of an upward ballet.
💎 Let's rewind a bit recently, #MATIC has shown us its flair for breaking resistances and gracefully leaping upwards. But after a slight stumble at the resistance of $.9811, it's back in the game, retesting what was once a barrier but now serves as a springboard a transformed support.
💎This dance above the support line is not just movement; it's a crescendo building up to a potential leap. #MATIC, with the poise of a seasoned performer, is eyeing the resistance once again at $.9811, and who knows, it might just pirouette to the lofty target of $1.1868.
💎But Paradisers, the market is an unpredictable stage. Should #MATIC falter in its upward choreography and dip below this critical demand, #POLYGON enthusiasts must brace for a different rhythm. A fallback plan? A potential bullish resurgence from the wings at the support level of $.7244. However, a dip below this mark might dim the spotlight on the bullish trend. 🌴💰

🔮 Mamma Mia: Forza Matic!!! 📈Matic sta facendo rumore nel mondo crypto, amici! 🇮🇹
News:
Italy’s Central Bank Taps Polygon, Fireblocks DeFi Project to Help Institutions Dabble With Tokenized Assets (Link: www.coindesk.com)
Feast your eyes on the journey from the humble scooter to the roar of the Ferrari, and let's ride the Matic wave with style and speed. Always remember, though: in the race for gains, smart driving beats pure speed. 🛴➡️🏎️
It’s can end up strutting through the markets like a classic Italian sports car - sleek, powerful, and turning heads. 🏎️💨 After a strong rally back into a major channel, Matic is hinting at a bullish aria that could hit high notes we haven't seen before. 🎶📈
Guardate questa! The 3.12 resistance level is our prima donna, a spotlight moment where breaking through could see Matic doubling its applause to a 6.00 standing ovation! 👏 But here's the twist - Matic isn’t just any performer; it's got the backing of Italy's central bank, collaborating on a DeFi project. 🏦✨
Check out this dolce piece for a taste of how Matic is marrying tradition with innovation: Italy's Central Bank Dives Into DeFi With Matic (link above).
As they say in Italia, "Il rischio fa parte del gioco" – Risk is part of the game, so manage your portfolio like a fine Italian wine, with patience and appreciation for the journey. 🍷📊
#MATIC #CryptoItalia #DeFi #BlockchainBella #CoinDesk
One Love,
The FXPROFESSOR 💙
Links: ChatGPT seems to be confident in MATIC’s future – Here’s what it said: ambcrypto.com

🔥C98 Copy Aptos But On WEEKLY❗️C98 one of the top projects on Binance. It start to recover after -98% dump and has an amazing potential.
You can see that this price pattern on WEEKLY is very similar to APT patern on DAILY chart. So the growth can be even higher because of the pattern on HIGHER timeframe.
💥 The targets are on chart and bullish pennant start to appear globally. Where will be the next stop for C98? Only Binance knows.
like❤️ and follow

Is Polygon (MATIC) Price About to Explode?MATIC price Action remains neutral, but there are some hidden signals that may lead to price spike.
The Polygon (MATIC) market has been presenting some intriguing signs that have caught the eye of vigilant investors. Recent activities suggest that there has been a silent accumulation of MATIC over the past two weeks, which often precedes significant price movement. With the price ranging during this period, the underlying question is whether MATIC is gearing up for an explosive move.
The price chart reveals that MATIC has indeed experienced a reversal after an unexpected and critical 21% drop. The market's response to this drop is crucial to understanding the future trajectory. Typically, after such a decline, savvy investors look for signs of accumulation as an indicator of potential upward momentum. This is due to the common market adage that "volume precedes price," suggesting that if accumulation is occurring, a price surge may be imminent.
An increase in volume accompanying the price range could indicate that investors are seeing value at these levels and are stepping in to buy, potentially setting the stage for a bullish trend. As seen on the daily MATIC/USDT chart, the volume profile is descending, which hints at a potential trend reversal in the foreseeable future.
Furthermore, we will be watching for a confirmed breakthrough on the charts. This would involve MATIC closing above a key resistance level on increased volume, which would lend credence to the theory that an explosive price movement is on the horizon.

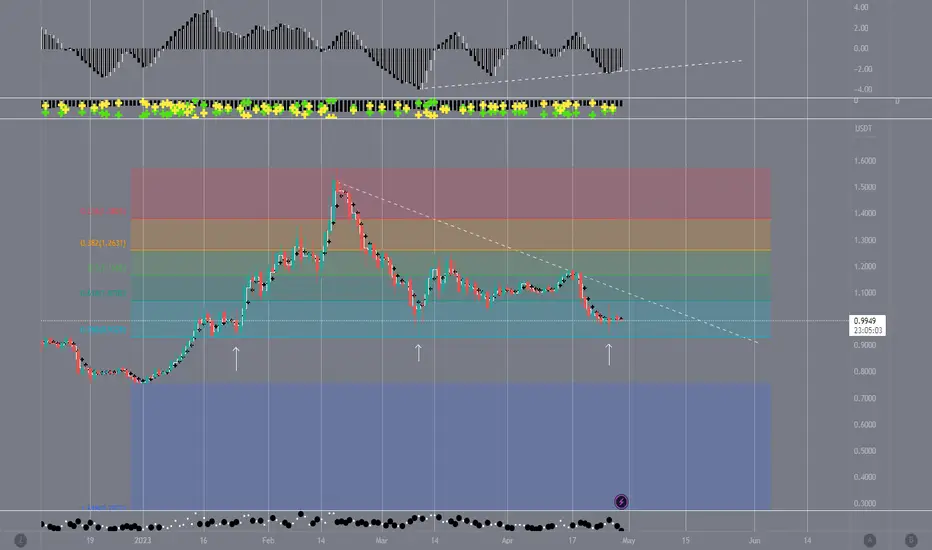
#POLYGON #MATIC Long-Term targets, until end of 2025#POLYGON #MATIC Long-Term targets, until end of 2025
According to Elliott's wave count indicated on the chart, the rise from 2020 to 2021 took place during a five-wave, where either wave 1 is bigger than a five-wave or wave A is bigger than a three-wave.
Considering the possibilities ahead, we can estimate the possible goals of Link until the end of 2025 as follows:
TARGET1: 8$
TARGET2: 24$
TARGTE3: 48$
TARGET4: 145$
ENTRY: 0.85-0.60$
STOPLOSS: 0.50$

Going Long Matic here to 90 Cents PlusThis looks to be good support here for Matic. I have waited patiently for entry and .74 cents looks to be as good as any with all SMAs (50,100,200 day) on the underside for support along with a significant level. Also, RSI has reached support in conjuction with the pullback here. I will be taking profits along the way and expect to be out 75% by the time we reach .95 cents, dragging my stops up along the way to ensure the trade is all profit. I expect to let the remaining 25% ride after hitting .95 cents in hopes that it may jump up and above that ascending TL which would be uber bullish for this coin.
Entry - .7424
Target - about .95
SL - currently .60 (my stops are very loose)
RRR - 1.5 (better with tighter SLs of course)
This is not fin advice. I show you the way I trade for your education and entertainment only.
Stewdamus

MATIC: Pullback in UptrendPolygon (MATIC) technical analysis:
Trade setup : Following a bullish breakout from Sideways Channel ($0.50-$0.60), price broke above 200-day moving average, which confirmed a bullish trend reversal to Uptrend. Price reached our target of $1.00 resistance where it got rejected and pulled back. How far could it pull back? The nearest horizontal support area is $0.75, which also lines up with a 50% Fibonacci retracement level and could be an attractive swing trade entry in Uptrend, with upside potential back to $1.00. The next support area after that is at $0.69, which is a 200-day MA level and also a 61.80% Fibonacci retracement level.
Trend : Neutral on Short-Term basis and Uptrend on Medium- and Long-Term basis.
Momentum is Mixed as MACD Line is below MACD Signal Line (Bearish) but RSI ~ 50 (Neutral).
Support and Resistance : Nearest Support Zone is $0.75 (previous resistance), then $0.60. The nearest Resistance Zone is $1.00.

$MATIC Price Action strategy.CRYPTOCAP:MATIC
Polygon on the 1-hour timeframe faced rejection near the 50 EMA line (colored red), favoring the bears as the price broke through the previous support and is now approaching the Optimal Trading Zone (OTZ). It is crucial to remain vigilant, set alerts, and be prepared for the price to descend into this zone. As part of my strategy, a confirmation for a double bottom pattern will be considered if the price closes inside or above the OTZ. This confirmation will serve as the trigger for initiating a CRYPTOCAP:MATIC trade.

MATIC USDT SPOTMatic usdt next target is 1.5500$ because it has break the level of upper trendline and also it is at good buying area of 0.7795, accumulate it before it goes up to the target and you miss it, next bull run is going to start so get in that before it started

MATIC/USDT - H&S Neckline Was Broken !MATIC/USDT is showcasing a classic bearish head and shoulders pattern
with a defined neckline that has recently been broken. As Price has had a nice breakdown, it did not have any re-tests of that same broken zone of neckline.
We are seeing a good chance of our target zone still being reached, but we might see a slight bullish movement, maybe to re-test that same neckline zone.
Swallow Team

Matic new ATH?Last my TA about #Matic played out perfectly both ways.
Here is update:
as long as price stands above 0.72$ I expect the continuation of the uptrend towards to 1.28 -1.38$
Below 0.72$ we may see lows again.

🔥MINA Is Breaking 1-year Falling WedgeMINA fell by -95% and retailers are so scared. The 1.5 years of falling forced them to think the new traders and investors that dumps will long forever.
But I think that altcoins will reverse as fast as Bitcoin will break and hold $29,200-30,000. This is vitally importatnt for crypto growth.
💥 Now the price is trying to break 1-year falling wedge.
I suppose that MINA will accelerate after the breakout of the wedge and local pullback. The bull support will be confirmed during this pullback.
My firts idea for MINA was hidden, but I told about this even before the breakout of the wedge. My followers knows it.
MINA breaks the key level and consolidates above the first target
For 4 weeks in a row, MINA is in a small trading range after +160% pump. I think the pump will continue as far as BTC reaches $39k. Just wait and protect your profit.
like❤️ and follow

LDO About To Mool Like MATIC MartyBoots here. I have been trading for 16 years and I am here to share my ideas with you to help the Crypto space.
Ive been watching this pattern develop for many months and its now finally getting close to breakout . Be aware
This chart helps show you ALT Season is about to start.
The ALT Market is in its bottoming phase, be prepared. ALT Season is coming. This is the time when its possible to make life changing money .
Do NOT miss out on this coming bull market

#Matic #MaticusdtIt is moving in a descending channel. With the failure of the neck line, this pullback can be the return to the broken structure to continue the path and the bottom of the channel of the specified support range.

MATIC HEAD & SHOULDER TRIGGERED MATIC DOES LOOK GOOD TO ME.
Matic Heaf & shoulder pattern has confirmed triggered. it can take little pull back to trend line but overall it’s heading down side.
this is NOT financial ADVICE...
NEXT STOP FOR MATIC IS 0.58 TO 0.60 AREA.
I AM EXPECTING A LITTLE BOUNCE FROM HERE THAN I LL aggressive GO SHORT TO MATIC

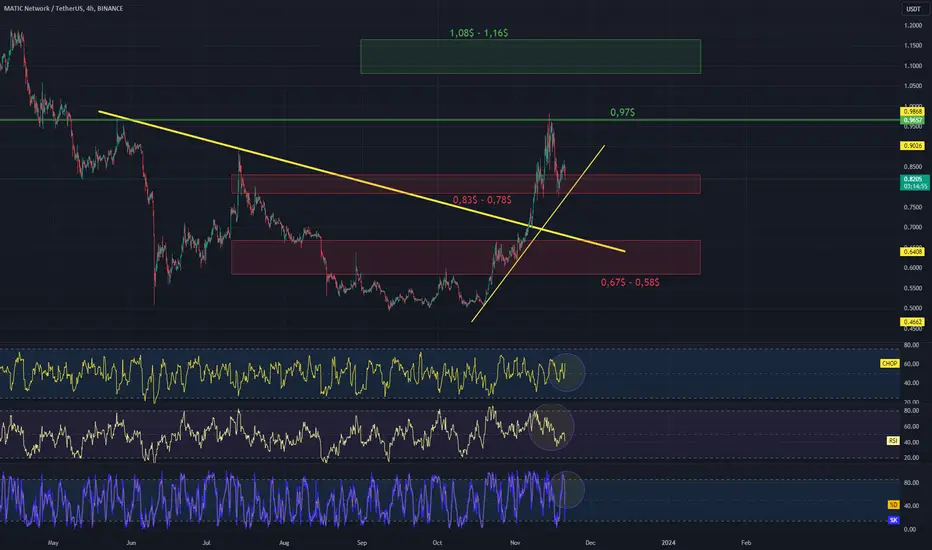
MATIC/USDT 4HInterval Chart Hello everyone, I invite you to review the MATIC chart also at a four-hour interval. As we can see, the price has overcome a strong downward trend line, and is currently moving in an upward trend, staying on the trend line.
In this situation, we will start by checking the resistance levels and here we can notice that the price has been rejected from the resistance level of $0.97, only when it is overcome will we have an open path towards the resistance zone from $1.08 to $1.16, which should lock the price against a larger increase.
Looking the other way, we can similarly determine support areas and here we can see that the price remains in the first support zone from $0.83 to $0.78, while when this zone is broken, we can see the price return to the second zone from $0.67 to $0.58.
The CHOP index indicates that there is still energy for further moves, the RSI indicator remains in a downward trend with room for the price to go lower, also when we look at the STOCH indicator we can see a strong rebound with room for the price to go slightly lower.
a quick review of maticusdtfirst and foremost it is necessary to talk about the current situation of the market.
we witnessed a huge fluctuating price in the last 1 week however it is obvious that the mark decided to go for the downward trend.
additionally, matic has engulfed a very important support area there will always be a reaction toward an enormous support of the market that may have resulted in a short-term upward trend.
eventually, because of the massive fall of the matic, there is probably more seller pressure between 0.9874 $ - and 0.7870 $ so I prefer to get prepared for a sell position this month.

An optimal distribution of cryptocurrency holdings - Educational
Welcome to our video where we talk about the best way to spread out your crypto investments. We'll break down the key ideas and important things to think about when deciding where to put your money in the ever-changing world of cryptocurrencies.
If you have any questions Feel Free to reach out!
