MATIC idea sharing1D chart:
At present, MATIC takes support and resistance at 1.3121 as the key price.
After MATIC fell below the inverse cup and handle pattern (below 1.3121) in April last year, the lowest price reached 0.3157. After that, the price appeared higher low and higher high, and there was a situation of breaking through the resistance of 1.3121.
Pay attention to whether MATIC is effectively supported by the support trend line below.
If the support trend line is broken, a bear flag pattern will appear.
-
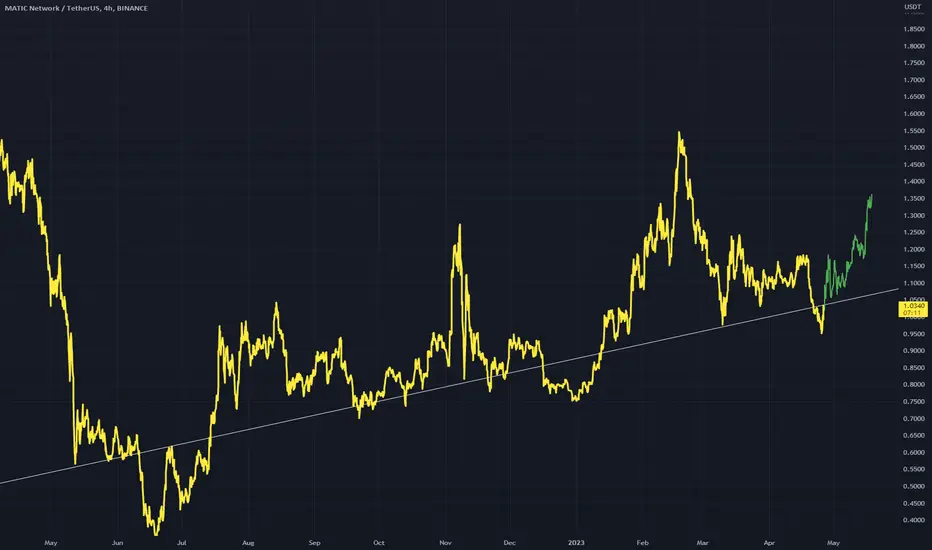
4 hr chart:
In the 4 hr chart, MATIC has shown a triangle convergence pattern and has broken the resistance trend line.
Pay attention to the previous high of 1.2507 and the stop loss price of 1.0239.
If there is a breakthrough of the previous high of 1.2507, there is a chance to challenge the resistance of 1.3121 again.
-
Matic

matic / usdt daily chart short ideamatic / usdt daily chart / short idea
for this short idea price must stand blow the resistant zone and i expect 2 legged pullback toward resistant zone

MATIC - DailyFalling wedge a strong bullish pattern
Horizontal dashed lines are strong support levels
Will we see immediate support or support a bit lower?
Hopefully the whole market breaks out soon its been at this level for a long while

MATIC buyer exhaustion could see prices fall to $0.77The bullish order block on the daily timeframe formed on 18 Jan has acted as strong support back in March
The retest of this zone on 9 March saw prices bounce to $1.24
The subsequent retest in late April did not see a positive reaction- instead, MATIC continued to slide lower from $1.025 to $0.977 over the past two weeks
Therefore a daily session close below the bullish order block ($0.925) and retest of the $0.96-$1 area could offer a shorting opportunity
Entry: $0.996
Exit: $0.837 (a more ambitious target would be $0.77)
Stop-loss: $1.07 (above recent wick)

MATICUSD Is Firmly Breaking Out If you plot a down channel on Matic price emerges victorious above the down channel.
This could be considered a breakout and good for the bulls.
Bullish

MATIC Analysis, A Precarious PositionLet's take a closer look at MATIC and see what its current status is in the market. MATIC, with its current price of 0.9830, is definitely worth some attention. Looking at the RSI of 39, we can see that it's not quite in oversold territory yet, but it's certainly on its way there. The daily timeframe 0 Fibonacci of 0.9435 and daily timeframe 1 Fibonacci of 1.2500 give us a good idea of the potential range of prices MATIC could be trading within.
Meanwhile, the daily timeframe upper Bollinger band of 1.1958 and the lower Bollinger band of 0.8943 suggest a level of volatility for the coin, with the middle Bollinger band at 1.0450 indicating the average level of volatility. The volume oscillator of -19% also suggests that MATIC is not seeing a lot of trading activity at the moment.
On the other hand, the MACD of -0.0377 indicates that there is some bearish momentum in the market, which could cause the price of MATIC to drop further. However, we should also take into account the hourly EMA 50 of 1.0752, which suggests that there could be some support for the price at this level.
Overall, it seems that MATIC is in a bit of a precarious position at the moment, with some indicators pointing towards a potential price drop, while others suggest that there could be some support for the price. It will be interesting to see how these indicators evolve over time and whether MATIC will be able to regain its footing in the market.


short MATICCRYPTOCAP:MATIC bounced off the resistance level and the descending trendline. Decline to support level at $0.94 is likely to happen.

MATIC Polygon Price Targets after the FOMC meeting this weekThe upcoming FED meeting on May 3rd could cause a further decline in the crypto market due to the potential rate hike and ongoing unease around banking system developments.
The outlook for the crypto market after the upcoming FED meeting on May 3rd is bleak.
Fears of a deep credit crunch caused by Silicon Valley Bank's collapse have not yet materialized, and the financial situation is much steadier.
Additionally, inflation remains elevated, and with evidence of stubbornness in underlying inflation, it could be in the 4% to 5% range, far above the 2% inflation target. The markets are pricing in a 25bp Fed Funds rate hike to 5.25% at the May FOMC meeting, and given the steadiness in financial markets, persistence in price pressures, and continued decent activity, this could contribute to a further downturn in the crypto market.
MATIC/USDT short
Entry Range: $0.95 - 1.10
Take Profit 1: $0.90
Take Profit 2: $0.79
Take Profit 3: $0.63
Stop Loss: $1.26

WYCKOFF REDISTRIBUTION SCHE... MATICThe bump and run scenario is working perfectly. It also matches very well with a Wyckoff redistribution schematic.
The road could be bumpy, but the target will be reached I think.

MATIC / USDT BUY LONG 🟢MATIC/USDT BUY LONG 🟢
Leverage 10X
Entry price- 1$
Take profit- 1) 1.03$ 2) 1.08$
Stop loss- 0.97$
Stop loss important
@msrcrypto1
#BNB #BTC #MATIC #SOL #ETH

$POLY primed to flyPolygon has been trading in this channel since June of last year. It's near the bottom of the trend line, which happens to coincide with the 200MA on the daily chart. With all the bullish sentiment around Polygon, and large projects moving their ecosystems onto the chain, I'd expect to see a nice bounce towards the middle of the trading channel; followed by an opportunity to exit with a ~40% gain from current prices in the highlighted box.
Out at or above $1.50 sometime in April, ez gg - NFA.

MATIC(based on NEo wave)there is 2 ways for matic and both of them are bullish also its very very low risk. so if you want to investment or know sombody who wants to investment I think its one of the best crypto currencies for large many because it has good risk to reward from the first target.

#Matic | #Usdt#Signal | #Matic | #VIP_Pack | #NUM_SV37
Long
Entry : ~1.0059
Tps : 1.0439 / 1.0760 / 1.1604 / 1.23 / 1.33 / 1.45 / 1.54
SL : 0.9070
Don’t risk more than 1% of your capital.

MATIC (Y23.P2.Video). Macro outlookHi Traders,
#Matic #polygon #crypto
as per my thoughts on ALTS, we have much to go for ALT season and using Matic as a sample, I try to demonstrate why.
All the best,
S.SAri

matic / usdt 1h chartmatic / usdt 1h chart
2 different scenarios possible for matic
it depend on next candle close price
after huge dump we can expect another leg down from here or top of the range area

MATIC: READY TO PUMPBINANCE:MATICUSDT is up trending and looks bullish more than ever, this clear rejection of the up trend might result in a big pump towards 1.4
3 months old support zone and the 200 daily MA still seem to hold, trade has 3:1 RRR, a potential +40% move.
I will keep updating this trade here, make sure you follow me.


MATIC - A breakout is coming! Given the anticipated downward trajectory of BTC from its current levels, the price of MATIC will likewise experience a decline. Consequently, a break to the downside is expected, and it may be prudent to adopt a wait-and-observe approach for more favorable pricing opportunities.
It's said that one day, the mighty MATIC will set its course for the moon, but for now, it seems to be headed back down to Earth! Keep your eyes peeled and your senses sharp, as this journey promises to be a wild ride filled with unexpected twists and turns! :)

Matic - Trade ExitTraders,
As explained in the video I just released, this recent crypto price action up all simple appeared to be a bull trap. I was growing more and more bearish as I did my video and indeed, by the time the video was ended, I felt it was time to capture my meager profits in MATIC for another very small win and get out! As it was the drop happened so fast, I was barely able to do that.
I will NOT be looking to enter back into any trades until BTC does as I have been expecting it to do (retest that neckline at 25.3k - see vid for more), or until we start to capture some new pivot highs. Until then, alts will probably just follow the big dawg (BTC) down.
Best,
Stew

Quick is about to give a BUY#quick exchange is one of #polygon network' s most powerful DEXes. Technically looking tasty 👀 Not financial advice. #Matic #quickusdt

Key Support and Resistance Levels for Informed Trading DecisionsMATIC is currently trading at 1.0390, with an RSI of 59 on a 4-hour timeframe. Looking at the Fibonacci retracement levels, we can see that the 0.5 Fibonacci level at 1.0697 is acting as a strong resistance, while the 0 Fibonacci level at 0.9492 is acting as a local support. The 1 Fibonacci level at 1.1902 is a solid resistance level that may come into play if the price continues to rise.
The Bollinger bands are another useful tool for identifying support and resistance levels. The upper Bollinger band on the 4-hour timeframe is currently at 1.0387, which is close to the current price and may act as a resistance level in the short term. The lower Bollinger band at 0.9466 is a strong support level that may come into play if the price starts to fall. The middle Bollinger band at 0.9926 can also act as a support or resistance level, depending on the direction of the price movement.
The volume oscillator is currently at 15%, which indicates moderate trading activity. The MACD is slightly negative at -0.0071, indicating a bearish trend in the short term. However, the stochastic oscillator is at 82, which suggests that the price may continue to rise in the near future.
The hourly EMA 50 is currently at 1.0335, which can act as a support level if the price starts to fall. The On-Balance Volume (OBV) is currently at 25.976B, which indicates strong buying pressure.
In summary, the key support and resistance levels on this chart are as follows:
- Local support: 0.9492 (0 Fibonacci retracement level)
- Strong support: 0.9466 (lower Bollinger band)
- Local resistance: 1.0697 (0.5 Fibonacci retracement level)
- Solid resistance: 1.1902 (1 Fibonacci retracement level)
Traders should keep a close eye on the price movement around these levels and use them to make informed trading decisions. It's important to note that technical analysis is just one aspect of trading, and traders should also consider fundamental factors and market sentiment before making any trading decisions.

MATICUSD Is Touching A Major Trend LineMatic is currently dipping but should not be dismissed.
The dip provides an entry point right no the trend line up.
There is a potential for a dip below it in the past but it will be short lived.
Bars pattern shows my recovery thoughts in green.