MATIC IS STILL BULLISHHi, dear traders. how are you ? Today we have a viewpoint to BUY/LONG the MATIC symbol.
It seems that we are about to finish the diametric wave F and soon the bullish wave G will begin. Have this icon on your watch list
For risk management, please don't forget stop loss and capital management
When we reach the first target, save some profit and then change the stop to entry
Comment if you have any questions
Thank You
Matic

MATIC decided to stay above Mema21 after 7 monthsClearly the MATIC has done the first leg run to prove that the downside is limited to 0.7 for now
The price has come out of monthly ema21 after a good sideways zone for about 7 months
The best buying would be now around 1 as the risk is atleast defined and clearly know the downside

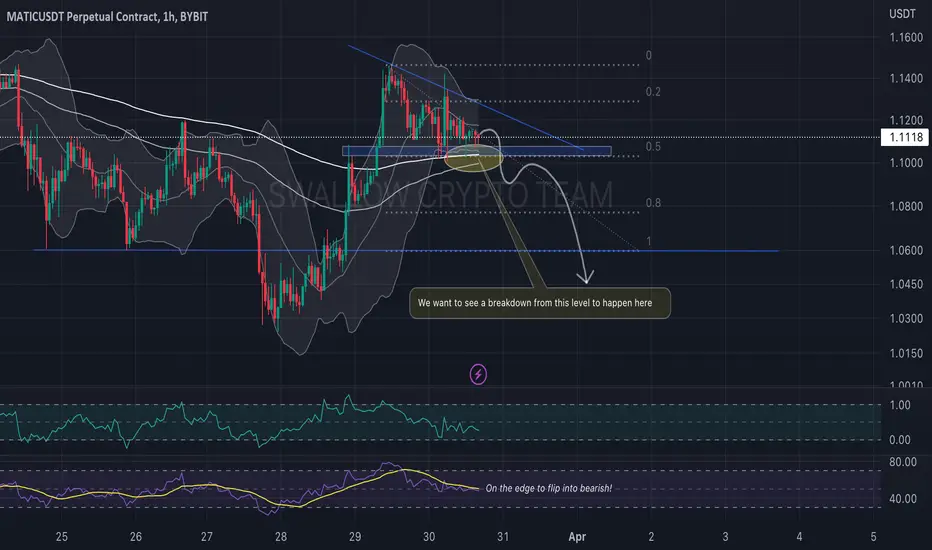
MATIC/USDT Possible To Go For A Re-Test Of EMAsHey guys 👋
MATIC/USDT is another one that caught our attention today. Currently on the edge of breakdown we see a good chance for this coin to show some bearish movement sooner this week. Buckle Up and let's go for a ride!
If you like ideas provided by our team you can show us your support by liking and commenting.
Yours Sincerely,
Swallow Team 🔱
Disclamer:
We are not financial advisors. The content that we share on this website are for educational purposes and are our own personal opinions.
MaTic BreakOut!Matic has broken its descending channel and completed a pullback to it.
There is a higher probability of climbing.

MATIC: Plan for Swing Trading at Ranging MarketHello Guys!
Today I would like to present to you my trade idea for POLYGON/MATIC.
As you can see, in 4H time frame here, MATIC has broken the trendline with a solid candle and is now testing the 50 EMA.
If you look at 1 day time frame, MATIC is currently at the range between 1-1.2 USD (approximately).
The 4H breakout confluences with the rejection from support/range low of 1 USD.
Now, as long as MATIC does not break the 1 USD support, or if there is a correction from here, the correction does not exceed the box I draw, we can expect MATIC to go to 1.2-1.25 USD range, which gives us a good trade opportunity.
Once MATIC reach the resistance/range high, we can see if there is any bearish signal there, to set up a short trade there back to 1 USD.
Good luck with the trading and remember that this is not a financial advice!
Trade at your own risk!
Hope you find my idea helpful

MATIC (Polygon) after 80% profit we enter short !#MATIC / USD Update:
$MATIC is currently trading at $1.059
According to Coinlion Trend Trader Indicator, MATIC is currently bearish. Short alert at $1.12 (4th of March)
Reminder last bull run from $0.85 (01/11/2023) till the $1.26 (02/25) with plenty of Profit alerts (60-80%)
Now we are shorted MATIC
There is a buying pressure between $0.94 and $1.01
And we are on a support (200EMA) at $1.04
We can reach the bottom of the ascending channel at $0.95 and take some profit
What do you think ?
Please click LIKE button and Appreciate my work.
Coinlion Trend Trader indicator tells me when to enter short or long, when to exit and when to take profit :-)
Thank you.

MATIC on Daily Chart Shows Bullish TrendThe MATIC trend on the daily chart is bullish and will surely seek its last maximum in the coming days


#MaticCurrently, in wave 2 of correction, the cycle is lower and therefore has less weight. But in the higher cycle, the floor is confirmed.
The corrective wave 2 of the higher cycle can correct up to 23% of the Fibo of the previous wave, which is the range of 1.0078.
Therefore, I expect that the bottom of wave 2 will be closed in these areas. The credit level was also announced in the previous post that the bottom of the previous wave is in the range of 94 cents.

MATIC/USDT 4HInterval Resistance and SupportHello everyone, let's look at the MATIC to USDT chart on a 4-hour timeframe. As you can see, the price is moving below the local downtrend line.
Let's start with the support line and as you can see the first support in the near future is $1.07, if the support is broken then the next support is $1.06 and $1.04.
Now let's go to the resistance line, as you can see first we have a resistance zone from $1.08 to $1.10, if we manage to break it, the second zone is from $1.11 to $1.12 and then resistance at $1.13.
Looking at the CHOP indicator, we see that there is a lot of energy for further movement, the MACD is on the verge of returning to a local downtrend, while the RSI is in the process of rebounding in a downtrend..


MATIC 4Hr IdeaIdea showing a higher low double bottom on Matic 4Hr chart
A bottom here would be strong for MATIC on many timeframes
Shown the bottom with the bars pattern

#MATICUSD - A Small Decline to Lower Bounds of TriangleAfter a test and rejection off upper bounds of a descending trend line we've received a Sell signal from Crypto Tipster v2.
There's a nice level at around a 20% drop from the current price which has previous shown as Support/Resistance.
This coincides with an ascending trend line nicely which is our target!
What Do You Think?
If you enjoyed or agree with this idea - drop us a comment, like & follow! 😀
Ideas by theCrypster meet the guidance notes and disclaimer as mentioned below and within our website. See Signature for more info! ✌️
🔥🔥🔥
Crypto Tipster v2
theCrypster
🔥🔥🔥

Unstake Your GMXGMX will fall to 60ish range, probably bounce between my rainbow myriad of lines, then go down :))) You should buy around 52 - 60 !

Polygon Is Becoming An EllipsePolygon is going to fall to the blue line, fire sale baby, should buy there. My guess is it'll occur with Shanghai. :)

🔥 MATIC Rising Wedge: Time For Bearish Break?MATIC has been trading inside this rising wedge for nearly a year now. Rising wedge are classically bearish, so the assumption is that we break out bearish in the future.
However, we can very well bounce from the current resistance. In case we get a decent reversal candle, I look at the top resistance as my initial target. In case we fall through the support and close below it, see blue lines as bearish targets.

MATIC (Polygon) Faces Resistance as Bears Take ControlMATIC (Polygon) is a cryptocurrency that has seen a -3.44% decrease in price over the past 24 hours. As of the time of this analysis, the current price of MATIC is $1.0945.
Looking at the daily timeframe, we can see that the price of MATIC is currently below the 0.5 Fibonacci level, which indicates a potential trend reversal. The 0 Fibonacci level sits at 1.2500, while the 1 Fibonacci level is at 0.9426, and the 1.618 Fibonacci level is at 0.7527. This suggests that if the current downward trend continues, the price could potentially fall to these levels of support.
The upper Bollinger band on the daily timeframe is at 1.2301, while the lower Bollinger band is at 1.0209, and the middle Bollinger band is at 1.1255. These bands can help us identify potential overbought or oversold levels in the market. Currently, the price is below the middle Bollinger band, indicating that the market is potentially oversold.
The RSI is currently at 44, which is close to the oversold region. This indicates that the price of MATIC could potentially rebound in the near future. However, the Stochastic oscillator is currently at 27, which is also in the oversold region, indicating that the downward trend could continue.
The MACD is currently at -0.0230, which suggests that the trend is bearish. Additionally, the Volume oscillator is currently at -20%, indicating a decrease in trading volume.
Looking at the hourly timeframe, the EMA 100 is at 1.1002, which could potentially act as a level of resistance if the price of MATIC starts to rise. The On-Balance Volume (OBV) is currently at 47.544B, which indicates that there has been a net outflow of funds from MATIC over the past 24 hours.
Overall, the price of MATIC has experienced a decrease over the past 24 hours, and the technical indicators suggest that the downward trend could potentially continue. However, there are also signs that the market may be oversold and that the price could rebound in the near future. Traders should monitor the key levels of support and resistance, as well as the volume and technical indicators, to make informed trading decisions.

$matic weekend long setupactually long matic here from the divergence at the bottom of the channel.
think markets range over the weekend. plenty of scalp opportunities.
planning to tp around $1.16 and assess from there.

#MATIC #LongMatic currency is completing a symmetric AB=CD pattern, which seems to be the end of the 2nd corrective wave and can complete the 3rd rising wave trend.
The level of invalidity of wave bottom analysis is one

MATIC As we can see, MATIC needs a bit of fall before going up in the Long Trading Volume.
All patterns show similarity, so the up trend is the case.
You may open a position but have to wait for a -10% to drop first.
If you set up the base line you will see that it has to drop a bit more, below the EMA to continue the first patters of Fib. Circles, but
it is a Long position.
Good luck!!

$matic short | $.75 targetshorted matic here. looks weak compared to other majors.
stop technically already moved to BE as we're in the middle of powell's conference.

MATIC Weekly View - March 2023Hello Guys, Weekly Analysis is on the MATICUSDT Symbol in a 1H Time frame, I Hope it Will be Useful for You, Don't Forget to Like, Follow, Comment

Phased investmentThe AidiFinance project is revolutionary in the world of cryptocurrency and is greatly underestimated. For a long time, the development team has been building an ecosystem aimed at rewarding holders from using software products. Holders already receive rewards in the form of Matic in the amount of 2% of the volume.
Development completed:
- AidiSwap is a multi-network exchanger operating on BSC, ETH, Polygon networks;
- AidiCraft - NFT marketplace, running on the Polygon network, provides integration into OpenSea and Raible, the built-in Lazyminting system. It will soon be available for use by other projects with their own coins;
- AidiBets - sports betting, cyber games, slot machines, poker, blackjack, roulette and much more;
- AidiRaffle is a platform for conducting lotteries and sweepstakes, which allows any projects to organize collections to raise funds for marketing and other purposes.
In the second quarter, developers will present:
- a platform for staking;
- AidiCard - virtual cards (VISA, MasterCard), with the possibility of payments in stablecoins anywhere in the world, No KYC.
In the near future, the team plans to create:
- AidiPlayFi platform for game developers, which will interact with the NFT marketplace AidiCraft;
- AidiConnect is an intelligent tracker for providing the ability to track your investments and predict profits.
The projected price is $1.5-$2 in the next 2 years.
Polygon contract: 0xDFc2C4ce66561c3ee53dbeA9ff78550F395a25e2
