💥☃️🌲Polygon Analyze (Road Map)!!!🗺️💥☃️🌲☃️💥💐🌲Merry Christmas 💥💐🌲☃️
Today, I want to show you the polygon road map🗺️.
Polygon is running on the main wave 4.
The structure of main wave 4 is a zigzag correction.
It seems that the polygon has started the microwave C of main wave 4.
I tried to show you the end of main wave 4 (zones) in my chart.
🔆Suggestion: If you want to add MATIC to your portfolio, you can wait for lower prices.
Polygon Analyze (MATICUSDT) Timeframe Weekly⏰ (Log Scale).
Do not forget to put Stop loss for your positions (For every position you want to open).
Please follow your strategy, this is just my idea, and I will be glad to see your ideas in this post.
Please do not forget the ✅' like '✅ button 🙏😊 & Share it with your friends; thanks, and Trade safe.
Matic

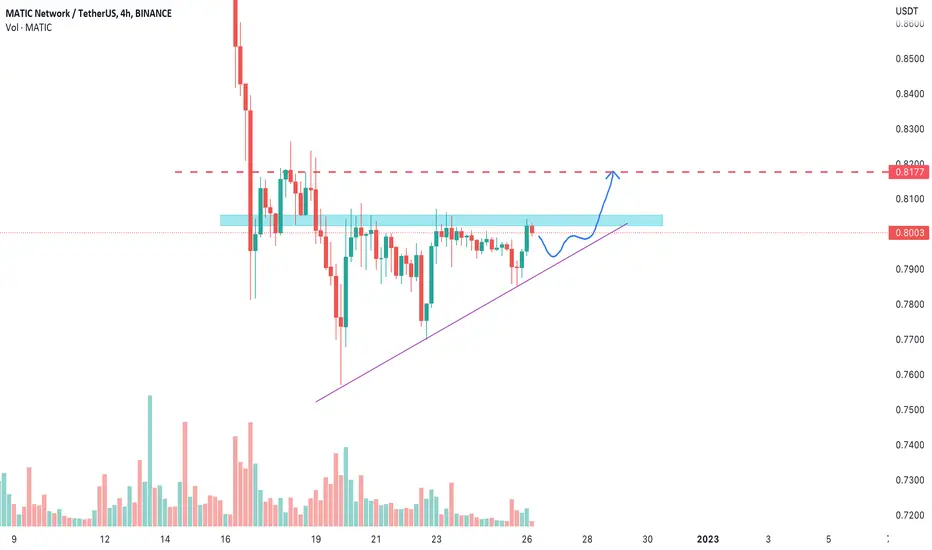
Long MATIC for mid-range and perhaps top of rangeIt's Friday, December 30, 2022 and MATIC reached for the range lows.
It took the downside liquidity and is looking to close above the range low.
As we head into the weekend, it's likely the creeps up towards the mid-range - especially because other major coins have also held their lows.

MATIC: Pullback in UptrendPolygon (MATIC) technical analysis:
Trade setup : Pullback near $0.75 support and 200-day moving average could be an attractive swing entry.
Trend : Downtrend on Short- and Medium-Term basis and Neutral on Long-Term basis.
Momentum is Bearish (MACD Line is below MACD Signal Line, and RSI is below 45).
Support and Resistance : Nearest Support Zone is $0.75, then $0.50. The nearest Resistance Zone is $1.00, then $1.30.

MATIC, Huge Broadening-Wedge to Setup Massive Pump Potential!Hello Community,
Only 2 days remain till the new year of 2023 emerges and the cryptocurrency market is showing important structures to watch out for during this time as there are many altcoins within the market building interesting setups these are conditions worthwhile to look at for traders and investors starting into the new year of 2023. As I analyzed the cryptocurrency market I found picked altcoins with pump potentials and amazing setups developing to unfold this potential. One of the altcoins is Matic and in this case, I am looking at the price structure and what should be considered looking forward to future trading sessions.
When looking at my chart now we can watch there how Matic is building several significant structures and the most stunning one is the main broadening wedge Matic is forming above the crucial ascending trend line serving as support. Within the broadening wedge formation, Matic has a coherent wave-count which is almost completed now with the waves A to D already finished, and now with the completion of the wave, E Matic is approaching this central support cluster marked in green in my chart where several supports are coming together concentrated into one point. This means once wave E has been finished Matic has an intensely high possibility to bounce within this support cluster zone.
Taking all these factors into the consideration now the determining developments will happen once Matic has finished the wave count and bounced within the support cluster with a high possibility and once this happened with Matic finally bouncing above the upper boundary of the broadening wedge formation it will be the setup of completion for the broadening wedge with Matic activating further continuations in the trading sessions and in this case the dynamic support zone marked in blue in my chart will be activated. Once these targets have been reached and Matic manages to increase volatility significantly there is still room for further continuation, it will be an interesting journey ahead.
In this manner, thank you everybody for watching. Let's move forward together.
The information provided is only educational and should not be used to take action in the markets.

Possible scenario for MATICMatic's behavior is dependent on Bitcoin analysis, but it is easy to see the $0.30 price for it, it is intended to analyze several important areas that the price can react to, but in my opinion, it has no effect on the final target.

MATIC - Continuation of the BreakdownApparently Polygon is spending so much money in incentives to keep developers in their blockchain.
Once they realize it's not worth it, nothing stops it from a collapse.
TA also looks bearish, so why not short it?. Hope the SL is able to hold, otherwise I'll reevaluate.
🔥IS SOLANA FUD THE BEST TIME TO BUY IT❓READ THE IDEA!🔥 Hi friends! Leading Solana-based NFT projects DeGods and y00ts reported migrating to other blockchains in the first quarter of 2023 - to Ethereum (ETH) and Polygon (MATIC) networks, respectively.
🚩 I'm sure that this an important news, but friends, how many % from total number of transactions inside Solana blockchain these NFT organizations provide? 0.5%, 0.1%? I'm sure that it doesn't have significant impact on the SOL blockchain.
In recent news, before the migration, the DeGods team made a request to the Solana Foundation for $5M to keep the project on its blockchain. According to them, this amount was paid by the Polygon partner fund in the form of a grant.
Personally for me, the biggest impact on all altcoins have Bitcoin growth or fall. I think that some huge manipulations are coming.
If the SOL price will make a pullback down and collects the sl below the key level of $10.94 (false breakout), the price will grow and reach the next targets.
✅ MY TARGETS FOR SOLANA:
🔥 $12.2-12.45 - the value area
🔥 $12.8 - the key level
🔥 $13.5-13.7 - the key level
The volume bars should grow during the false breakout which confirms that the bottom is already reached.
What are your possible targets for SOLANA ($5,$10,$20)? Write it in the comments!
💻Friends, press the "boost"🚀 button, write comments and share with your friends - it will be the best THANK YOU.
P.S. Personally, I open an entry if the price shows it according to my strategy.
Always do your analysis before making a trade.

🔥WHY YOUR ALTCOINS FALL FOR -8-10% TODAY❓HERE IS THE ANSWER🔥 Hi friends! Blockchain data shows that Alameda Research (SBF/FTX fund) swapping their altcoins for Bitcoin using mixers.
Today, addresses related to Alameda exchanged AAVE and LDO tokens for ETH. Then sent ETH to ChangeNOW and USDT to Fixedfloat and Binance via new wallets during the last 10 hours. Most likely, this activity caused the crypto market and alts fall: SOL, APT, which are in the fund's portfolio.
🚩 Alameda's wallets came into activity a few days after SBF bailed out. If your altcoins fall🔻 today, that means Alameda also have it on their balance and continues to sell it. Full altcoins list you can find at my pages.
Now ETH is inside the consolidation channel, but I think that the price of the #1 altcoin can go lower due to fud. Also, you can open a short of the price break the channel down with target to the closest value area.
If the false breakout of the key level of $1155 finally happen it will be the great chance to open a long with the 3 targets that I point out lower.
📊 TRADING PLAN FOR ETHEREUM:
1. false breakout (close below and return above) of $1155 key level
2. volume growth confirms the trap of retailers
3. bullish BTC
✅ MY TARGETS FOR ETHEREUM:
🔥 $1183 - the bottom of the channel
🔥 $1210-1223 - the closest value area and mid of channel
🔥 $1265-1276 - the top value area. It's a possible target if ETH break the channel
Traders, what do you think about ETH? Does it have a chance to beat BTC by its capitalization? Write in the comments if you know why it should happen.
💻Friends, press the "boost"🚀 button, write comments and share with your friends - it will be the best THANK YOU.
P.S. Personally, I open an entry if the price shows it according to my strategy.
Always do your analysis before making a trade.

Matic (Polygon) Gem EditionPolygon believes in Web3 for all. Polygon is a decentralised Ethereum scaling platform that enables developers to build scalable user-friendly dApps with low transaction fees without ever sacrificing on security.
#Instagram launches NFTs on Polygon
#arrow-rightStripe launches global payouts with crypto using Polygon
Sadly correction is needed!


#Polygon is bullish, but MATIC Has Support at $0.76Past Performance of Polygon
Like the rest of the markets, MATIC is in range, moving horizontally without a defined short-term trend. From a top-down preview, buyers have the upper charge if the H2 2022 price action leads. The immediate support line is around $0.76, while resistance is at $0.93 and $1, respectively.
#Polygon Technical Analysis
Presently, MATIC prices are in a tight consolidation. Although prices are below the middle BB, trending lower, there have been higher highs relative to the lower BB, with support at $0.76. MATIC is currently inside the bear bar of December 19, influenced by sellers of December 16, as a bear flag prints. Traders can stay neutral if prices are above $0.76 but below $0.83. A break out above December 19 bar may see MATIC float to $0.93 in a welcomed bullish formation. Conversely, losses below $0.76 could see MATIC fall to September lows of $0.70.
What to Expect from #MATIC?
MATIC is bullish at spot rates, but there must be a definitive close above $0.83 for prices to recover, ideally to November highs. However, if there are losses below $0.76, the coin could tumble to September lows as bears press on.
Resistance level to watch out for: $0.83
Support level to watch out for: $0.76
Disclaimer: Opinions expressed are not investment advice. Do your research.

Matic Elliott Wave ST Ideas, bear and bull.If you find this information inspiring/helpful, please consider a boost and follow! Any questions or comments, please leave a comment! Also, check out the links in my signature to get to know me better!
Seeing some nice patterns in the lower time frames so I will be using these levels and Elliott Wave to look for plays off of some of these areas of interest in the future if things clear up and continue to print technically. Cheers!

new analysisIt's really hard to explain this
but we have a slight downpour, and then about 1 month to 45 days the market is bullish , and the altcoin will grow between 100 and 1000%, currencies with high market caps like Ethereum 100% and currencies with low market caps up to 1000%,
and then we have a terrible fall that many currencies will be destroyed
if you like analysis with me. Join me and make a profit to message me or comment
I put 7 new analyzes I will let you see all the analysis to pay attention to the analysis dates and do not harm

Matic Elliott wave Short term outlookIf you find this information inspiring/helpful, please consider a boost and follow!
Any questions or comments, please leave a comment!
Also, check out the links in my signature to get to know me better!
Bear and bull ideas, had a video all done but it would not publish here on tradingview, not the first time this has happened. I was able to save it so its going to be cleaner after I edit anyway, these are the cliff notes for the video. So if you would like to see the video, it wont be here.
Anyway here are my ideas for MATIC.
Cheers!

Year-End Targets for Polygon(MATIC/USDT)! Will it Hit $1?Polygon price displayed immense strength since the start of December 2022, but the FUD related to Binance insolvency, the price of MATIC and various cryptos slashed hard in no time. Meanwhile, the price is attempting very hard to keep up a bullish trend and hence trading within a bullish ascending triangle . However, the token has faced constant rejections at the resistance and the recent drop substantiates the bearish grip at these levels. Therefore, the pice may continue to trade within the pattern until the end of 2022 and ignite a notable upswing in the first few days if 2022.
The MATIC price is expected to rise high and test the crucial resistance zone but may again face a rejection for one last time. The price may again reach the lower support and rebound which could bring the asset towards the pinnacle. Here, depending on the induced volume, the price may break above the ascending triangle to test the upper resistance at $0.819. Meanwhile the possibility of reaching beyond $1 appears to be pretty less at the moment but cannot be completely discarded.
With a slight change in the market sentiments, the price is believed to rise high and achieve $1 mark in the firs few days of 2023.
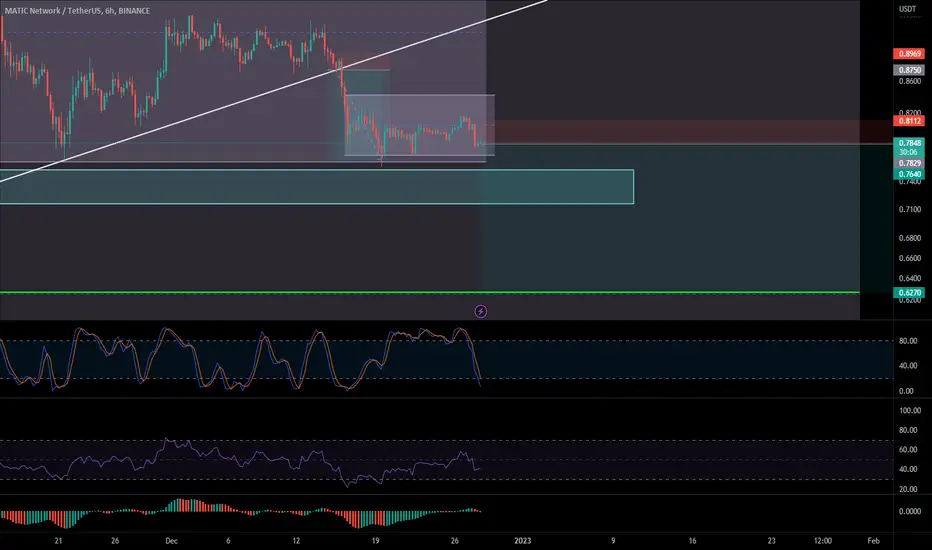
MATIC - Technical review and analysisDuring the last week, MATIC recorded a range trend on the support range of $0.75 to $0.78. The volume of transactions is low, and the lack of desire on the part of buyers has kept the price at this level. After the short-term uptrend line is broken and the price declines with a large slope, technically, MATIC can have a further price decline to the support range of $0.60 to $0.67. Therefore, if the current support breaks, the next target for sellers is lower support.
But if Bitcoin maintains its important support, and its range is broken from above, we can expect the formation of reversal patterns at the current support level for MATIC currency. In the 4-hour time frame, there are still no higher ceilings and floors, and we have not seen a consolidation above $0.80. But the resistance, the failure of which can be a sign of a change in the trend from downward to upward in 1-hour timeframe, is in the range of 0.825 to 0.830 dollars. So we can monitor these two ranges for the current week.


Trading opportunity in MATICUSDTBased on technical factors there is a Buy position in :
📊 MATICUSDT
🔵 Buy Now 0.7990
🧯 Stop loss 0.7510
🏹 Target 1 0.8855
🏹 Target 2 1.0700
🏹 Target 3 1.2855
💸RISK : 1%
We hope it is profitable for you ❤️
Please support our activity with your likes👍 and comments📝

MATIC on a Head and Shoulders trying to avoid disasterThe Matic Network (MATICUSD) recently established trading below its 1D MA200 (orange trend-line), closing a daily candle below it for the first time since October 20. This alone is far from ideal for buyers but the price remains within the wide 0.690 - 0.770 Support Zone that is holding since July 26.
However, we can't ignore the Head and Shoulders pattern since October 13 that has just been completed. If broken to the downside, this has the potential to drop as low as the 1.5 Fibonacci extension, which is at 0.380 with potential Support levels before that at 0.525 and 0.420.
Until the Green Zone breaks though, the price can potentially rebound back to the 1D MA50 (blue trend-line) and the 0.970 overhead Resistance. The 1D ADX indicator seems to be in agreement. A closing above the 0.5 Fib at 1.000, invalidates the Head and Shoulders pattern completely and recovers the price towards 1.300.
-------------------------------------------------------------------------------
** Please LIKE 👍, SUBSCRIBE ✅, SHARE 🙌 and COMMENT ✍ if you enjoy this idea! Also share your ideas and charts in the comments section below! This is best way to keep it relevant, support me, keep the content here free and allow the idea to reach as many people as possible. **
-------------------------------------------------------------------------------
You may also TELL ME 🙋♀️🙋♂️ in the comments section which symbol you want me to analyze next and on which time-frame. The one with the most posts will be published tomorrow! 👏🎁
-------------------------------------------------------------------------------
💸💸💸💸💸💸
👇 👇 👇 👇 👇 👇

MATIC: Pullback in UptrendPolygon (MATIC) technical analysis:
Trade setup : Pullback near $0.75 support and 200-day moving average could be an attractive swing entry in Uptrend.
Trend : Downtrend on Short-Term basis, Neutral on Medium-Term basis and Uptrend on Long-Term basis.
Momentum is Bearish (MACD Line is below MACD Signal Line, and RSI is below 45).
Support and Resistance : Nearest Support Zone is $0.75, then $0.50. The nearest Resistance Zone is $1.00, then $1.30.

MATIC quick trade and big investmenthey guys i hope you all are fine... KEEP ON EYE ( MATIC ) chart and i want to tell you good buying zone for spot trading and also one quick trade which is for future trading ....
For long term investment the good buy zone is ( 0.32 to 0.44 ) and i also mentioned this zone in my chart...
For quick trading zone is ( 0.7736 ) and you will take your profit when you want and when you think this profit is enough...
NOTE:
Do your own Research... Im not a financial advisor...

MATIC / USDT 1D chart ReviewHello, I invite you to review the MATIC chart on a one-day interval. let's start by marking the blue line, the downtrend line, which, as you can see, the price overcame. Since the end of August, we have been moving in a sideways trend channel, but we can also notice that we are locally below the downtrend line.
Now let's look at where the MATIC price has support, as you can see the first support is at $0.70, but if it goes lower we have another support at $0.52 and then $0.31 which is at the last low of the price.
Looking the other way, we can also check what resistance awaits the MATIC when the price starts to grow. And here we have the first support at the price of $ 0.93, when we manage to break it, the price will start moving towards the support from $ 1.32 to $ 1.63, only when we manage to break this zone and then positively test it, the way to further increases will open .
It is worth looking at the moving averages, where we can see that the white line, blue line and red line have crossed the yellow line from below, which heralds increases, however, currently the white line is getting closer to crossing the yellow line from above, if this happens, then blue and red will follow the white one, we can continue the downward trend.
Looking further, the CHOP index indicates that most of the energy has been used, the MACD indicates a local downward trend, while the RSI has decreased, but there is still room for a deeper correction.

Liverpool x MATICshocker here, as soon as Liverpool sign a partnership with MATIC, the crypto suffers and 80% drop in asset value. that's what happens when you partner with a broken company owned by LeBron.
