Polygon (MATIC) UpdateLooking at the MATICUSDT chart ( BINANCE:MATICUSDT ), it seems like the price might be getting ready for a breakout! Over the past few days, the price has been consolidating within a neutral channel, which could be a sign of potential built-up energy. If this happens, the price could break through the resistance line (the upper boundary of the channel) and head towards the higher levels within the upward price channel.
In simpler terms: MATIC's price has been holding steady recently, but it might be ready to make a move soon. There's a chance it could break out and climb higher!
Note: this is not financial advice, and it's always a good idea to do your own research before making any investment decisions.
Matic


#MATIC/USDT#MATIC
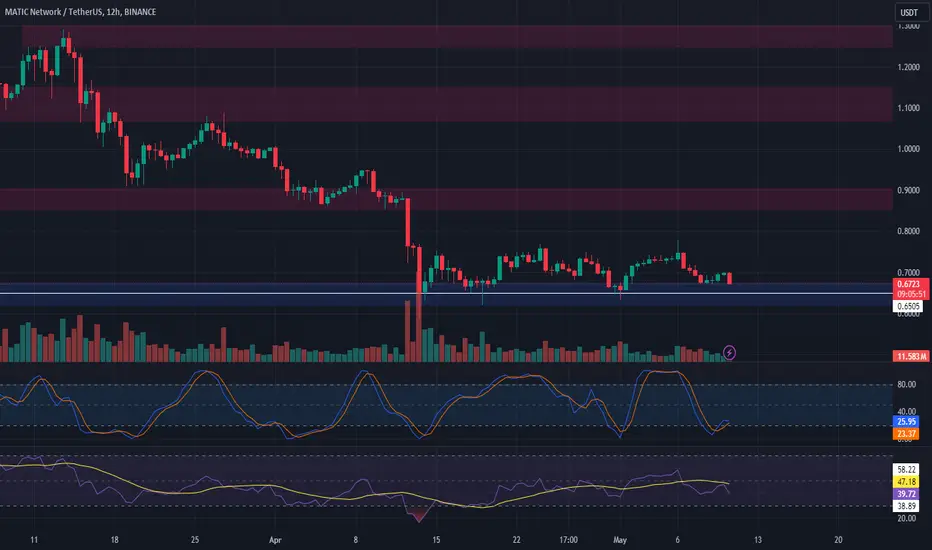
The price is moving in a head and shoulders pattern on the 4-hour frame and sticking to it well
We are now at the end of the formation of the right shoulder, and a rebound to the upside is expected
We have a tendency to stabilize above the Moving Average 100
We are oversold on the RSI indicator and we have a downtrend that is expected to break higher to support the rise
Entry price is 0.7300
The first goal is 0.800
The second goal is 0.860
The third goal is 0.9270

🔥 MATIC Massive Triangle: Accumulation Before Break OutMATIC has been trading inside this massive triangle for over 2 years at this point. Chances are that it will take another year before MATIC will finally break out of this pattern.
In my view, this triangle is a huge accumulation area where traders are loading in their bags in preparation for the next leg up.
This can really fly once we break out. Time will tell. Patience is key.

MATICUSD - Gaussian Channel Indicator ShiftA shift from the bearish red channel to the green bullish state is seen on this Weekly timeframe
Expecting incredible results from MATIC/Polygon.
Observational post.
Very bullish.

waiting for the prince MATIC to arrive,that's where the work Matic has so many significant support levels on the daily chart that one cannot ignore them. The areas I have identified are crucial Fibonacci points. On the daily chart, one must wait for Matic's prince to react in those areas.

182% with leverage x2 on MATICEntry from current levels, I also take leverage x2 for myself.
TP - $1.29
SL - $0.5
Achieving goals in 2 to 6 weeks.
This is not financial advice. Whatever you do, you do at your own risk!

MATIC - Clean and Clear ❗️Hello TradingView Family / Fellow Traders,
On Weekly: Left Chart
MATIC has been hovering within a big range in the shape of a flat rising channel marked in blue.
Currently, MATIC is approaching the lower bound of the range, so we will be looking for buy setups on lower timeframes.
On Daily: Right Chart
📈 For the bulls to take over, we need a momentum candle close below above the last major high highlighted in gray.
📉 Meanwhile, MATIC would be bearish short-term and can still trade lower inside the weekly support.
📚 Always follow your trading plan regarding entry, risk management, and trade management.
Good luck!
All Strategies Are Good; If Managed Properly!
~Richard Nasr

MATIC/USDT 4H Chart ReviewHello everyone, let's look at the 4H MATIC to USDT chart as we can see that the price is staying on a lopsided uptrend line.
Let's start by setting goals for the near future that we can include:
T1 = $0.73
T2 = $0.76
T3 = $0.79
AND
T4 = $0.82
Now let's move on to the stop-loss in case of further market declines:
SL1 = $0.67
SL2 = $0.64
AND
SL3 = $0.56
When we look at the RSI and STOCH indicators, we can see that the indicators are low and we additionally rely on the trend line, which may affect the price maintenance.

📈🔍 MATIC Long Trade Analysis 🔄💼Trade Overview:
MATIC has shown strong support around the $0.67 level for almost a month, making it an opportune level for entering a long spot trade.
Trade Setup:
Entry: Enter into a long spot trade at the $0.67 level of support.
Take Profit: Aim for profit targets at $0.85 - $0.90 and the next resistance area at $1.07 - $1.15.
Stop Loss: Set the stop loss just below $0.65 to manage risk effectively.
📊🛡️ Exercise caution and closely monitor MATIC's price movement for trade management! #MATICTrading #CryptoAnalysis 📉🚀
MATIC ANALYSIS (2H)MATIC seems to have formed a diametric from the bottom on the hourly time frame.
It now appears to be in the middle of wave E.
In the supply range, you can look for sell/short positions (scalpi).
Closing a 4-hour candle above the invalidation level will violate the analysis
For risk management, please don't forget stop loss and capital management
Comment if you have any questions
Thank You

Polygon Matic price is at the bottom of global consolidationDuring the recent correction of the crypto market, the price of #MATICUSDT fell quite a bit, as for an altcoin from the top 20
However, the aggressive buyback of CRYPTOCAP:MATIC started from the critical zone, and this is good. Perhaps it was around $0.60 that big money was ready to buy.
Whether this is true or not, we will soon find out, because if the price of the #Polygon token is to start its upward trend, it should not more allowed to fall below $0.60
_____________________
Did you like our analysis? Leave a comment, like, and follow to get more

Polygon MATIC Intraday Trade SetupThe chart highlights breakout/rejection points, criteria, and targets to execute on the trade opportunity.

Matic USDTMATIC Setup. After a confirmed breakout from the marked zone in green, we could take an entry at 0.7924. Remember stop loss is your friend. Everything is on the chart.
Entry 0.7924
S.L 0.7092
T.P 1 0.8598
T.P 2 0.9483
T.P 3 1.0664
T.P 4 1.1854

MATIC could be ETH cycle 1MATIC could be ETH cycle 1, so far Matic is far from done. The chart clearly shows us the market maker movement in accumulation phase and about to take off.
Good for long-term investment asset layer 1 coin.

📈MATIC Analysis: Waiting for Box Breakout in 4-Hour Timeframe🚀🔍Today's market saw a notable rebound from a crucial support level, reaffirming the buying opportunity for investors keen on sustaining prices above this support. As emphasized in previous analyses, the breach of this support and subsequent consolidation below it would likely signal a bearish trend, making position opening challenging until proximity to this support.
⚡️Currently, Bitcoin has undergone a minor upward correction, with altcoins also nearing the upper bounds of their respective boxes. The coin under scrutiny today is Matic (MATIC), with analysis focused on the 4-hour timeframe. Matic is currently confined within a box ranging from 0.6449 to 0.7491.
🔔Utilizing the volume fixed range profile indicator reveals balanced volumes within the box, suggesting a prudent approach of waiting for a breakout before considering positions. Therefore, the entry point for a long position is at 0.7491, while for a short position, it's at 0.6449.
📈For long positions, consider targeting the area around 0.8685, a strong supply zone where price rejection may occur. Conversely, for short positions, 0.5057 serves as a suitable target, offering robust support and aligning with the 1 Fibonacci extension.
✅However, the optimal exit strategy entails waiting for a trend reversal before exiting the position. This advanced approach necessitates a deep understanding of market dynamics and significant trading experience.
📊Additionally, dwindling volumes indicate waning trader interest within this range. When traders, especially those with significant trading volumes, are disinterested, it's prudent for others to refrain from trading.
💎For RSI confirmation, breaking above 64.27 could serve as a signal for long positions. However, given the market's lack of momentum, reliance solely on momentum indicators like RSI may not be advisable.
📝In conclusion, exercising patience for a breakout from the current box range is prudent for Matic traders, with strategic entry and exit points crucial for successful trading amid prevailing market conditions.

MATICUSD 1WMATIC ~ 1W
#MATIC The movement of CRYPTOCAP:MATIC is increasingly limited in this pattern. It looks like Whales still maintain Support in this pattern.
We are still long-term bullish on #MaticUSD as long as price still maintains this support.

MATIC: RARE Pattern ! Three Drive spotted 📉📉 MATIC - USDT 📈
The three-drive is a rare price pattern formed by three consecutive symmetrical moves (or drives) up or down. In its bullish form, the market is making three final drives to a bottom before an uptrend forms. In a bearish three-drive, it is peaking before the bears take over. this means that we SHOULD bottom soon, at least. And the next landing zone could be a good accumulation point.
At first glance, it may appear bullish - since the price is now consolidating under a "resistance zone", which is normally a bullish indicator when the price is INCREASING, but not when the price is decreasing.
This is infact not consolidation under a resistance zone, but should be seen instead as another failed bounce on a key support zone.
The immediate price we can expect to see in the short term is 0.59c, however this zone was already tested with a wick - meaning it will be weaker when we head there for a second test.
Although it's a great alt to have as a part of your diversified portfolio; I've been bearish on Matic for a while, with my previous update also cautioning sell for short term:
_______________________
📢Follow us here on TradingView for daily updates📢
👍Hit like & Follow 👍
CryptoCheck
BINANCE:MATICUSDT

Polygon $MATIC overview#Matic price is in long period falling channel. #polygon tested the top of channel but declined hard and bearish continuation occured after bear patterns. Now price may have a relief rally by hitting the orange box but i say MAY BE.
In mid term (several months) period, #MATICUSD price expected to visit 1/2 #usd zone or channel low. Not financial advice.

MATIC Road Map(1-Hour)🗺️!!!BINANCE:MATICUSDT
Observation: We are retesting the current major resistance and the point of interest, expecting to see a pullback to the upside to it and then we see a rejection.
Falling wedge pattern is bearish, we can break below of it. But it could be either for a continuation to the downside or a fake-out then we break from above of the resistance.

Will MATIC move towards $1.6Altcoins with small capitalization (young/new) have already made huge increases in the bull market, and what about altcoins with larger capitalization? The boom doesn't apply to them? I present to you possible growth scenarios with potential key places for continued growth. The first scenario assumes increases after repeating the 1:1 black correction, i.e. wave 2 as wave 4. The condition is that the price will rise above 1.54usdt. The second scenario is a flat ABC correction, where the condition is that the price increases to the red zone without breaking the top of wave 1 and falls to the green zone as wave C, ending the correction, after which I assume increases. Regards.

MaticusdtMatic usdt is ready to turn and will target 2.4 $ mark, once that's taken out, it will target a new all time high.
Entry - 0.72
SL - 0.41$
Target 1 - 1.9$
Target - 2 - 2.4$
Target - 3 - 3$

I Think MATICUSDT Will Breakout SoonA large triangle can be obtained using previous highs.
MATIC is testing the trend line for the third significant time.
I think this trend line will be broken and MATIC will break out upwards
I'm very bullish
I think of MATICs chart as ETHs was in its early days
