Alikze »» KAVA | The trigger pullback is brokenIn time W1, after exiting the density and pulling back to the dynamic trigger, it will now have the ability to grow up to the red box area, and if it fails, it will succeed in continuing the upward path to the specified goals.
»»»«««»»»«««»»»«««
Please support this idea with a LIKE and COMMENT if you find it useful and Click "Follow" on our profile if you'd like these trade ideas delivered straight to your email in the future.
Thanks for your continued support.
Sincerely.❤️
Matic

MATIC: Major Lawsuits and the Long-Term TrendPrimary Chart: Monthly chart of MATIC (Polygon) with Monthly Four-Year Uptrend
Fundamental Issues Arising from Recent SEC Legal Actions
Significant fundamental concerns have been brewing relating to Polygon / MATIC. The United States Securities and Exchange Commission (SEC), is the primary securities regulator in the US that handles securities registration, enforcement, and efficiency of capital markets. The SEC has recently named 13 securities that it alleges to be unregistered securities including the subject altcoin. This came as part of this agency's enforcement action (lawsuits) against Binance Holdings Limited, Changpeng Zhao, et al., as well as its action against Coinbase, Inc and Coinbase Global, Inc., essentially the Coinbase exchange.
The SEC alleges defendants' "blatant disregard of federal securities laws and the investor and market protections these laws provide." Section 5 of the Exchange Act requires entities meeting the definition of exchange to register with the SEC as a national securities exchange under the Exchange Act unless exempted. Similarly, broker-dealers are required to register with the SEC under the Exchange Act as well, 11 U.S.C. § 78o(a)(a) (typically, broker dealers are defined as persons engaged in the business of effecting transactions in securities on the account of others).
And offering and selling unregistered securities is also a major violation of the securities laws that carries severe legal consequences. Coinbase Inc., for example, is alleged to have never registered with the SEC as a broker, national securities exchange, or clearing agency. Accordingly, the SEC argues that Coinbase has unlawfully "evaded the disclosure regime" that federal law provides for securities markets.
All these legal actions depend on on a pivotal concept: whether the crypto assets involved are securities. Broker-dealers by definition effect transactions in securities , so determining whether crypto assets are securities is a vital prerequisite to determining whether the defendants unlawfully effected transactions in securities on the account of others. Similarly, the registration requirement for exchanges depends on entities meeting the definition of exchange, which requires that the exchange constitute, maintain or provide a market for buyers / sellers of securities . If none of the crypto assets are deemed securities, then much (if not all) of the enforcement action would fail. Conversely if any one of the crypto assets is deemed a security, then the enforcement action would succeed at least in part.
Further, if the altcoins are legally held to be unregistered securities, then the exchanges may have unlawfully failed to register as exchanges, which registration comes with heavy disclosure requirements, and defendants may be liable for engaging in multiple unregistered offers and sales of crypto assets deemed as securities as well as other illegal schemes.
Further panic has been arising from derivative effects of these actions. To illustrate, reports have also circulated that Robinhood, a widely used trading platform for retail, has been "delisting" (dropping from its platform) major crypto tokens, although SquishTrade will recommend readers research this issue further for confirmation. Even if such reports were not correct, they instill panic, and their effects plainly follow from the legal actions.
This discussion of fundamentals are presented solely for context . This post will not delve into further detail about the litigation nor will it discuss whether the legal actions are well grounded in fact or law. No speculation will be raised as to the probable legal outcome or ramifications of a particular adverse judgment against any crypto exchange defendant.
Instead, the focus will remain on price, which is the best and most efficient processor of all fundamental information available. It's not always efficient and timely, but it is likely faster processor of all fundamental information than the best research team on the planet.
Technical Analysis Focused on Longer-Term Trends
Polygon (MATIC) has fallen over -32% in the past 10 days since June 1, 2023. Since the swing high in February 2023, MATIC has plummeted approximately –67.55%. The recent sharp downdraft in various altcoins may appear formidable, p and befuddling especially to those focused on intraday or even daily time frames, i.e., trends of much smaller degree than the ones shown here. Further, with leverage or oversized positions, a position traders may be stunned and unable to manage their positions. This would be true even for an experienced trader who had the foresight and discipline to buy the December 2022 lows ($.75) who may still be significantly underwater at this point if profits were not taken in a strategic or programmatic way.
However, longer-term investors / position traders in this Ethereum-based Polygon network may do well to zoom out somewhat given the news. Doing so, they might discover that the very long-term trend remains higher in Polygon. Consider the 4-year uptrend line on the Primary Chart above. It hasn't been touched since November 2020.
Furthermore, the long-term Fibonacci retracement levels (logarithmic only) show that even the shallowest of the widely followed levels has held as support since the peak in December 2021. The shallowest retracement level, Fibonacci .236 proportion, is shown below in Supplementary Chart A at $.53.
Supplementary Chart A
The next shallowest level is the Fibonacci .382 retracement (again on the highest degree of trend available here), which falls at $.19, also shown in magenta on Supplementary Chart A above and Supplementary Chart B below.
Supplementary Chart B
Of course, uptrends frequently retrace to .50 and .618 retracements as well. This could take MATIC to significantly lower levels shown in gold and green lines on the Primary Chart above.
But discussing such distant Fibonacci support levels under .085 might be getting a bit ahead of where price action trades now. As shown on the Primary Chart, the uptrend line for 4 years has not been tagged since November 2021. This is not to say that it won't be. SEC enforcement actions are not to be taken lightly by investors or the defendants.
A couple more long-term technical levels that are more dynamic should be mentioned. Supplementary Chart C shows an both an anchored VWAP from the all-time high and an all-time low (based on available data for Matic Network / TetherUS). Notice how the major low of 2022 tagged the anchored VWAP from April 2019 where the data begins on the chart. And MATIC's price found resistance at the VWAP anchored to the all-time high repeatedly, with one false break above it, confirming this level as strong resistance. So a trend-based analysis based on volume-weighted average price tells us that price remains in sideways consolidation within a very long-term uptrend—at least until price breaks and holds below the VWAP from the all-time low .
Supplementary Chart C
No one knows what will happen if price arrives at this uptrend line, but many trend-based traders and investors look for risk-defined entries at very long-term trendline support, with tight risk at / near the line itself to play for a sizeable bounce at a minimum or even a resumption of the larger-degree trend higher. But if the trendline is invalidated, the risk will have been kept small. Managing risk is vital since no one can say with certainty whether a trend will resume or whether it will resume at the trendline where it resumed after past countertrend moves. The same can be said for the key Fibonacci levels, each one providing a trend-based investor or analyst with another pivot to watch for support where a countertrend retracement may end and the shorter term trends realign with the longer-term trend.
Does this longer-term trend provide absolute reassurance, a guarantee of sorts, that many nervous crypto investors want concerning whether this long-term trend will remain intact? No. In fact, no such guarantees exist in financial markets—this holds true regardless of whether one is bullish, bearish or non-directional / neutral.
The aphorism in trading and investing is to make the trend your friend until the end, when it bends. Even long-term trends break, adjust, change, or reverse. To illustrate, consider that the upward trendline shown on the primary chart (monthly) could be broken and reconstituted if monetary policy continues to remain tight (or even to whipsaw as some argue). This may not mean a trend reversal on this very high degree of trend, it may just mean that the trend continues albeit at a less steep slope. Trends with steeper slopes have a tendency to be broken more easily than trends with less steep slopes (in downtrends or uptrends). This may be a result in part of the mean-reverting nature of price action on all time frames, from the shortest to the longest.
In technical analysis, trend continuation should be favored over trend reversal. Further, when bullish trend-based supports are reached, no one ever feels that good about going long because the news has been awful to get price down to that level. And here, the term "trend" refers to the 4-year trend shown on the Primary Chart, which may be deemed an extended primary trend (which typically fall between 6 months and two years but can extend longer) or even a secular trend given its duration. In short, if a countertrend move is occurring, traders and investors should consider it more likely for the trend to continue than for it to reverse on this time frame and degree of trend.
This is not a recommendation to buy or sell MATIC. Instead, this is an attempt at an objective conversation about longer-term trends in this altcoin in light of recent regulatory lawsuits involving whether it may be an unregistered security as held on most exchanges. SquishTrade at the time of writing holds no position in MATIC or any MATIC derivative.
________________________________________
Author's Comment: Thank you for reviewing this post and considering its charts and analysis. The author welcomes comments, discussion and debate (respectfully presented) in the comment section. Shared charts are especially helpful to support any opposing or alternative view. This article is intended to present an unbiased, technical view of the security or tradable risk asset discussed.
Please note further that this technical-analysis viewpoint is short-term in nature. This is not a trade recommendation but a technical-analysis overview and commentary with levels to watch for the near term. This technical-analysis viewpoint could change at a moment's notice should price move beyond a level of invalidation. Further, proper risk-management techniques are vital to trading success. And countertrend or mean-reversion trading, e.g., trading a rally in a bear market, is lower probability and is tricky and challenging even for the most experienced traders.
DISCLAIMER: This post contains commentary published solely for educational and informational purposes. This post's content (and any content available through links in this post) and its views do not constitute financial advice or an investment or trading recommendation, and they do not account for readers' personal financial circumstances, or their investing or trading objectives, time frame, and risk tolerance. Readers should perform their own due diligence, and consult a qualified financial adviser or other investment / financial professional before entering any trade, investment or other transaction.

MATICUSDT to the Moon
The analysis indicates that MATIC/USDT is poised for a significant bullish rally. On the daily timeframe, a crucial buying area is identified between $0.90 to $0.93. This range signifies a zone where substantial buying interest has historically emerged, potentially acting as a strong support level for the cryptocurrency. Additionally, on the 4-hour timeframe, a new fresh order block is noted between $0.95 to $0.97. This block is significant as it represents an area where substantial buying orders are likely to be present, reinforcing the bullish momentum.
Two target prices have been set, suggesting potential profit-taking levels for traders. The total gain expected from these targets is projected to be 40%, indicating a considerable upside potential in the price of MATIC. Setting clear targets is essential for traders to capitalize on price movements effectively.
Furthermore, risk management is emphasized as a crucial aspect of trading. Managing risk involves measures such as setting stop-loss orders to limit potential losses, controlling position sizes, and diversifying portfolios. By prioritizing risk management, traders aim to protect their capital and minimize potential downsides, ensuring long-term sustainability in trading endeavors.
In summary, the analysis suggests a favorable setup for a bullish rally in MATIC/USDT, with identified buying areas and profit targets. However, traders are reminded to manage their risk diligently to navigate market uncertainties and safeguard their investments effectively.

MATIC ABOUT TO PUMP 200% FROM HEREMATIC is currently breaking out of a 3-year descending triangle pattern reversal, which is bullish sign of continued upward movement.
2,80 could be the target for long term which is just under the ATH.

Completion of 2-year consolidation Polygon MATIC price is near!The MATICUSDT price now is in the liquidity zone, where it will be decided whether it is a winner or a loser.
In order to grow further, it is necessary to shake out "extra passengers" from long positions. In other words, a breakout of the Matic price below $0.73 should activate stop orders.
In such a trading situation, keeping a pending limit order in the range of $0.60-0.63 might be a good idea.
On the other hand, a similar trading pattern was already seen in the second half of 2022. Back then, "buyers" didn't let everyone who want to buy below the liquid zone, but pushed the MATICUSD price up from "the base" to update local highs.
What will happen this time? Write your thoughts in the comments.

LONG $MATIC: DAILY and a possible WXY formation ended/ingLONG BINANCE:MATICUSDT.P
My take is that MATIC has been forming and may now have ended (else is close to ending) a complex triple three (3-3-3) WXY correction.
Said correction is, as per Elliott Wave theory, comprised of a combinations of corrective patterns.
I spot three ossible ABC´s within the WXY-
Target area for Y wave has been hit at $0.7713 , and may still go a little further towards $0.6704, but needs not to as we have a full pattern.
Said development would align with the expected ending of Bitcoin´s own correction which "could" finish some place between $37.800 and $35.460 (bearish view) or could have bottomed in this last swing low at $38.540 (I find it less likely but yet possible).
In a word:
LONG MATIC from here up until at least $0.9345 and then... we shall see ;).

polygon MaticScalable blockchain.
A great project to follow.
After the sidways, the matic will go to moon. n no t ciming back

🔥MEME Copy APT Before +300% Pump: Will It Happen Again❓🔥 MEME is a fresh altcoin on Binance and very popular Twitter account with 2.3M of followers. This is a very huge community which will pump the price after its pullback.
MEME can make a pullback by -60-70% and it should be a signal for you to pay the attention to this memecoin. Previously, Aptos, Worldcoin, Pepe, Shib (fresh altcouns) was pumped after such pullback by 100-400%.
💥 Altcoin with such audience and popularity as MEME will be a top gainer at a euphoria phase of a bull market.
like❤️ and follow

🔥ENJ Is Going To Break Channel: Targets are +140-300% Above❗️🔥Enjin Coin is trying to break the 500-days channel. I expect the massive breakout.
Now the price aproach the top of the channel and try to break it. If it happen, it will be a good bullish sign to add some ENJ on channel test as support (mark with arrow).
💥The 2 main mid-term targets are on chart. The altseason is going!
like❤️ and follow

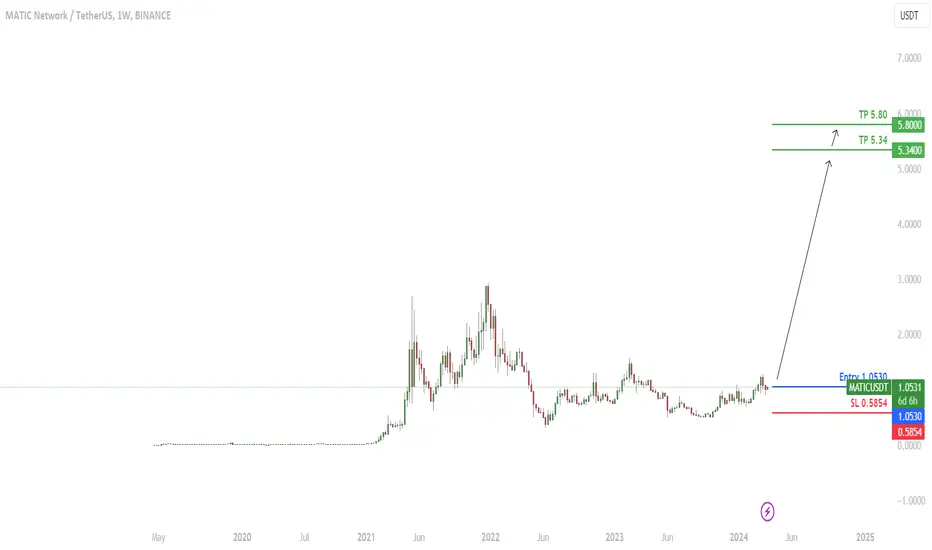
MATIC is at good time to buy and holdMATIC is at good time to buy and hold
🔵Entry Zone 1.0530
🔴SL 0.5854
🟢TP1 5.34
🟢TP2 5.80
Risk Warning
Trading Forex, CFDs, Crypto, Futures, and Stocks involve a risk of loss. Please consider carefully if such trading is appropriate for you. Past performance is not indicative of future results.
If you liked our ideas, please support us with your likes 👍 and comments.
Cryptolean Polygon MATIC UpdatePolygon MATIC declined into the daily range zone between $0.89 and $1.01 where we will continue to observe a slow and choppy price action.
A bullish break-out of $1.01 will result in a move to re-test $1.14-$1.20.
A bearish rejection of $1.01 will push MATIC price in the key daily support at $0.89.
And, a bearish break-out of $0.89 and a sustained price action below this support will make bears active towards $0.75.

MATIC waiting for buy signalI am not burying the world of altcoins yet. A buy signal is expected at the bottom of the trend. We have to wait and then there is a good chance of growth.

MATIC Polygon Potential Retracement SoonIf you haven`t bought MATIC before the rally:
Then using the Fibonacci Retracement tool, I believe there will be a new buy opportunity in the $0.92- $0.98 range!

$MATIC BULL RUN ROADMAP Toward $15CRYPTOCAP:MATIC BULL RUN ROADMAP
1⃣ #MATIC Forming Bullish Pennant In HTF
2⃣ 2021 Bull Run: Did 100x in Last bull Market After Bull Flag Breakout
3⃣ If MATIC/USDT Break $1.20 Level in HTF then Ready for $10-$15 Target
4⃣ I am Bullish in #POLYGON for Long Run
5⃣ If Market Crash then Best Accumulation Zone will be $0.60-$0.70


MATIC Liquidation HeatmapMATIC
short Liquidation
1.1794
1.3068
if there short squeeze
there is 2 price

MATICUSDT to hit weekly support zone before bounceThe price was rejected from monthly resistance MR1 and currently it is trading between monthly resistance MR1 and weekly support WS1. The price had reached MR1 zone after trading for a longer period around WS1 zone. I believe, the likelihood of the price hitting this weekly support zone WS1 is high. This will allow the price to bounce again from that zone. This bounce may allow the price to aim for the MR1 zone again.

#MATIC/USDT#MATIC
The price recently reached the first target of 0.8400, which is a moving average of 100 on
a 3-day frame
It achieved approximately 70% rise
After the descending triangle and the downtrend were broken, which opened the way for the rise
Supported by saturation on MACD
It is expected that a slight correction will occur before the rise to the second target at 1.1400 continues
Then the second target is 1.4446
This represents 300% since the downward trend was broken

Matic is getting ready to new ATHHello SSE community
As you can see #MATIC in it's USDT pair is getting ready to retest the long-term dynamic support and if it holds that gonna be good entry point into matic for bull-run
Good points as entry trigger : 0.90 , 0.86
Enjoy and lucky with your investment

short MATICMATIC broke through the support level and the ascending trendline. Decline to support level at $0.91 is expected to happen.

Cryptolean Chainlink MATIC Update Polygon MATIC declined sharply to $1.01, the key daily support.
A bullish reversal from $1.01 is likely and will result in a bullish move to re-test $1.07 and the key daily resistance zone of $1.14-$1.20.
A bearish break-out of $1.01 will push #MATIC price in the daily range zone and will increase probability of a deeper correction towards the next support at $0.89.
Intraday Chart
The MATICUSDT 4-Hour chart is bearish and teasing the resistance at $1.07.
A bearish rejection of $1.07 will lead to $1.01 and lower to the key support zone of $0.86-$0.92, where I will be closely watching the MATIC price action, as the bullish rejection of this zone is possible.
A bullish break-out of $1.07 will lead to a re-test of $1.13 and, possibly, $1.19, however the price action may be slow and choppy.
Support once read!
Thank you.

MATIC - TIME FOR EXHAUST?The asset broke out of the symmetrical triangle pattern.
Sticking with established patterns, the initial liquidation target is forecast at 1.5642.
The identified strong support zone is between 1.1 and 0.96.
In the immediate area, the nearest resistance zone extends from 1.35 to 1.5.
A potential struggle is expected in this range, which is likely to lead to subsequent liquidation (x), followed by a local correction.
The prospects seem promising; let's remain optimistic.

