Polygon Matic price will try to work out a medium-term tradeMatic buyers are not giving up and are trying to break through the local trend and strong liquidity zone from above.
We assume that there will be more attempts to push the price up, so this medium-term trade has the right to live:
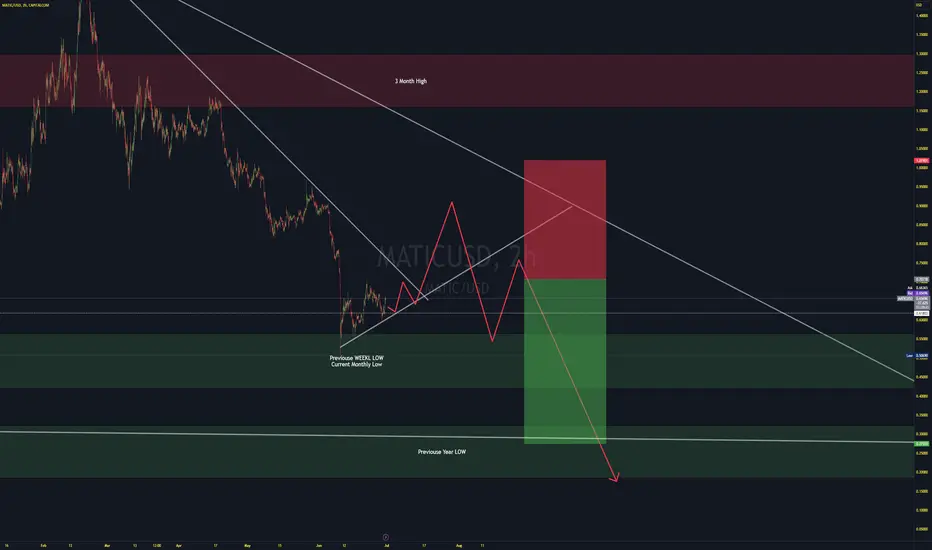
Entry = $0.636
Stop = $0.5582 (-12%)
Take Profit = $0.9595 (+50%)
Potential profit/loss ratio = 12/1
_____________________
Did you like our analysis? Leave a comment, like, and follow to get more
Maticusd

MATIC - 1-Week Horizon ☁️; Downside RiskAlthough the global crypto market enjoys ☀️ sunny trading conditions with a few ☁️ scattered clouds in the next 24 hours, as predicted by ATTMO, some altcoins like MATIC may encounter more ☁️ clouds over the one-week horizon, implying a downside risk.
Follow us for more crypto weather reports!

MATICUSD ❕ trend lineMATIC chart started to work out the convergence formed on the 4H TF.
The price is testing 200EMA as support (1H TF).
If the asset holds the support level, the chart will continue to grow.


Matic has a very good Potential Investment Hi Everyone;
today we have one of the best risk to reward Investment opportunity
it is more than 166 times the risk and the chart is look very promising.
I expect breaking the previous bear market key point will clear the way to the final target

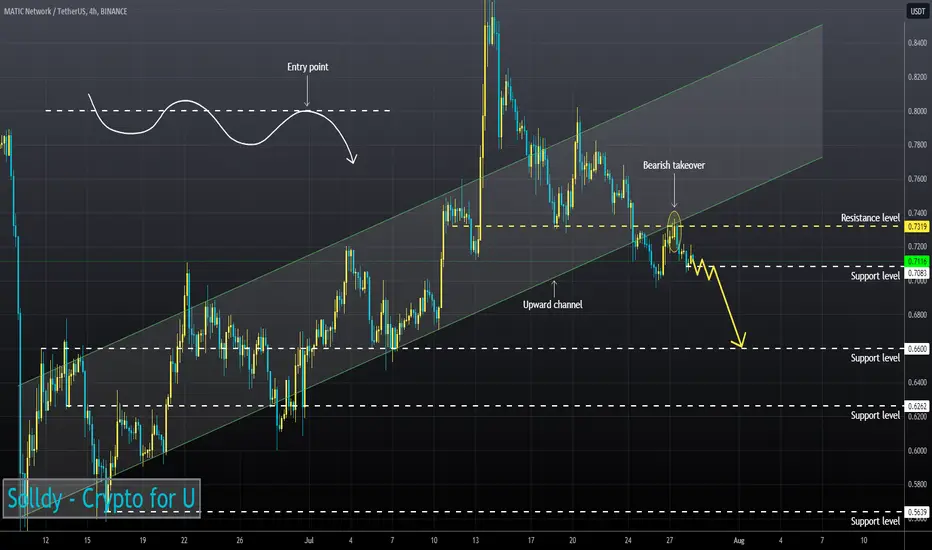
MATICUSD ❕ fixed under the channelOn 4H, price formed a bearish takeover and fixed under the upward channel.
RSI is moving in the sellers zone (4H and 1H TFs)
I think that the asset will continue to decline after fixing under the support level.
MATIC LOOKS BULLISH (2H)Hi, dear traders. how are you ? Today we have a viewpoint to BUY/LONG the MATIC symbol.
For risk management, please don't forget stop loss and capital management
When we reach the first target, save some profit and then change the stop to entry
Comment if you have any questions
Thank You

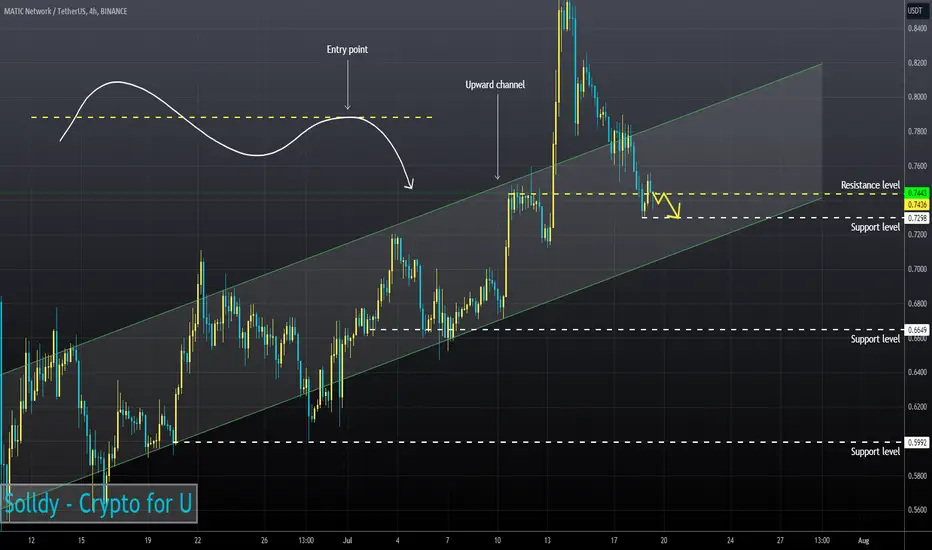
MATICUSD ❕ trading in the channelMATIC is moving from the upper boundary of the channel.
Buyers have weakened, as indicated by the indicators.
I think that the price will continue to decline.
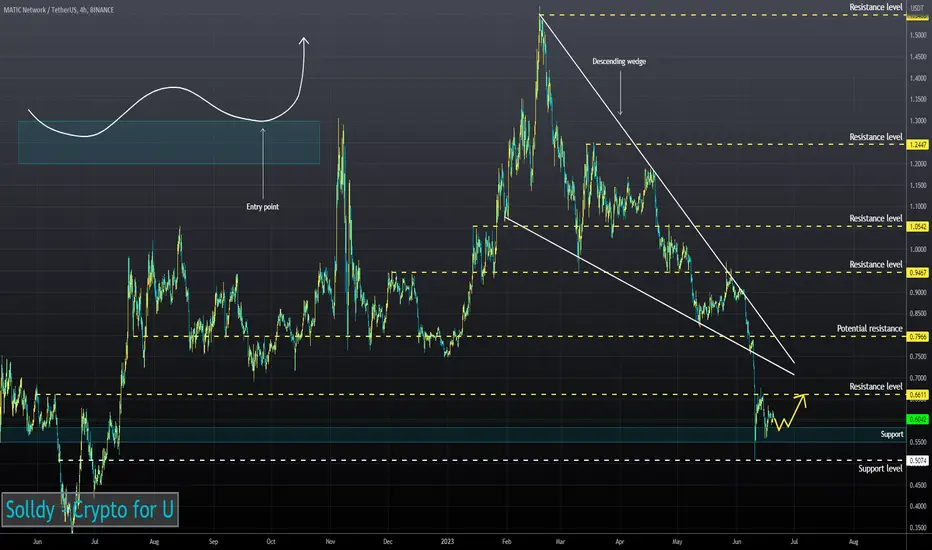
Polygon Matic price don't give up and trying growthLet's start the idea of MATICUSDT by thinking about why we should draw medium-term estimates of possible price movements.
Here is our medium-term idea for MATICUSDT, which we published 6 months ago.
Back then, we clearly described two scenarios and under what conditions to stick to one or the other. There is an action plan, there are critical points of activation of one of the scenarios, and it remains to trade in the right direction. And then, like everyone else, we had no idea that someone would think of classifying MATIC as a "security" and that this would cause the price to crash.
You can easily test the idea)
In the short term, the MATICUSD price is approaching a strong liquidity zone around $0.73, which has been acting as support for a long time, so probably it will not be possible to break it up at the first attempt.
A slight correction will follow, and the second time around, you can try to break through to the top of the channel at $0.83
_____________________
Did you like our analysis? Leave a comment, like, and follow to get more

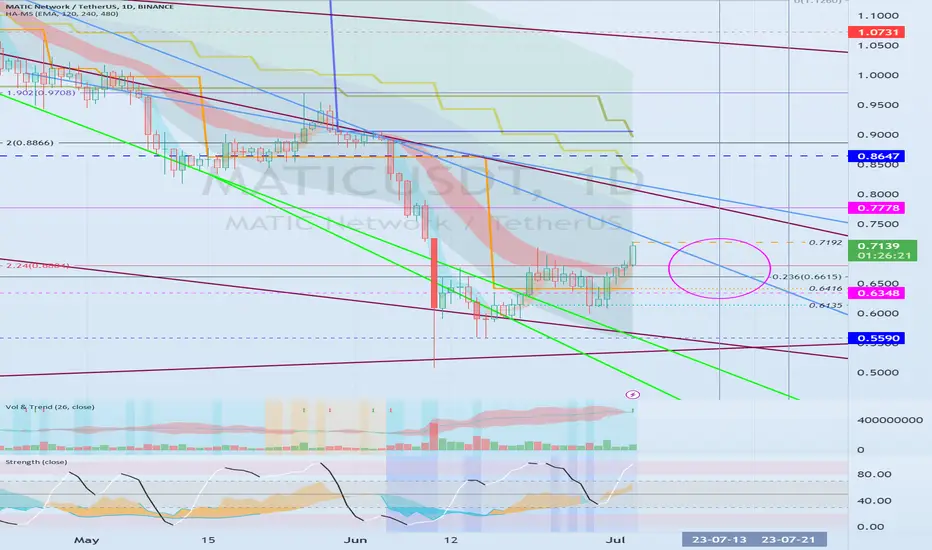
MATICUSD - Double Bottom IdeaMATICUSD has finally double bottomed indicated in the circles.
I expect a bullish rally due to this bottom formation.
Daily chart

MATIC Polygon and the Altcoin Season ThesisIf you haven`t sold MATIC here:
Then the recent developments in the cryptocurrency market, particularly the favorable court ruling for Ripple Labs, signal an optimistic start to a new altcoin season.
With the federal judge ruling that some of Ripple's sales of the XRP token do not fully meet the definition of a securities offering, it instills confidence in the altcoin space.
This ruling brings clarity to the regulatory landscape and alleviates concerns surrounding XRP, leading to major cryptocurrency exchanges, including Coinbase, relisting the token. The reintroduction of XRP to these platforms demonstrates growing acceptance and renewed interest in this altcoin.
The anticipation surrounding the approval of a spot bitcoin ETF in the United States adds to the positive sentiment in the market.
The successful launch of a previously approved ETF in Europe further reinforces the upward trend for altcoins.
The recent court ruling that declared XRP as not a security sets a precedent that could potentially benefit other cryptocurrencies currently classified as securities by the SEC. In the SEC's case against Binance, they designated 10 cryptocurrencies, including BNB, BUSD, SOL, ADA, MATIC, ATOM, SAND, MANA, AXS, and COTI, as securities.
Additionally, in the SEC's lawsuit against Coinbase, they named 13 cryptocurrencies, reinforcing their stance on SOL, ADA, MATIC, SAND, and AXS, and adding CHZ, FLOW, ICP, NEAR, VGX, and NEXO to the list.
This development showcases the increasing institutional acceptance of cryptocurrencies and creates a ripple effect across the market, providing a boost for various altcoins, including MATIC Polygon, for which my price target is $0.95.
Looking forward to read your opinion about it!

MATIC, XRP ☁️;BTC, BNB, ADA ☀️?The sun keeps shining ☀️ on the global cryptosphere, promising a slightly bullish market with upside potential in the next 24 hours. However, Ripple’s XRP and Polygon’s Matic encounter some clouds ☁️, signaling a potential downside trend.
Looking ahead over the next week, the forecast is mixed with cloudy weather ☁️ for altcoins like Ether, Litecoin, XRP, and Matic. On the other hand, Bitcoin, Binance, and Cardano enjoy sunnier trading conditions ☀️, suggesting a continued upside potential.
Follow us for more crypto weather insights!

MATICUSD ❕ upward channelMATIC is moving in an ascending channel.
RSI is moving in a bullish zone.
Price has fixed above the 50EMA on the 4H TF.
The chart will continue to rise.

A rise above 0.7778 is expected for a change in trendHello?
Traders, welcome.
If you "Follow", you can always get new information quickly.
Please also click "Boost".
Have a good day.
-------------------------------------
(MATICUSDT chart)
The HA-Low indicator on the 1W chart is about to form at the 0.7192 point.
Accordingly, when the HA-Low indicator on the 1W chart is created at the 0.7192 point, the key is whether it can be supported and rise around 0.7192.
However, since the 1M chart's HA-Low indicator was not created, you need to check whether the 1M chart's HA-Low indicator is created or supported around 0.7778.
If it doesn't, it's because it's likely to stay on the downtrend.
Therefore, it is necessary to check whether it is supported and rises in the 0.7192-0.7778 section.
If not, you should check if you can get support in the 0.6348-0.7192 interval.
As it maintains an uptrend while breaking through the HA-Low indicator on the 1D chart upwards.
1st: 0.7778
2nd: 0.08647-0.9059
Split selling is possible when resistance is received near the 1st and 2nd above.
The next period of volatility is around July 13th.
The CCI indicator is entering the oversold zone.
Therefore, when exiting an oversold zone, you need to check which point or zone is supported or resisted.
-------------------------------------------------- -------------------------------------------
** All descriptions are for reference only and do not guarantee profit or loss in investment.
** Even if you know other people's know-how, it takes a considerable period of time to make it your own.
** This is a chart created with my know-how.
---------------------------------
MATIC - KeyLevels for next weekIf you wanna take a trade on MATIC, maybe before that, you need to conisder this KeyLevels of support and resistance areas.
Careful with longs until on daily is still bearish / downtrend

Matic shortPolygon 2.0 architecture revealed, introduces unified liquidity & unlimited scalability
Formerly Matic Network, Polygon has seen attention lately, considering Securities and Exchange Commission clampdowns and platform delisting. Alongside other top alts, the SEC named MATIC as security in ongoing crypto regulation wave.
Polygon MATIC potential rally with the Stock MarketCryptocurrencies were left behind by the recent Stock Market rally.
With the arrival of new BTC Bitcoin ETFs, I expect the Crypto Market to follow!
MATIC/USDT long:
Entry Range: $0.60 - 0.65
Take Profit 1: $0.70
Take Profit 2: $0.82
Take Profit 3: $0.93
Stop Loss: $0.51

MATICUSD ❕ channel crossingTD Sequential has formed an up reversal signal on the 4H TF.
The RSI chart is in the bullish zone (1H and 30m TFs)
I believe that MATIC will rise after fixing in the channel.


MATICUSD is rebounding on a 2.5 year old Support!Polygon / MATICUSD almost hit the Rising Support that goes back all the way to January 2021 and is now rebounding.
This is perfectly viewed on the 1week time frame where the price hit the 1week MA200.
As the 1day RSI is also rebounding, a crossing over the MA line, will confirm the bullish trend, like it did on July 4th 2022.
Buy and target the 1day MA100 on the medium term at 1.1500.
Follow us, like the idea and leave a comment below!!

MATICUSDT any dip to weekly support is for longAnalysis: HTF
The price broke down from the previous weekly support and came back down to next weekly support which is marked as WS1 on the chart. That support did not hold but weekly support WS2 held the price and provided the expected bounce. Next weekly support level is WS2 but I doubt we will visit there. Any further dip to the weekly support WS1 is for buying. As far as current price action is concerned, it is currently facing daily resistance. If this resistance is broken, the next level is the next daily resistance DR2 around 0.77.

Polygon (MATIC) Bull ScenarioDo you think Altcoins will stall when Bitcoin starts running? If you think the alts will walk too, I can talk to you about MATIC.
In my opinion, I think we are in the days when we have the last opportunity to buy MATIC, which will be the star of the next bull season.
As you can see on the black lines, MATIC, which made the symmetrical triangle it made in the past, entered short-term downtrends 2 times within this symmetrical triangle (Orange line) and after the second break, the bull run started. We are on the eve of this process.
In the two symmetrical triangle patterns, we can see that MATIC is spending a lot of time inside the 0.382 and 0.618 levels of Fibonacci retracement. (Purple Boxes)
In addition, the bottoms and tops that form the symmetrical triangle in both patterns are made at the same Fibonacci levels. This is another indication that the two patterns are very similar. (Red arrow and circles)
Therefore, when we look at the Fibonacci levels again, we can see that when the bull season is entered, the targets will be $10 and $87, respectively. This means 1672% when the first target arrives; In the second target, a profit of 14000% will be obtained.
Since the risk/reward ratio in this scenario fits my trading style and strategy, I made my first purchase at this level. I will add when the orange resistance is broken and retested, and I will add my position at the retest after the triangle break (black) and wait for the $87 level.

MATICUSD ❕ low volatilityTrading volumes and volatility have declined.
The RSI indicates that sellers have weakened.
TD Sequential has formed a reversal signal up on the 1H TF.
I think MATIC will bounce if it holds the support area.