💥MATICUSDT 4H-TIMEFRAME ANALYSIS💥MATICUSDT 4H-TIMEFRAME ANALYSIS
💗Hello ladies and gentlemen
This is my new idea for 💥MATIC Polygon
I hope my idea is clear
Support me by like and share thank you
Stay Safe💯💲💲💲
Good luck💰😍
MATICUSDT

MATICUSDT - Bottom Along Trend Line Using the RSI to view a trend line.
Higher low is also present which is a good sign.
Viewing the RSI on the monthly Matic hasn't really seen much action at all. We are yet to experience a second bull run.

Matic Polygon eyes 200% gains on PolygonPolygon in high-profile partnerships
Notably, Meta, the parent company of Instagram, named Polygon as its initial partner for its upcoming nonfungible token (NFT) tools that allow users to mint, showcase and sell their digital collectibles on and off the social media platform.
Meanwhile, banking giant JPMorgan used Polygon to conduct its first live trade (worth about $71,000) on a public blockchain, marking a concrete step toward integrating cryptocurrencies into traditional financial frameworks.
MATIC, a utility and staking token within the Polygon blockchain ecosystem, rose over 13% to $0.985 after the announcements, accompanied by an uptick in daily trading volume.
MATIC’s upside move came as a part of a broader recovery rally across the crypto sector that started in mid-June. MATIC’s price has rebounded by more than 200%, a trend that will likely sustain in the coming months.
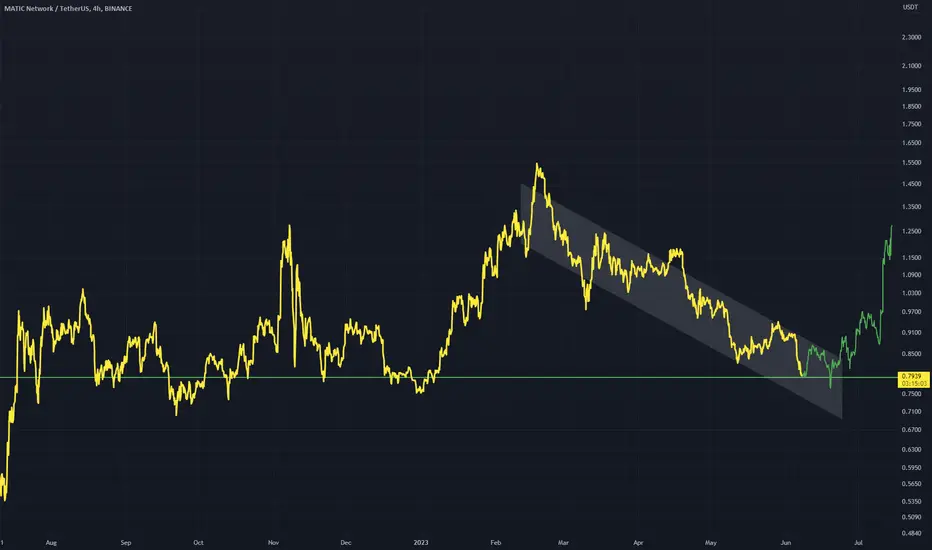
On the daily chart, MATIC has painted a cup-and-handle setup, which comprises a U-shaped recovery followed by a downward drifting channel. The token is now eyeing a decisive breakout above the pattern’s neckline range (the red bar in the chart below) to reach $2.89, its primary upside target.
As a rule of technical analysis, a cup-and-handle pattern’s target is measured after adding the distance between the cup’s bottom and neckline to the potential breakout point. As a result, MATIC is now eyeing a 200% price rally by the end of Q1 2023.
Fundamentally, MATIC’s demand could keep growing, given Polygon’s growing NFT projects launched by mainstream companies.
On the other hand, macro risks continue to threaten the ongoing crypto market recovery, which may hurt Polygon despite its growing partnerships with big-name brands. That being said, a strong pullback from the cup-and-handle pattern neckline range could invalidate the bullish setup altogether.
Technical analysis:
I have marked the important zones with numbers and explained them :
1 Agresive Sellers shortened Matic at 2.60. Technically The market had very low bullish volume and huge bearish Deltas .
The market broke the short term support at 1.75 and it became again resistance.
Now the sellers started to build their positions stronger. Long term buyers took partial profits here, new buyers took losses, and sellers sold more here.
The creation of more sell orders finally pulled down the market to the deepst waters0.39145
2 This zone was and is defending strongly by Matic Long holders.
The sellers took some profits here.The long term buyers bought more matic and new buyers came into the market.
Also some late sellers took losses here or took profits.Also some sellers became new buyers. More Buy orders pushed up and pumped matic to 1.40(Defended ell area=Double Resistance)
3 Long move has a double support 0.73 and 0.65 area
The increased volume and delta at this area supports buying positions,but also the volatility .
4 A break above 1.5463 increases more delta bullish and more buyers will support this positin but this time more agressively.
The market has higher highs and higher Lows structure.To build a long term Bullish trend, a break above 1.5460 is essential
5 A break and holding above 1.54680 finally establishes a strong lbullish long term trend
6A break of 1.6590 is catastrophic for the majortiy bulls,but the final support 0.38 could save them.
If this zone has lost, The sellers will control the market for a longer periode, as the resitance numbers make it very hard for bulls to take advantageof the bull trend.

MATICUSDT.1DHello dear friends,
*Mars Signals Team wishes you high profits*
This is a one day time frame analysis for MATICUSDT.1D
We are in daily time frame. As you can see, the price has reached below our support line and we have two scenarios in mind.
First scenario: if the price cannot stabilize above our resistance line, we consider the possibility of falling to the second support line.
Second scenario: If the price can stabilize above the first resistance line, we expect to climb up to the second resistance line.
Warning: This is just a suggestion and we do not guarantee profits. We advise you to analyze the chart before opening any positions.
Take care

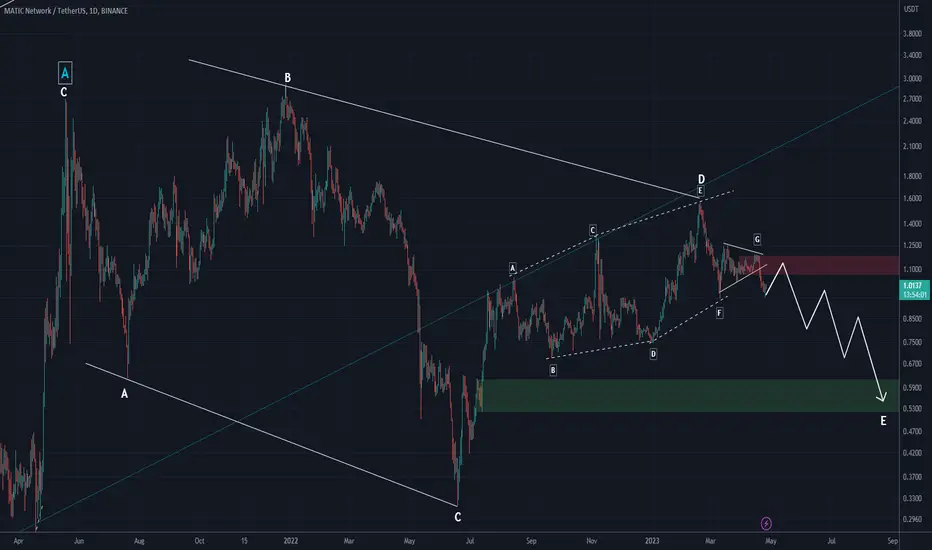
MATIC is about to finish BEAR market!Hello, my friends!
We had two options in analysis for today: MATIC and ETH. MATIC won this battle. This asset has the very interestin price formation. Therefore I can assume that bear market will be finished soon. Last dump affected BINANCE:MATICUSDT also, but price was not able to break even the lowest point of the current bear market.
Let's take a look at the price chart. Let's consider the following Elliott waves marking. Using our favorite Awesome Oscillator I defined the wave 3 bottom. It's located at $0.34. After that we saw the huge in terms of time wave 4. This reactive wave has been represented as the ABC zigzag correction. Of course it has reach a little bit higher price that it is usual for such waves. Waves 4 usually reach the zone between 0.38 and 0.5 Fibonacci retracement, applied to wave 3. In our case we saw the 0.61 level, but it's ok.
Wave 4 in my opinion is 99% finished and I am not waiting for the price above $1.5 before it will break down $0.34 low. The main reasons for that is zero line crossover on Awesome oscillator and the increasing donward momentum. Now I consider the wave 5. The final wave in this bear market. I cannot define the target for the wave 5 but price should set the new lower low. The best confirmation for the bull market start is gonna be our five magic bullets:
1.Bullish divergence with Awesome Oscillator
2.Fractal at the bottom on 4D - 1W time frames
3.Squat bar at the bottom (or even bullish reversal bar)
4.Momentum change to the upward
5.Target zone reach (below $0.34)
Be patient, market will give us the insane opportunity very soon.
Best regards, Ivan
_____________________________________________________________
🔥Please, follow me and smash the rocket🚀 button to support me🔥

MATICUSDT 1D IDEAhey, hope you are all doing good, dua to market condition here how I'm looking this new setup, expecting to price reach to fill 50% of the previous day candle wick and bounce from the support to the previous resistance which is a very strong resistance, hope this one played well as like before. follow me for more new setups. Thanks
MATIC downswings will begin soonHi, dear traders. how are you ? Today we have a viewpoint to SELL/SHORT the MATIC symbol.
For risk management, please don't forget stop loss and capital management
When we reach the first target, save some profit and then change the stop to entry
Comment if you have any questions
Thank You
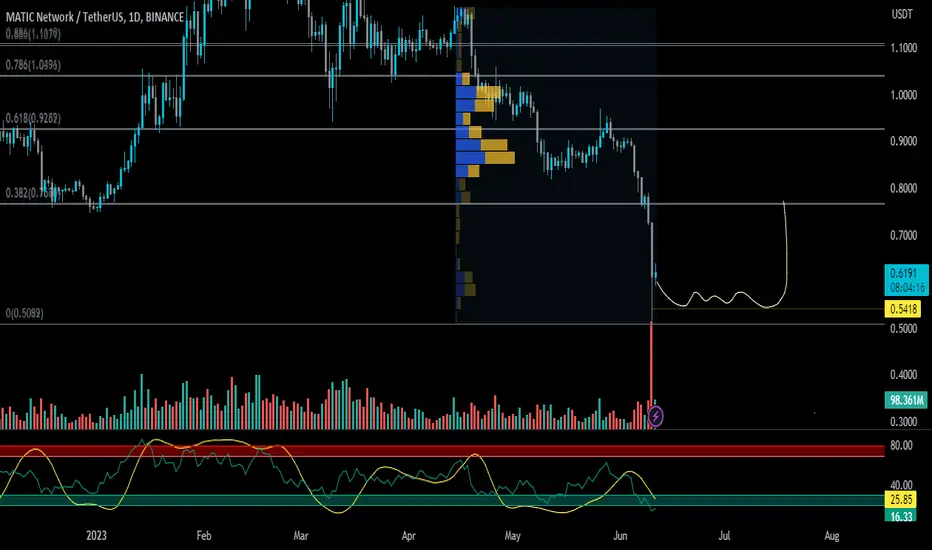
Robinhood will delist Polygon MATICIf you haven`t sold MATIC here:
Then you should know that Robinhood, the well-known trading platform, will discontinue its support for three cryptocurrencies implicated in SEC lawsuits against Binance and Coinbase.
Effective from June 27, 2023, Robinhood will no longer provide support for Cardano (ADA), Polygon (MATIC), and Solana (SOL).
In My opinion MATIC will test the support of $0.50.
Looking forward to read your opinion about it.

MATICUSDT short position (50 % profit)The upsloping support has held so far.
If we get the bounce, we expect the price to create the lower high which would be an entry for short position.
If the upsloping support fails, and the price confirms it as a resistance, it may be an entry for short as well.
Entry, Take profit, Stop loss and final target are shown on the chart.
Good luck

MATIC - Are we Going to DOUBLE BOTTOM!!KUCOIN:MATICUSDT
CRYPTOCAP:BTC sitting in the huge Head & Shoulders provides ideas for possible downside.
You can see my idea here: tinyurl.com
Price action is lurking around below the neckline after breaking it. Possibly a build up.
Once it moves we activate our plan.
CRYPTOCAP:MATIC looks interesting sitting in a Falling Wedge and could we get a Double Botton for upside break or
would we need to wait for this at the Possible Pullback level should CRYPTOCAP:BTC breakdown.
My regular followers know I like to have a Plan for my Long and Short but with clear Action and Trigger points so that I can execute like a bot and play my edge.
Always having Plan A and Plan B scenarios so we can react once the markets provide an opportunity to execute our edge.
If you liked this idea or if you have your own opinion about it, write in the comments.
The information and publications are not meant to be, and do not constitute, financial, investment, trading, or other types of advice or recommendations

#MATIC High Probability is 2.11 $ Before Go Below 0.30 $ #MATIC is holding support and bulls wants to take this upside for closing their Long positions. When they will take this 2-2.20 USD, then we can see Sharp Drop or Sell Off for 0.30 USD..

Polygon Falling Wedge FormationIn MATIC, a very clear falling wedge formation can be seen in the daily timeframe.
At the same time, MATIC, which is based on 0.75 support, can break the falling wedge if it is rejected from this support.
Once the wedge is broken up, the first target will be $1.19 and the main target will be $1.60.

MATIC📊 #MATICUSDT
⏱ TIME: 1D
📝It is reaching very important areas for spot purchases, and you can make purchases in a gradual and managed manner. It has also been checked for fundamental analysis and is a sustainable and strong project for the future.
📍The initial buying limit: 0.7 $
📍The second buying limit: 0.63 $
📍The third buying limit: 0.47 $
📌TP1: 1.55 $
📌TP2: 2.9 $
📌TP3: 5.53 $
📌TP4: 12 $

MATICUSD - Top Cap IndicatorUsing the Top Cap indicator to plot future bull runs
I expect Matic to drop to a low along the horizontal support level that is shown in this analysis
From this low bulls can gain momentum and push price up to the top cap peak at around $10.
This would be an enormous move, but MATIC is still very young and has a lot of promise.

MATIC LONGCurrently, the coin is moving in a downward direction. As we can see, a descending wedge pattern is forming, and I expect a breakout from this wedge pattern in the near future.
I anticipate the price to fall to the levels of $0.55 - $0.67 per coin, where I would start buying on the spot or consider going long on futures.
The reasons for entering at this level are:
Weekly FVG indicates a potential opportunity.
The 200-day ema on the Weekly TF usually acts as strong support for the price.
The 50-day ema on the Monthly TF also adds to the potential support level.
However, it's important to note that a break below $0.55 could signify further price decline. In such a case, I would assess the long position based on the situation.


DUMP IT Mr Matichello guys
so as you see I expect matic to be dumped to 0.5 fib level log
bag holders who didnt take the 150x profit they will regret it for the next 5 years
Thanks

Matic price actionMatic is moving in a descending channel and is right now testing its 3 hour support. If Matic breaks its trend downwards, then we can see Matic testing its 6 hour support region; however, if Bitcoin pulls back up, then we can see Matic moving towards the mid range mentioned in this chart.

MATICUSDT at weekly support and likely to head up to 0.92-0.94The doubt which I had finally played out. I was not very comfortable with the long trade from the daily support since the price had not tapped into the weekly support. But now it has and offers a good opportunity for long. The price might dip below the support briefly but that does not scare us from taking a long position here. The first target shall be the weekly resistance zone sitting around 0.92-0.94.

MATICUSD - Strong Horizontal ReachedMATIC has reached a strong horizontal support.
I expect a price reversal at this level due to the large support that is here.
Bars pattern shows this reversal out of the down channel.
MaticThe trend is still bearish, if it reaches the green lines, it will be checked for a buy step in the green box range.
The biggest risk is not to risk!
In a world where everything changes so quickly, the only strategy that guarantees failure is not taking risks.
"Mark Zuckerberg"

MATIC SHORT SETUPHi, dear traders. how are you ? Today we have a viewpoint to SELL/SHORT the MATIC symbol.
For risk management, please don't forget stop loss and capital management
When we reach the first target, save some profit and then change the stop to entry
Comment if you have any questions
Thank You

MATIC to retest $0.95? MATIC faced price rejection at $0.95, setting it to retrace near the range low.
In the second half of May, the price reacted to the $0.86 - $0.88 zone (cyan). This level could offer a long opportunity, targeting $0.95.
Entry: $0.882
Exit: $0.950
SL: $0.863
RR: 3.7
