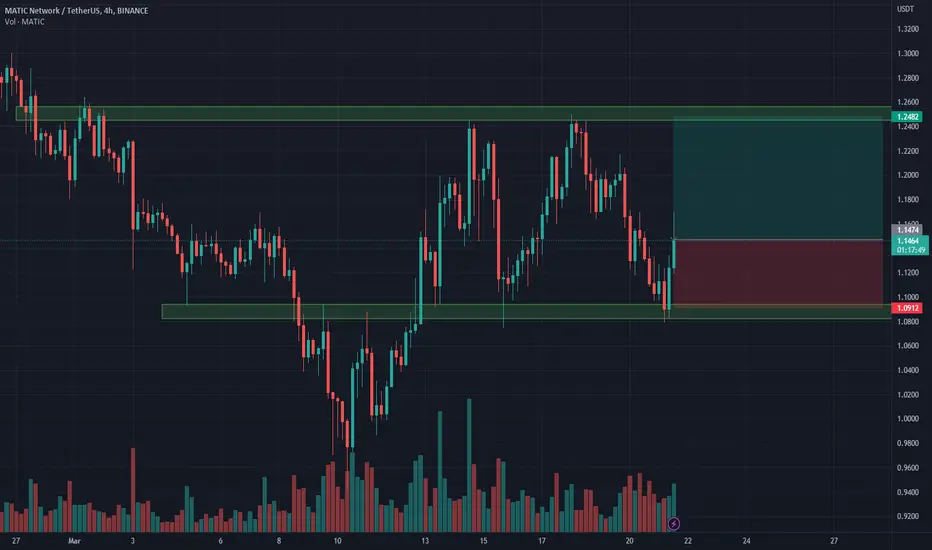
MATIC (Polygon) after 80% profit we enter short !#MATIC / USD Update:
$MATIC is currently trading at $1.059
According to Coinlion Trend Trader Indicator, MATIC is currently bearish. Short alert at $1.12 (4th of March)
Reminder last bull run from $0.85 (01/11/2023) till the $1.26 (02/25) with plenty of Profit alerts (60-80%)
Now we are shorted MATIC
There is a buying pressure between $0.94 and $1.01
And we are on a support (200EMA) at $1.04
We can reach the bottom of the ascending channel at $0.95 and take some profit
What do you think ?
Please click LIKE button and Appreciate my work.
Coinlion Trend Trader indicator tells me when to enter short or long, when to exit and when to take profit :-)
Thank you.
MATICUSDT

Matic | It Is At An Important Level Maticusdt
Buyers have to defend this support, otherwise the entire control will be in the hands of sellers.
Although the market doesn't work on anyone's opinion, anything can happen, but I am Epxecting that the sellers will get stronger and the price can go down by 20-30% from here.
Note : We only give ldea's from our
experience and knowledge, it does not
mean that it will be 100% correct, the
market is always unpredictable, anything
can happen anytime.
Always trade with your own research and
knowledge. If You Are Satisfied With Our
Work Then Join.

MATIC on Daily Chart Shows Bullish TrendThe MATIC trend on the daily chart is bullish and will surely seek its last maximum in the coming days


#MaticCurrently, in wave 2 of correction, the cycle is lower and therefore has less weight. But in the higher cycle, the floor is confirmed.
The corrective wave 2 of the higher cycle can correct up to 23% of the Fibo of the previous wave, which is the range of 1.0078.
Therefore, I expect that the bottom of wave 2 will be closed in these areas. The credit level was also announced in the previous post that the bottom of the previous wave is in the range of 94 cents.

MATIC/USDT 4HInterval Resistance and SupportHello everyone, let's look at the MATIC to USDT chart on a 4-hour timeframe. As you can see, the price is moving below the local downtrend line.
Let's start with the support line and as you can see the first support in the near future is $1.07, if the support is broken then the next support is $1.06 and $1.04.
Now let's go to the resistance line, as you can see first we have a resistance zone from $1.08 to $1.10, if we manage to break it, the second zone is from $1.11 to $1.12 and then resistance at $1.13.
Looking at the CHOP indicator, we see that there is a lot of energy for further movement, the MACD is on the verge of returning to a local downtrend, while the RSI is in the process of rebounding in a downtrend..

MATIC 4Hr IdeaIdea showing a higher low double bottom on Matic 4Hr chart
A bottom here would be strong for MATIC on many timeframes
Shown the bottom with the bars pattern

MATICUSDT1.Matic Has formed a H&S on the Daily
2. rejected the Supply zone 3-4 Times at 1.16.
3. Its in Large Bear Flag and will retest the lows at 0.76 and 0.3 eventually

MATIC As we can see, MATIC needs a bit of fall before going up in the Long Trading Volume.
All patterns show similarity, so the up trend is the case.
You may open a position but have to wait for a -10% to drop first.
If you set up the base line you will see that it has to drop a bit more, below the EMA to continue the first patters of Fib. Circles, but
it is a Long position.
Good luck!!

Polygon Matic Analysis on 1D TF.Hi, Tradingview community.
Here i post my Analysis on Matic.
Biasis : Bullish
TF . 1D
I expect another leg up on MATIC, till 1.70$ in the Daily Resistence.
Today the price reached my entry target at 1.1120 and i opened a long/buy spot position.
The Demand/Supply area are supported from Fib. Retracement S/R.
Not a financial advise, i share my personal trade setup.

MATIC Weekly View - March 2023Hello Guys, Weekly Analysis is on the MATICUSDT Symbol in a 1H Time frame, I Hope it Will be Useful for You, Don't Forget to Like, Follow, Comment

MATICUSDT the market decided to go to the correctionHi all. For many coins, the trend line has now been broken to the long. After a rapid growth, we decided to go for another correction. Therefore, you can take short from the trend line to short, from which the price is likely to go down beyond the support level. Let's put a stop at 1.1304. And the target is the next support level at 0.96

MATIC shortPolygan lost uptrend (green line)
0.95 support line, is nocked 3 times (1,2,3)
Both conditions shows bearish market
Support level A (Weak) and B (Strong) are next level of Polygan areas

🔥MATIC REACH THE BOTTOM OF THE CHANNEL: REVERSE SOON?🔥Hi, friends! During the last speech of Jerome Powell said that if USA launch CBDC (digital USD), the price of crypto will go to 0. Also, the troubles with US banks push the price of the whole market lower.
Matic is one of the strongest altcoins, so I think it will be the top gainer among other altcoins when BTC start the pullback.
📊 MY TRADING PLANS FOR MATIC:
🔥 test the lower boundary of the channel as the support
🔥 test the $0.88-0.92 value area as the support
🔥 volume growth which indicates the bottom
🔥 bullish BTC
🚩 I use DOM and Footrpint
✅ MY TARGETS FOR MATIC:
1. $1.4 - the mid of the channel
2. $1.8 - the top of the channel
💻Friends, press the "boost"🚀 button, write comments and share with your friends - it will be the best THANK YOU.
P.S. Personally, I open an entry if the price shows it according to my strategy.
Always do your analysis before making a trade

long MATIC$MATIC bounced off the support level. Rise to resistance level at 1.24$ is likely to happen.
MATIC next MASSIVE move SOON !!Hello Traders,
Matic has been forming an ascending triangle since couple of weeks now !
It respected it`s borders very well !! , and I guess MATIC is one of few coins that didn't drop down again to it`s dip.
-
On the chart you can see the Ascending triangle with it's target (move the chart to see it)
Breakout should be before 19 of July 2022.
I guess it will be before this date maybe around 15 JULY
Set your alarms ! and lets trade it as it go !!
** Notice that ascending triangles are more bullish than bearish, but in a bear market with all of the following situations running around us worldwide, you have to trade as it do, not by a greater probability.
-
,,, Tell me, Do you count this as a Rising wedge? or an ascending triangle ?
Thumb up for more <3
Follow for more ideas on another ALTCOINS

maticmatic technical analysis:
Friends who were professionals made a good purchase in the middle of the fork. In the next analysis, I will specify the targets of the buying position.
Good luck
Karim Heydari


✴️ Let's Zoom In On Polygon | Easy Fast Target MappedWe looked at MATICUSDT (Polygon) long-term, weekly timeframe, but what about the short-term, how are things looking?
Things are looking good to go straight to the point.
When looking at the daily timeframe we can see MATICUSDT just recovered after hitting MA200.
This right away tells us that this move is only getting started and there is more to come.
This recovery happens at a higher low and thus the higher high is basically guaranteed. If not certainly, these additional bullish signals should help:
- Increasing volume.
- Bullish MACD cross and Bullish RSI.
This is a powerful signal.
Both indicators are showing hidden bullish divergence as they printed lower lows in a period when MATICUSDT printed a strong higher low.
We've been saying it will continue growing and it is happening... Be prepared!
Maximize profits because we don't know how the year will end.
Secure, stay safe.
See the "Related Ideas" below.
Like/Boost, Comment & Follow!
Namaste.

MATIC Weekly View - March 2023Hello Guys, Weekly Analysis is on the MATICUSDT Symbol in a 1H Time frame, I Hope it Will be Useful for You, Don't Forget to Like, Follow, Comment

MATICUSDT possibility chart patternMATICUSDT possibility cup and handle chart pattern. need confirmation 2-3 days..

✴️ Polygon Super Healthy, Potential To Move Above $2.35MATICUSDT (Polygon) continues with one of the healthiest chart.
We had a 3 weeks correction that bounced off EMA100 and closed above EMA10.
Weekly, prices remain safely trading above all these moving averages (EMA10/21/50/100), this is ultra-bullish.
Higher highs and higher lows since June 2022, more to come, stay tuned.
The target is set above $2.35 but we go step by step.
Remember to boost, comment and follow.
Namaste.

