Quick look at MATIC Here's a quick look at the two-day Magic chart. As we can see, the price has been oscillating within the bigger rising channel since June 2022, and if the price breaks below the channel, we should expect a move down to the red support zone.
For now, the price has to hold above the green support zone to avoid further downside. If the does break below the green support zone, a move to at least the bottom of the channel is expected - 0.9$ area.
Remember that the DXY is currently rallying, and if that continues, the total crypto market will bleed, and so will MATIC.
My opinion is that MATIC will probably come down to 0.3$-0.5$ before the end of the macro downtrend. - Trade safe!
Also, keep an eye ETH / BTC pair ;)
-------------------------------------------
Key Dates to Watch in March:
10 Mar: US Non-farm Payrolls
10 Mar: Mt. Gox Distribution
14 Mar: #CPI Data Release
15 Mar: #PPI Data Release
21/22 Mar: #FOMC Meeting
30 Mar: GDP Report
-------------------------------------------
What's a Fair Value Gap?:
A fair value gap is the difference between a financial instrument's theoretical value and market value, such as a derivative or security. It can indicate a misprizing opportunity for traders to profit by buying or selling at the misprized level. In other words, there is a gap in the price in which some open orders still need to be filled. The price will return to fill the orders.
-------------------------------------------
If you like the content, then make sure to comment and like the post :D
Follow me for daily profitable trading setups.
BTC dictates the market. If BTC falls, then Alts will drop as well. Trade safe!
MATICUSDT

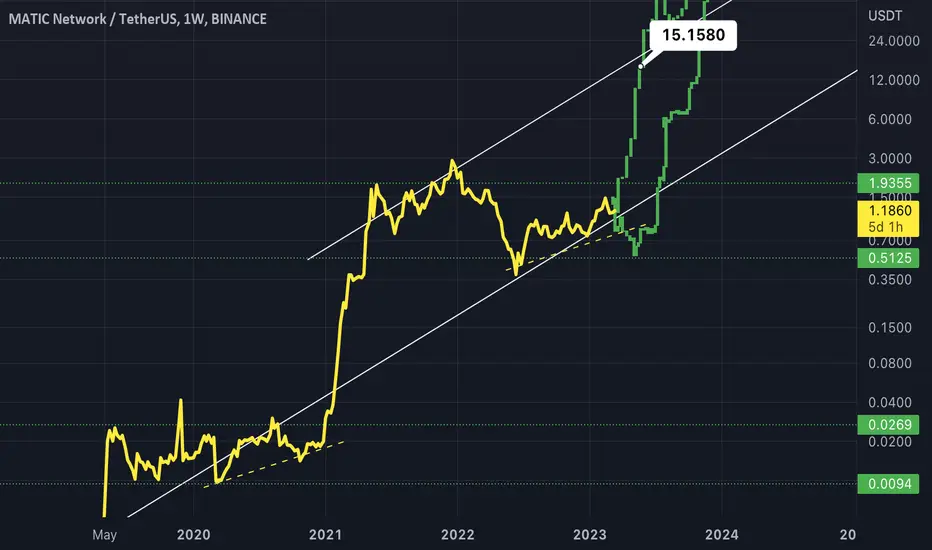
Long Term MATICUSD ProjectionsPossible long term projections of MATIC price based on trendlines and several macroeconomic scenarios. Expect a bear run if MATIC ecosystem suffers massive FUD.
Personally I'm bullish.
Obviously it wouldn't go negative in a catastrophe this is just what would happen if it went to 0. Lol

MATICUSDTMATIC has broken the ascending channel on the 1H chart, and has gone in search of the 200 MM which is a powerful support.
I believe that the asset will settle above the 1.1864 level and continue the upward movement, not least because in all the indicators used in the analysis there is an indication of an increase. MATIC will rise again if it stays above MM200
Following are the next supports and resistances on the 1H time frame
Main support levels : 1.1015 / 1.0368
Main Resistance Levels: 1.1864 / 1.2497
MM200: 1.1015

MATICUSDT SHORT TERM LONG 15M this is my idea maticusdt is long position but after price get on the pointe next like this pattern enjoyed
maticusdt binance 15m short terms

🔴 MATIC: NEXT TRADES!We are watching the reaction now from the bearish engulfing.
The levels for entering a long position are marked with orange lines.
Key resistances are red lines.

MATICUSD Up IdeaIdea showing a potential bull run contained within a channel on MATIC
MATICUSD is one of the coins that is the most bullish imho
Bars pattern placed reflects my thoughts about price rises (in green)


MATICUSDTHello Crypto Lovers,
Mars Signals team wishes you high profits.
This is a 4-hour-time frame analysis for MATICUSDT
According to our previous analysis on March 8, we expected a falling trend to happen for the price and here we have the precise prediction of our team. In the current chart, R1 and R2 are the resistance areas which contain the unsuccessful attempts of the price to rise. And S1 and S2 are our support areas at the bottom expressing the well support of price at several points. Therefore, the price could rise over R1 and after a recovery trend and we see its fluctuation above this area. So the price would have two choices for us. By providing us some confirmation candles for a rise, there is a possibility of an increase up to R2 and even higher than that via more fluctuation and fixation over there. But we expect a fall to happen for the price to reach S1 and then via having some confirmation candles, it will face more rise upward. Also you should know that in case the price loses the support at any points and falls below S1 line, surely more decline happens to it down to S2. We highly recommend you to obtain every piece of information and idea through our analyses for receiving more profitable trades.
Warning: This is just a suggestion and we do not guarantee profits. We advise you to analyze the chart before opening any positions.
Wish you luck

MATIC 4H BUY / SUPPORT ZONEMATIC 4H support is now at ~$1.12
Enter 50% at the current price
and try to set some BUY orders near the support zone
If MATIC stays above the trendline,
the Take-Profit target would be 5%, 10%, and 15% from your entry
Cheers

This Idea is for MATICUSDT LongHello dear traders
So, today my idea about MATICUSDT long
The possible scenario for MATIC is clearly visible on the chart for the Long term
possible Entries for long is 0.87_0.945
targets is
TP1: 1.08
TP2: 1.15
TP3: 1.25
TP4: 1.295
TP5: 1.42
TP6: 1.51
TP7: 1.68
BINANCE:MATICUSDT

Matic/USD, I will buy MATIC at $0.2!Greetings everyone! It's great to be back with another analysis. Today, I'd like to share my thoughts on the Matic/USD market. In my opinion, the current rally of Matic is presenting us with a favorable opportunity to establish a short position. The supply or resistance level is reportedly above $1.4, and as a result, I recommend short selling Matic at a price range of $1.4 to $1.5.
In terms of spot trading, I advise against purchasing Matic until its value reaches the range of $0.19 to $0.2. It is important to always perform due diligence and exercise caution when making investment decisions. Stay safe and be sure to do your own research.

MATICUSDT IdeaMATICUSDT - MATICUSD BINANCE:MATICUSDT BINANCE:MATICUSD
✅ ✅ Risk warning, disclaimer: the above is a personal market judgment and analysis based on published information and historical chart data on The trading view,
And only some of these analyzes are my actual real trades.
I hope Traders consider I am Not responsible for your trades and investment decision.


MATICUSDT LONGMatic tested the support and moving up, but I case we can catch up the support again we are in

MATIC to $4Please do your DD as this is not a financial advice.
Matic forming a bullish pattern and ready for a rally up to around $4 with the high end target at $9.


MATIC is under bearish controlMATIC is so different from the whole market. However, it's also in a bearish state. but keep in mind that in case of any consolidation (of the bearish movement), MATIC will have a stronger move and will catch the green zone. then it (and the market) will continue the downtrend.
its best timeframe to daytrade is 15min. only open short in market demand saturation.

Polygon MATIC Price targets if SEC will ban Crypto StakingCoinbase CEO says he heard rumors the SEC wants to ban crypto staking.
Already crypto exchange Kraken shuts down crypto-staking.
This will have ripple effects in the entire industry!
My price targets for Polygon MATIC are:
MATIC/USDT short
Entry Range: $1.20 - 1.30
Take Profit 1: $1.05
Take Profit 2: $0.88
Take Profit 3: $0.74
Stop Loss: $1.41

Short MATIC vs USDTMatic is at a major Montly resistance level and it's forming a LH on lower time frames.
We can see that the momentum is slowing down and this could break down soon(not rulling out some scam wicks up before it breaks).
Scaling in shorts here with Stops above last high. If Stops get triggered, will wait for price to get back under $1.55 to pull the trigger again.
Good luck.
Follow, like the idea and feel free to leave a comment if you like it.
Check out other ideas if you like this one.

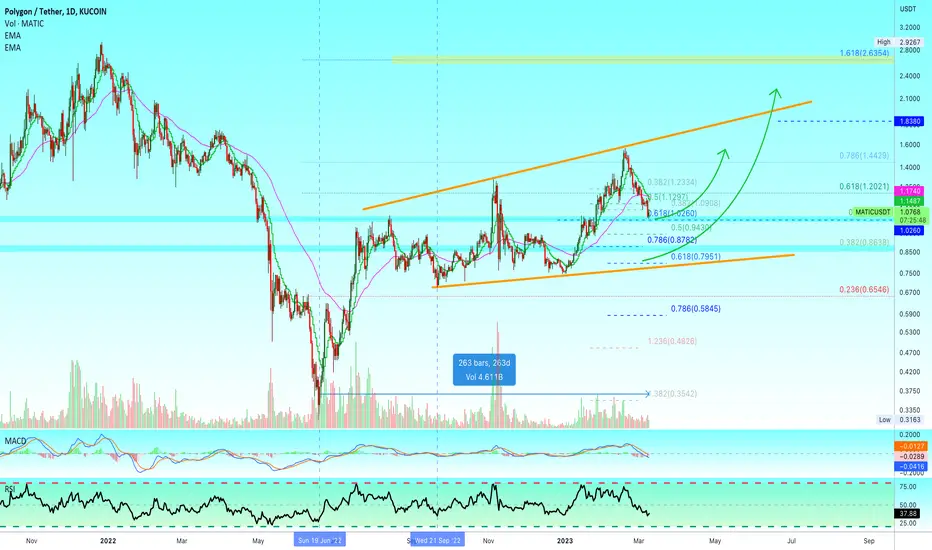
✴️ Polygon (MATIC) End Of The Correction?It is hard to call the end of a correction but why?
The bots adapt life to everything we do, everything we comment, everything we write, everything we share.
The correction can be due to be over now but if a large influx of money enters the market, the exchanges bots will "readjust" and dump on all of us rather than let the market flow.
No worries. The majority is in denial and it is hard to spot the end of a correction after all... Again, why?
Because there are multiple levels that are relevant for a correction to end.
Here we have the 0.618 Fib. retracement level short-term activated, below 0.382 Fib. retracement for the full bullish wave (since June) and lastly, the 0.5 Fib. extension level for this same wave as well.
The correction can end here when we look at the volume and the indicators, they already moved down strong enough but, if prices where to continue lower, the 0.8600 to 0.8900 price range is the next strong support.
It doesn't matter if the correction will end now or within a few days more... The bullish potential is really strong, Polygon has been growing since its June 2022 low.
✔️ 263 Days of higher highs and higher lows or almost 9 months.
✔️ The bear market ended in June 2022 for MATICUSDT... True, the bear market ended long ago.
✔️ Adapt and change.
✔️ Think long-term.
Thanks a lot for your amazing and continued support.
Namaste.
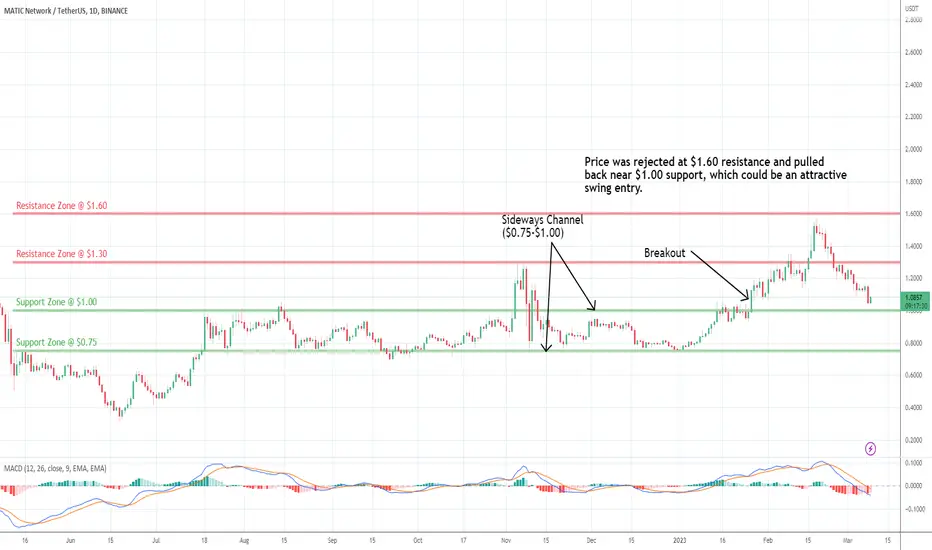
MATIC: Approaching SupportPolygon (MATIC) technical analysis:
Trade setup : Price was rejected at $1.60 resistance and pulled back near $1.00 support, which could be an attractive swing entry. Momentum is inflecting bullish again (MACD Histogram rising).
Trend : Downtrend on Short-Term basis, Neutral on Medium-Term basis and Uptrend on Long-Term basis.
Momentum is Bearish (MACD Line is below MACD Signal Line, and RSI is below 45).
Support and Resistance : Nearest Support Zone is $1.00, then $0.75. The nearest Resistance Zone is $1.30, then $1.60.