MATICUSD Non-Log Trend Line Drawing a trend line between two strong flag like structures
The first prior one popped off greatly, will we see something like this for the second flag structure?
Post to support my prior Analysis that got a few views the other day
MATICUSDT

MATIC The Scenario Is coming to Realisation💲💲MATIC The Scenario Is coming to Realisation
💲We have dropped into the support zone exactly as I predicted in my last post:
💲Is it time to go up?
💲Everything looks like it.
💲After falling to the support zone I set last time.
💲If we break through the nearest resistance zone and start a continuation of the increases.
💲The strongest resistance zone around 1.06 is within reach.
💲The scenario I'm playing out is a continuation of the increases to the levels of the strong support zone marked on the chart. I'm aware of the possibility of a correction at any time, this should be taken into account, If the outlook changes I will publish a post with an update, so I encourage you to actively follow the profile and read the description carefully.
💲*Please do not suggest the path I have outlined with lines it is only a hypothetical scenario.
🚀If you appreciate my work and effort put into this post then I encourage you to leave a like and give a follow on my profile.🚀

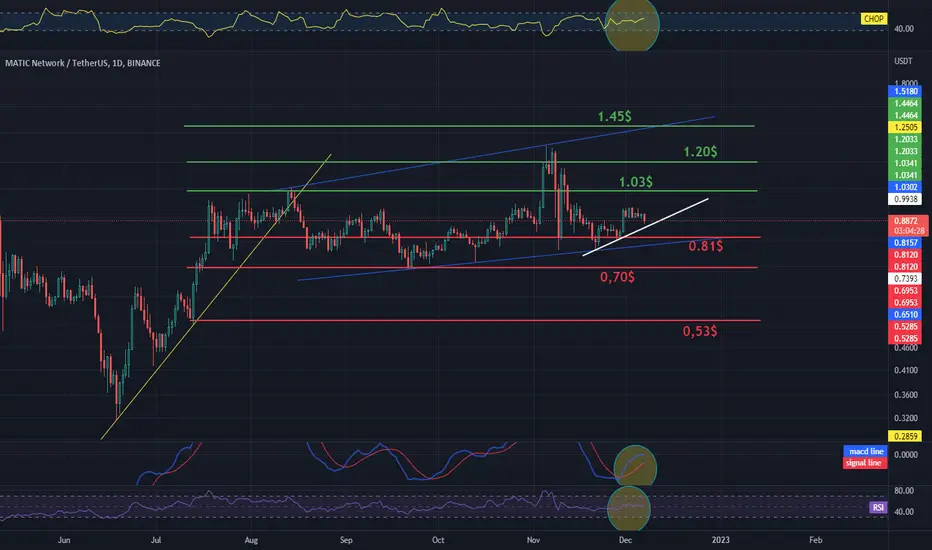
MATIC / USDT 1D chart Resistance and SupportHello everyone, let's look at the MATIC to USDT chart on a 1 day time frame. as you can see, the price, after a fairly large drop, started to return along the uptrend line and gave an increase of 227%, and then began to move in the sideways trend channel.
Now let's look at what supports MATIC has on its way and we see that we have the first support at $0.81, the second support at $0.70 and the third support at $0.53.
Looking the other way, we will check resistance points for the price that we should take into account in the longer term. The first resistance is at $1.03, the second at $1.20 and the third at $1.45.
It is also worth marking the local uptrend line above which the price is still holding.
As you can see, the CHOP index indicates that the energy is highly charged, the MACD indicates that we are in an uptrend, and the RSI shows that we are in the middle of the range, which may indicate a further sideways trend.
MATICUSDTHello Crypto Lovers,
Mars Signals team wishes you high profits.
This is a 4-hour-time frame analysis for MATICUSDT
Here we have R2 and R1 as our resistance areas which both contain the disability of the price to rise. And S1 and S2 are the support areas that represent the support of price since the past. Presently, we have the fluctuation of price over S1 and we predict two scenarios to happen. In case the price gives us some rising signs and let's say some confirmation candles in this regard, we would predict a rise for it up to R2 or higher. Also, if the price loses the support and falls below S1, then more decline is waiting for it. Bear in mind that we should wait for the price to leave the channel formed by R1 and S1 and then have a precise prediction.
Warning: This is just a suggestion and we do not guarantee profits. We advise you to analyze the chart before opening any positions.
Wish you luck

MATICUSD Repost (It Reminds Me) MATIC Definitely reminds me of an early Ethereum in many ways
This chart furthers that
Structure with labels 1,2,3 can be seen in early ETH chart
This structure is current on MATICUSD
Will we catch a 13000% move on MATICUSD? As was seen on ETH?

MATIC RANGE TRADEHey, MATIC simple range trade - let's see if we can hold this low and get some momentum the next couple of days. What do you think?

MATIC is in danger, it will DUMP hard!Hello, everyone!
Let’s continue to analyze the most dangerous altcoins which showed the greed during the bounce on the Bitcoin. Today it’s MATIC time. It now has the most dump potential. I suppose that the market maker created the fake growth on this altcoin to show other traders the illusion of the asset’s power. Of course it’s fake and MATIC is going to break or at least test it’s bottom at $0.33 and I will show you why. Let’s go!
Let’s take a look at the 1D time frame of the MATICUSDT of the WhiteBit exchange. The bottom at $0.33 was the end of the wave 3 as on the entire crypto market. The corrective wave 4 retraced this wave with the zigzag correction. Zigzag correction usually consists of wave A (5 waves), wave B (3 waves) and wave C(5 waves). You can see on the chart how perfectly the market structure for MATIC corresponds to this theory. One question you can have is why the wave 5 did not break the wave 3 top in the wave C. I can explain it because wave 5 could be trimmed. It’s OK for the altcoins.
Now the price is drawing the wave 5 and I suppose the the sub wave 3 of this wave is in progress. The minimal target for the wave 3 is the $0.61 – 1 Fibonacci extension level, but I think MATIC will hit $0.3 again because the 1.61 Fibonacci placed right here.
Best regards, Ivan
_______________________________________________________________________
Guys, if you like my analytics, please support me with your boosts and comments!

MATIC/USDT 1DAY UPDATE BY CRYPTO SANDERSHello, welcome to this MATIC/USDT 1DAY chart update by CRYPTO SANDERS.
I have tried to bring the best possible outcome to this chart.
CHART ANALYSIS:-Buyers controlled the price action in the past seven days when MATIC registered a 9.3% price increase. This uptrend is expected to continue, but the bulls will face strong resistance at $1, where the price was rejected before in the past.
The current support is found at $0.9078, and MATIC has always moved higher from that point in the past few months. This also places MATIC in a large range between $1 and $0.74.
Looking ahead, MATIC may attempt another break of the key resistance at $1, but it will be a tough ask. Sellers always came back at those price levels, and they could return again, which may push the price back below this psychological level.
This is not a piece of financial advice.
Hit the like button if you like it and share your charts in the comments section.
Thank you

MATICUSDTMatic is in a clear WYKOFF distribution pattern.
Currently at the LPSY.
Great short opportunity as this is likely the top of the relief rally.
We are the Last Point of Supply. Use the Uptrust after distribution as your stop loss.
Target 0.52 cents.
We also have divergence on RSI on the 4 hour.

Matic Possible Short OpportunityHi, there is a short trade possibility here for Matic ,
Matic suffers from low volume at this level
And there is a good Bearish RSI divergence too,
That it might suggest downside momentum from here.
Watch out for PMI and DXY reaction to it at this critical price .
*Do your own research and this is not a financial advice*

MATIC #MATICUSDT is going UP (UPTREND)it seems that MATIC/USDT is gaining steam at the moment at it is going up,
will wittness MATIC reaching levels of 1.02 by next SUNDAY
#stay_safe

MATIC BUY SETUPhi guys.
i have a idea for matic . i think From the green area, we can go up . Our trigger line is broken.

$BATUSDT UPDATE!!!!Hi Snipers,
Please refer to the recording for the next price levels and scenarios.
Thanks
MS


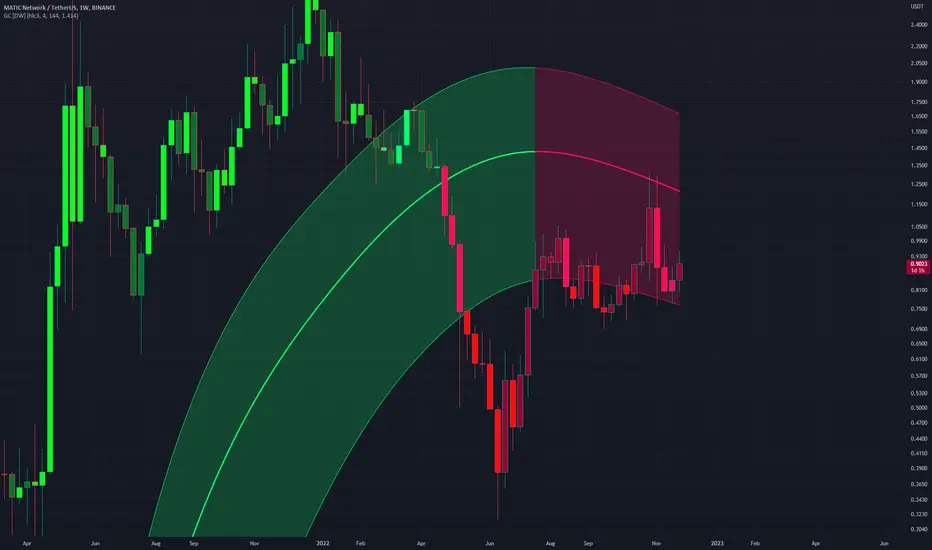
MATICUSD - Contained Within Channel MATICUSD on a Weekly timeframe
Price has moved up within the Gaussian Channel
Price will likely led to a breakout to the upside as this containment within channel continues and is seen as support
This can be seen as a bullflag on the Monthly, which I have linked below

InvestMate|MATIC Time for Growth💲💲MATIC Time for Growth
💲Matic has been looking very pro growth in recent weeks.
💲You can see that the fundamentals are working and pushing this cryptocurrency upwards
💲Over the 21 November low we have been making a sequence of increasingly higher lows which is very indicative of a developing uptrend
💲We can see that we are above the 50 and 200 moving averages.
💲The nearest support zone is the zone defined by the cluster of two fibo levels.
💲The first is the 0.236 level of the entire upward wave from the June bottom to the November peak. The second is the 0.886 level of the entire upward wave from the July 2021 bottom to ath.
💲The most significant line of resistance will be the zone defined by the cluster of as many as three levels.
💲The first is the 0.382 level of the entire upward wave from the bottom of September this year to the peak of November. The second is the level of the October peak and the third last is the level of 0.618 of the entire upward wave from the covid bottom to the May 2021 peak.
💲The scenario I am playing out is to wait for a strong breakout and join the uptrend to reach the resistance zone. I'm aware of the possibility of a correction at any time, this should be taken into account, If the outlook changes I will publish a post with an update, so I encourage you to actively follow the profile and read the description carefully.
💲*Please do not suggest the path I have outlined with lines it is only a hypothetical scenario.
🚀If you appreciate my work and effort put into this post then I encourage you to leave a like and give a follow on my profile.🚀

MATIC Double Bottom StructureDouble bottom will complete the structure.
It will be a great buying opportunity if this happens.
Good Luck and let's see what time brings.

Maticusdt Look at matic with
chart pattern
Weekly chart and wedge pattern
---------------------------------
This analysis is just my mental and personal idea
Please analyze before entering
Get approval first


Trading opportunity for MATICUSDTBased on technical factors there is a Buy position in :
📊 MATICUSDT
🔵 Buy Now 0.924
🧯 Stop loss 0.825
🏹 Target 1 1.067
🏹 Target 2 1.275
🏹 Target 3 1.530
💸RISK : 1%
We hope it is profitable for you ❤️
Please support our activity with your likes👍 and comments📝

MATIC aiming for $0.95, but it will struggleThere is a local resistance zone around the $0.95 mark, and after that we should see smooth sailing all the way up to $1.15.
Everything looks good, patterns look solid, and I think it's a good time to trade, but only for small profits.
My indicator is also signaling a long position, and my trade history along with profit can be seen in the history below (the history of trades are from February 2020, and have approximately 29,000% profit - in other words, $1,000 USD to $290,000 USD)
This is not financial advice, just a study.

MATIC Bullish Flag 🚩👇🚩👇🚩Hi dear traders
Price forming bullish flag 🏳. The pattern confirmed.
We can open short position now.
All targets specified
Let's see what happens
This is not financial advice ( DYOR )
Good luck
