MATIC update - Second stop hit Hello,
Congrats, we are up now to 21,656% in profit from 17, 771% the last time I posted. The proof for all my trades is below in this idea. Please scroll down to the trades section. This trade history starts from 2020-01
We have just touched the second take profit zone at $1.1 as I mentioned in my previous post. This is also triggering a sell signal on our indicator.
It is very oversold here, I expect the price to drop in order to reopen a trade, however, if it rises then I definitely expect a hard crash at $1.32
MATICUSDT

MATICUSDTMatic Long 15 mins
4 Hour Oscillators all over sold
Trend still bearish long term but bullish in short term

Next entry for Polygon (MATIC)I believe that price could temporarily break out of the triangle and make a bear trap at the 0.5 ~ 0.382 Fibonacci retracement.
The MATIC token is one of those that appreciated above average considering this bear market.
The DMI SMI indicator also signals this possible opportune moment to buy

MATICUSDTBull Flag formed
With Short Consolidation this could move up fast.
This is a quick 15 Mins Trade remember main Trend is still very bearish

Matic drops below 1With the bearish trend in bitcoin continues. Short Matic looks like an interesting trade to consider. Will be updating this in the coming days

MATIC Descending TRIANGLE 😎👇😎👇😎👇Hi dear traders
The price has formed a descending triangle.
After the climb, we see a deep correction.
I expect the price to reach the support area and then rise to the specified targets.
EMA20 plays the role of resistance.
Wait for confirmation to entery.
🎯0.9774
🎯1.0562
🎯1.1483
Let's see what happens
This is not financial advice ( DYOR )
Good luck

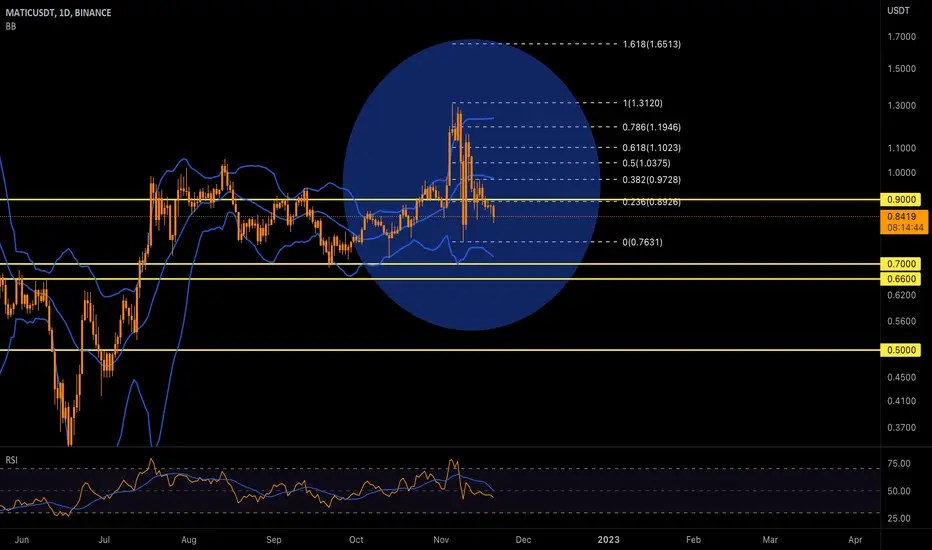
MATIC maintained its bearish momentum last week!MATIC maintained its bearish momentum last week and has returned to the $0.85 support zone after reacting to the $0.90 resistance. Support has been associated with a positive reaction several times and has prevented the price from falling further. But note that selling pressure is high in the market, and the possibility of breaking this support level is very high. Therefore, if the support area of $0.80 is broken, the price drop can continue at least to $0.66-0.70.
This range is the floor of the last upward wave and also the ceiling of the last downward wave in the past of the price and is related to the daily time frame. Therefore, it is considered an important supply and demand area. For this reason, it can have a positive reaction. But note that if selling pressure increases and this support is broken, with a pullback to this area, we can expect a heavier fall for MATIC to the $0.53 range. If you look at the weekly MATIC chart, you can see that if the daily supply and demand range is broken, the potential for forming a double ceiling pattern and confirming this pattern is very likely. In this case, the price reduction can even continue until close to the $0.50 range. Therefore, maintaining the $0.70 support area is very important for MATIC investors.
MATIC short-term growthAs you can see in the 4-hour $MATIC chart and looking at the current market situation, #MATIC seems to be ready for a short-term growth.
The indicator you see in the chart is the new version of the Fibodex Trap indicator, which is used privately. Message me to have it

MATICUSDTVolume was very weak on that triangle breakout.
Next Stop 0.78 as this is the next Major Support on the Daily
Stochastic looks weak too and clear evidence of distribution on 15 Mins time Frame

When Matic Polygon react 256$ i have opinion very crazy guys.. target 256$
Matic adoption increased beacause fee tx ceaper than ETH and BNB so many project from blockchain matic
and matic realease token unlock. this very good to buy and hold

MATIC - Will the price see a bounce?Here's a quick look at the Matic daily chart . As we can see, the price is currently oscillating within the bigger rising channel and is approaching the bottom. If the price bounces from the bottom of the rising channel , we may see a 50% rise to the top of the channel! But if the price breaks below the channel and doesn't manage to hold the support zone , then we may get down to 0.4$ or even lower! It all depends on the movement of BTC - If BTC goes south then MATIC is very likely to follow.
-------------------------------------------
What are triangles when it comes to trading?
Key points:
"1. In technical analysis , a triangle is a continuation pattern on a chart that forms a triangle-like shape.
2. Triangles are similar to wedges and pennants and can be either a continuation pattern if validated or a powerful reversal pattern, in the event of failure.
3. three potential triangle variations can develop as price action carves out a holding pattern, namely ascending, descending, and symmetrical triangles."
-------------------------------------------
If you like the content, then make sure to comment and like the post :D
Follow me for daily profitable trading setups
BTC dictates the market. If BTC falls, then Alts will fall as well. Trade safe!

$CHZUSDT UPDATE!!!Hi Snipers,
Please refer to the recording for the next price levels and scenarios.
Thanks
MS


Matic buy setup 0.4-0.35Matic currently has a buy set up with 1 sell side Liquidity to run before some good relief in price
In coming months im looking at going long on $matic

MATICUSDTPossible end of cycle Targets for Matic.
Don't really see it reaching my second target but may as well have some orders on their any way is my view.
My Guess is the Crypto Market should bottom before the stock Market so this final capitulation should play out in 3 weeks.

MATİC SHORT IDEAyou see the wedge on chart for matic. and also 15 min there is a positive mismatch for rsi.
entry 0.88983
stop 0,8736
take profit around 0,9250
this is my own idea its not financial advice. i hope its usefull for ya!
(i opened pos at the point 0.8893 already )
