airtel likely to go upas we can see there was a up trend and now the stock is taking breather for next run so it would be a good opportunity to trade
....
consult your advisor before taking position
MCX

MCX can hit 1500If MCX closes strong today it may be set for 1500 soon. Shouldn't trade below 1100.
Disc: Invested.

Zinc Mcx Short at 154.5 with SL 157.3We are doing Analysis of ZINC MCX on 1 Hour Timeframe.
The projected target from the breakout is usually the vertical distance from the high to the bottom .
Note: This is only for Educational Purpose this is not an Investment advice.
Please support the setup with your likes, comments and by following on Trading View.
Thankyou
Ankur Verma
Twitter : Ankurverma3838

CrudeOil Mcx Short at 2450 with SL 2630We are doing Analysis of CrudeOil MCX on 1 Hour Timeframe.
The projected target from the breakout is usually the vertical distance from the high to the bottom .
Note: This is only for Educational Purpose this is not an Investment advice.
Please support the setup with your likes, comments and by following on Trading View.
Thankyou
Ankur Verma
Twitter : Ankurverma3838

Silver Mcx Short At 47700 with SL 49000We are doing Analysis of SILVER MCX on 1 Hour Timeframe.
The projected target from the breakout is usually the vertical distance from the high to the bottom .
Note: This is only for Educational Purpose this is not an Investment advice.
Please support the setup with your likes, comments and by following on Trading View.
Thankyou
Ankur Verma
Twitter : Ankurverma3838

M- Pattern on Crudeoil and Resistance on DailyCrudeoil is facing resistance on daily front and a buildup of M- Pattern. A near downfall could end up making the daily candle as a Doji.


LEAD intraday for 18th MayLong and short levels for intraday shown...strict sl of .45 points for each entry.

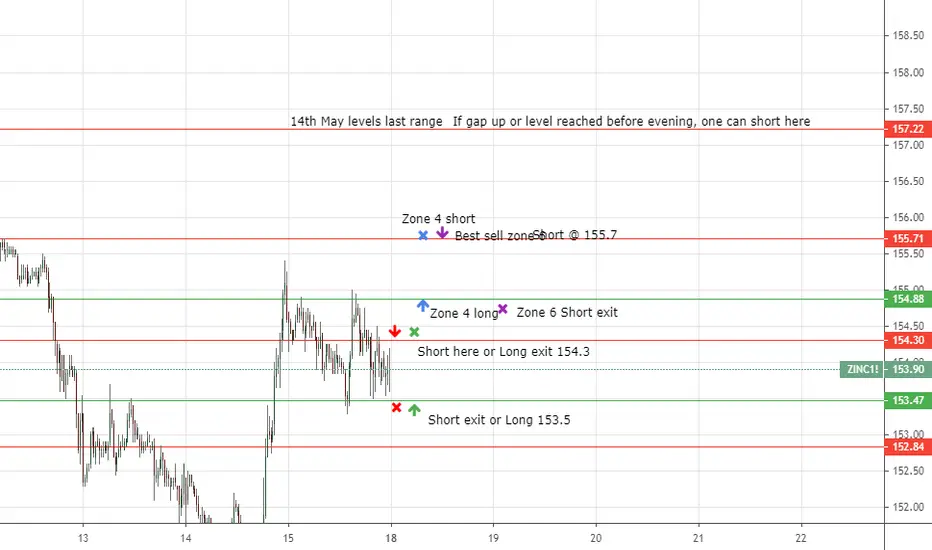
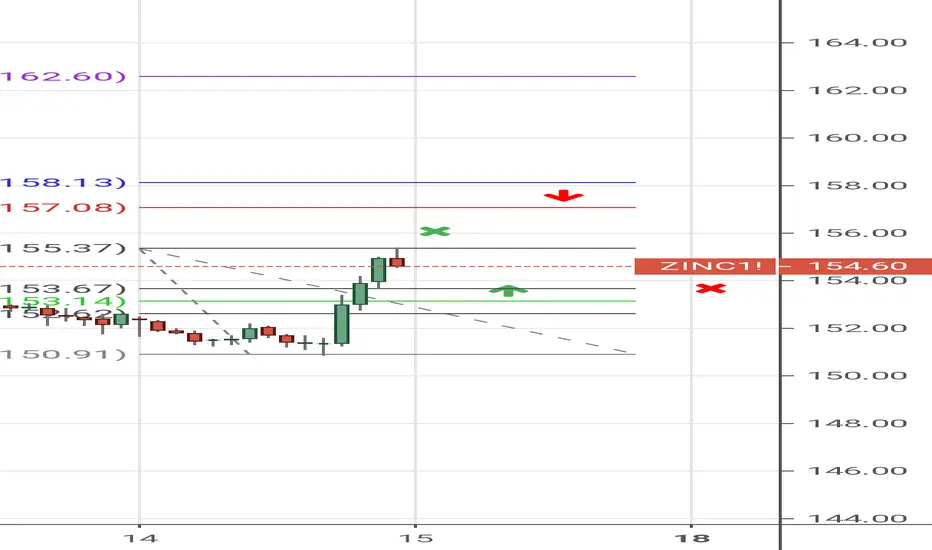
Intraday strategy for ZINc on 15th mayIf price opens around 153 levels buy @153.8 for tgt 156.25. if price already at 156+ levels short at 157.5 ...for final tgt 153.8
Intraday strategy for leadIf price opens around 130 levels it should respect 14th May Trend and one can long around 130.2 for target 131.3...sl 129.5...if price already reached 132 in mrng it's a good zone to sell as it completes last night's uptrend and good to short at 132...ultimate target 128.4...if price starts at 131.2 wait to see if price it is a good to short zone as well...
Entries would be from
Long 130.2 tgt 131.2
Short 132 tgt 130.2 , 128.4
Short 131.2 tgt 130.2 , 128.4
Short 129.4 tgt 128.4


