MCX - Bullish H&S formation, Short Term Swing TradeThe above analysis is based purely on price action & chart patterns.
The analysis is done on 60 min TF, hence it may take price to reach the targets in few days to few weeks.
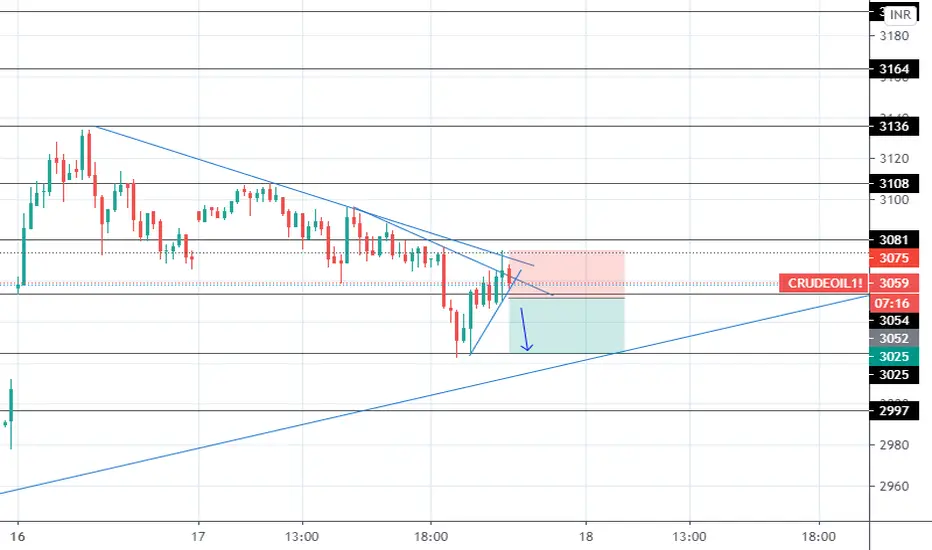
Trade setup along with Entry levels + SL & Targets are given in image itself.
Traders must do their own study before entering into any trade. They must trade with their own money & risk management.
Feel Free to comment for any suggestion or query regarding price action analysis.
Checkout my other ideas/charts to understand how chart pattern & price action works.
MCX


Aluminium Metal, looking hot above 163Aluminium testing previous breakdown, a close above 163 can result in good upward move !!

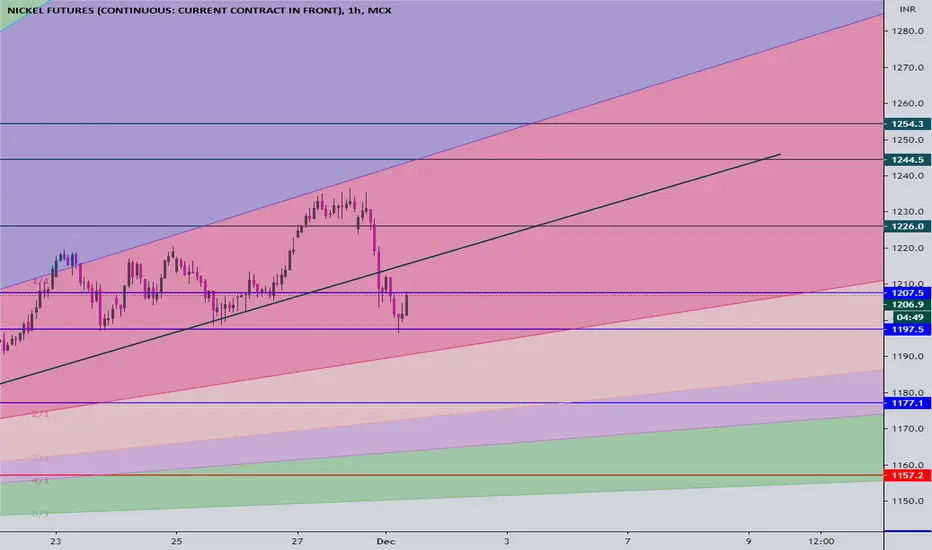
Day Sell#MCX @Nickel Little Targets 1206/1204
Main Stop Loss at 1,212 only.
Disclaimer: I just shared my view. Please trade with your own and comfortable ideas.
Silver Mini Buy / Sell based on FIBO and GANNBuy silver mini 60970 CMP 61110 Stop loss 60700 Target 62600

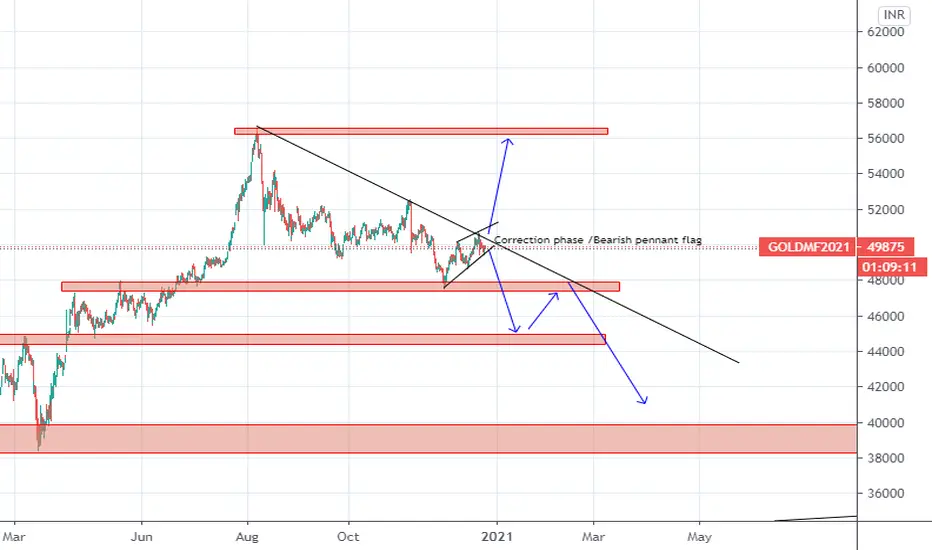
Gold Mini Future - MCX IndiaGold is at an important support level. A correction may take it down till the arc, where its a good investment opportunity to go long.
Comments and views are welcome.


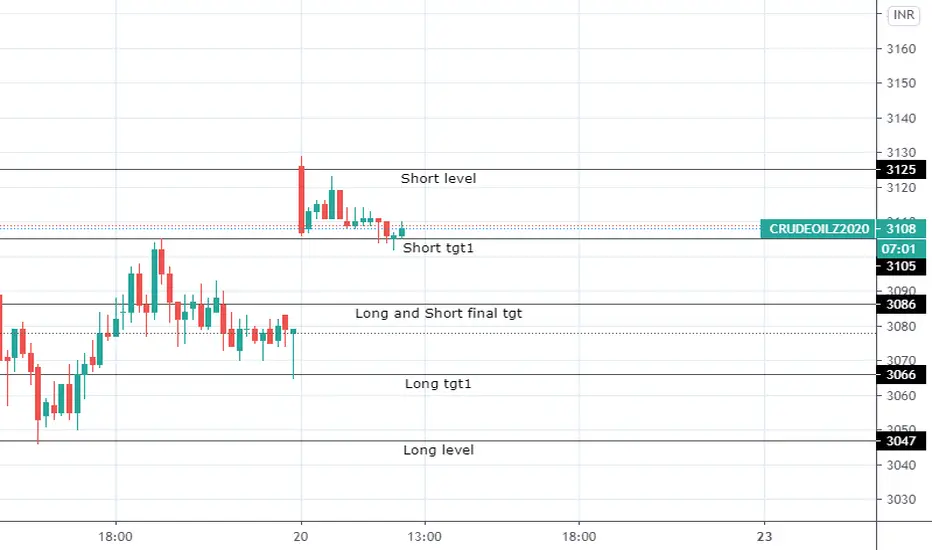
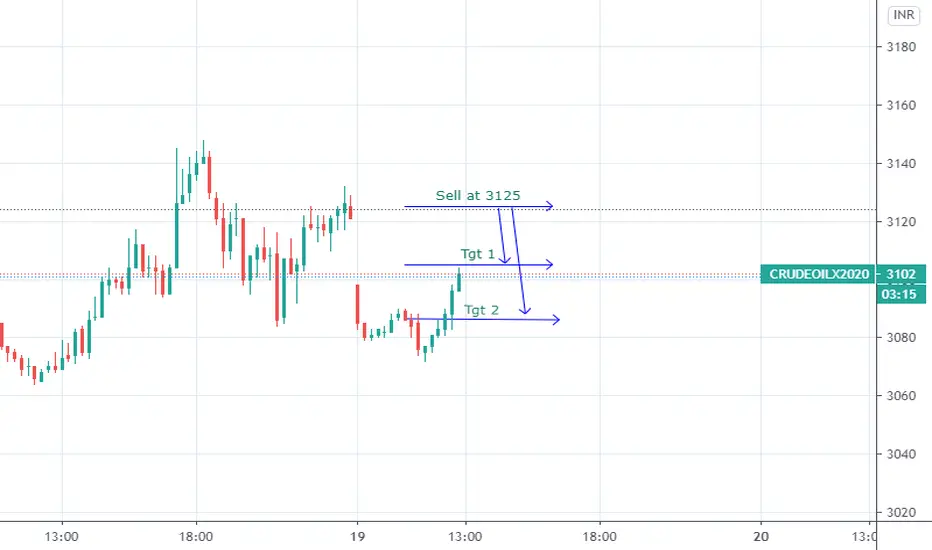
CRUDEOIL intradayLong and short levels shown with targets..Short level tgt 1 already hit with 20 pts gain...can re-enter again if triggers..
SL at your own risk..
NATURALGAS intraday set upShort and long levels shown with targets...SL upto your risk management....
Disclaimer: Trade at your own risk. I am not responsible in anyway for your profits/losses.

Natural Gas weekly analysis Hey ,
the natural gas trend has been changed and the script is bullish at the current market scenario. There is a good position in the swing long.
Long: 209
Stop loss: 180
Target: 254
Time frame: 4-8 weeks

Start shortTargets 1182/1170
Main stop Loss at 1221
Disclaimer : Please trade with your own and comfortable views. I just share my view.


MCX Gold Price Trend Analysis & TipsGold is performing in the parallel channel from 22 Sep. Recently, the moving average has tried to crossover but failed. And volume spike is a direct sign of an uptrend. It's sharply moving forward.
As I updated on Oct 19, gold is trying to climb upward after hitting the parallel channel. And if it remains in the parallel channel, we may see 51000 - 51500+ levels... And for the day traders, 5 0960 - 51130 - 51260+ levels.
Please note parallel channel breakdown is not the best place for a short. A better place for shorts is the hurdle line.
Here I have used ADX to identify the trend strength. Gold's ADX < 25 means the uptrend is weak.
What will happen after a breakout of a parallel channel and hurdles? I will update it in my next update of Gold.
If this idea is helpful to you, please leave a comment below and press the like.

Crude intradayShort below 2985, tgt 2967 sl 3002
Long above 3019, tgt 3037-3054 sl 3002
Short below 2881, tgt 2863-2846 2898
Long above 2915, tgt 2933 sl 2898

