MDABTC

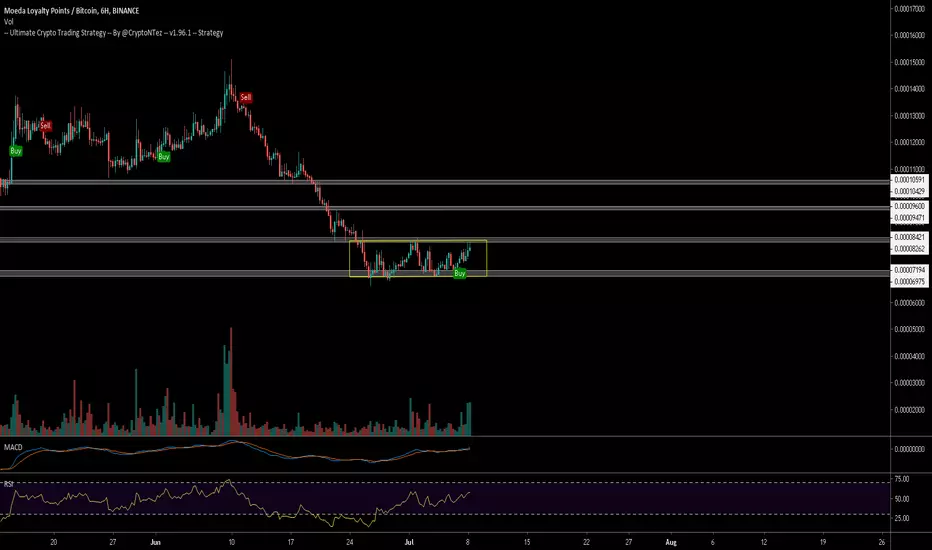
$MDA, Retesting just crossed level at ~8200 sats$MDA
Retesting just crossed level at ~8200 sats with help of bitcoin pushing up...
If it manages to hold here & keep pushing up then R/S Flip with potential target at ~9600 sats
Both EMA50/200 close to current price activity
UCTS indicator showing a Buy signal on the 12H
#MDA

#MDA Looks Like Preparing The Big Jump?! 450 %MDA Lately Been Showing Huge Accumulating Big Whales Creating Big Buy Walls Accumulating #MDA
Buy : 8200
Sell : I Suggest 50 % UP TO 200 % With Tight StopLoss


MDABTC extended bear leg and formed Shark | Upto 67% expectedPriceline of Moeda Loyalty Points / Bitcoin cryptocurrency has extended the bear leg and formed a bullish Shark pattern and entered in potential reversal zone.
This PRZ area should be used as stop loss in case of complete candle stick closes below this zone.
We have 200 simple moving average support just below the potential reversal zone.
Volume profile is showing less interest of traders at PRZ level and MACD is turned weak bearish from strong bearish and Stochastic is likely to give bull cross very soon from oversold zone.
I have used Fibonacci sequence to set the targets:
Buy between: 0.00009711 to 0.00008429
Sell between: 0.00011177 to 0.00014083
Regards,
Atif Akbar (moon333)


MDABTC forming bullish Cypher Upto 40% expectedPriceline of Moeda Loyalty Points / Bictoin cryptocurrency if forming a bullish Cypher pattern and soon it will be entered in potential reversal zone.
This PRZ area should be used as stop loss.
We have a 100 simple moving average support beneath the PRZ area.
I have used Fibonacci sequence to set the targets:
Buy between: 0.00011792 to 0.00010623
Sell between: 0.00012713 to 0.00014924
Regards,
Atif Akbar (moon333)

MDABTC forming bullish Shark | A buying opportunityThe priceline of Moeda Loyalty Points Moeda Loyalty Points (MDA) / Bitcoin is forming a bullish Shark pattern and entered in potential reversal zone to hit the sell targets soon insha Allah.
This PRZ area should be used as stop loss in case of complete candle stick closes below this area.
I have used Fibonacci sequence to set the targets:
Buy between: 0.00012866 to 0.00012731
Sell between: 0.00012983 to 0.00013249
Regards,
Atif Akbar (moon333)

Moeda Is Aiming At 50%+, Up to 100% - 270% + Mid-TermIt seems that this pair, MDABTC, only wants to continue growing.
gartley pattern has completed and the main target is TP3(270%).
Looking at the weekly timeframe , we can see strong resistance ahead... If this resistance can be broken, the dashed magenta line, we can expect Moeda to grow big fast.
Moving and closing below this resistance would only signal additional consolidation time with the chart remaining bullish . Only if the last low is broken will MDABTC become bearish .
Let's how it plays.
Best Regards.


Moeda Loyalty Points Is Giving Me SignalsThe MDABTC chart is giving me some signals that caught my attention, it was pretty interesting because of the timing.
In the past, I've noticed MDABTC reacting inverse to Bitcoin, no big deal, but just one of the many details that I tend to notice while being.
Today I saw MDABTC jump right when Bitcoin moved lower:
And also noticed that it moved higher back in early September, at the same time that Bitcoin was breaking below support.
The daily price is now above EMA10. Needs daily close for confirmation.
We have a series of higher lows.
The Sept.06-11 move can be seen as accumulation.
The RSI remains strong.
There is the possibility of Moeda Loyalty Points (MDABTC) moving up strong next... This is just a probability, so be prepared with a full strategy if you decide to trade.
This is Alan Masters.
Thanks a lot for reading.
Namaste.

Buy # MDABTCBuy # MDABTC
7 Days Swing Trade
7100-7200 Entry Zone 1
7650-7825 Target for Entry Zone 1
6200-6375 Entry Zone 2
7100-7200 Target 1 for Entry Zone 2
7650-7825 Target 2 for Entry Zone 3
5875-6025 Entry Zone 3
Targets for Entry Zone 3 Same as Entry Zone 2 Targets
No Stop Loss, Close the Trade around breakeven if Trend Breaks down
Medium Risk
Valid Until September 18th

Moeda Loyalty Points Higher Low, Can Grow More!Moeda Loyalty Points (MDABTC) just printed a higher low and can easily start to climb up from here.
We are likely to see slow steady growth mixed with some short bursts that can grow quickly to then retrace and hit new higher lows...
We will see how this all goes, right now we believe based on the chart that MDABTC will go higher.
Thanks a lot for reading.
Namaste.

mdabtc binance 1D mid termI think there should be three options for development. less possible painted translucent.
a more likely event is a decrease in price to 5500 - 5350 in this corridor I made a purchase. stop-loss is set as on the chart 4975 (-8%) (But you need to monitor events, you may need to move the stop loss higher.)
target 1 set 6950 (+28%) (full sale possible)
???~target 2 set 8850 - 9100 (+64%) (maybe not)~???

MDABTC has formed bullish BAT pattern | Upto 408% possibilityPriceline of Moeda Loyalty / Bitcoin Cryptocurrency has formed bullish BAT pattern.
The A to B leg was retraced almost 0.50 Fibonacci and also gave a spike upto almost 0.618 so here the MDA had only two choices whether to form a bullish gartlay and make a D leg upto 0.786 fibonacci or to form bullish BAT pattern and form a D leg upto 0.886 Fibonacci.
(I don't think so it will go for bullish butterfly the reasons I have below)
In previous chart I was expecting a gartley therefore I published a gartley's chart but now the D leg is retraced upto 0.886 Fibonacci so now the bullish BAT pattern is confirmed insha Allah.
Now the D leg is entered in potential reversal zone.
RSI is entered in oversold zone.
Volume profile is showing weak interest of traders here.
MACD upto 2 week chart is turning bullish:
Upto 2 week chart stochastic has given bull cross:
Soon the MACD and Stochastic will be turned bullish on month chart.
I am expecting that the next candle stick will be closed sideways within this potential reversal zone therefore if we want to enter in safe and sound then we can wait for next candle stick.
I have used Fibonacci sequence to set the targets as below:
Buy between: 0.00006993 to 0.00011085
Sell between: 0.00020861 to 0.00035528
Enjoy your profits and regards,
Atif Akbar (moon333)

Moeda Loyalty Points Will Start To Move (Friendly Reminder)This is a friendly reminder to all of our readers, supporters and amazing followers... Moeda Loyalty Points (MDABTC) will start to move soon.
Notice the candlestick circled in blue, this is a "shakeout" candle and is intended to remove wick hands as well as activate stop-loss.
This coming up at the bottom of a trend can work as a signal for change that is about to come.
There is also strong bullish divergence on the RSI and MACD.
MACD (Moving up since May):
RSI (Moving up since May):
We also have a falling wedge pattern... Remember to use a stop-loss if you decide to trade.
This is a friendly reminder.
Expect MDABTC to go bullish within the next 2 weeks.
This is Alan Masters.
Thanks a lot for reading.
Namaste.

MDA/BTC LongSignal
MDA/BTC
BUY
Open 5839;
SL 5702;
TP 6553;
Risk/Reward: 1/
If you look at the candles and obv, then there is an accumulation.

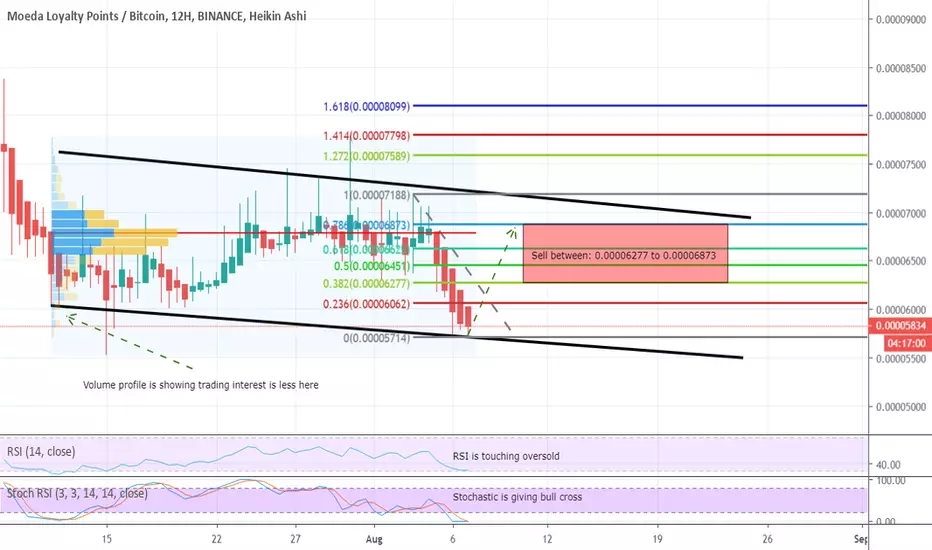
MDA turning bullish at the support of down channelPriceline of Moeda Loyalty Points / Bitcoin is moving within a down channel.
RSI is almost oversold.
Stochastic is giving bull cross.
Volume profile is showing trading interest is less here.
I have set the sell targets using Fibonacci sequence and the sell targets as below:
Sell between: 0.00006277 to 0.00006873
Regards,
Atif Akbar (moon333)
Catching Moeda Loyalty Points Next Wave (600%+ PProfits)Moeda Loyalty Points (MDA) Overview
What is Moeda?
Moeda was launched in 2017 at a United Nations “hackathon” in order to address the 17 UN Sustainable Development Goals. We selected the Seed Projects and facilitate access to financing for entrepreneurs with impact projects who have traditionally found it difficult to access credit through the traditional banking system. They can thus grow and allow their communities to develop. Through blockchain technology and our proprietary digital tokens (MDA, MDABRL), people around the world can promptly and transparently invest in the projects, all the while participating in sustainable growth. Everyone wins.
Moeda Loyalty Points (MDABTC) Chart Signals
We are going to catch Moeda Loyalty Points next wave and aim for more than 600% of profits…
We are now seeing an increase in trading volume if you look to the far right of the chart.
Both the MACD and RSI are moving up.
The August ’18 low/support was hit. Last time this support was hit MDABTC had a bull run.
We can expect action soon with some short-term targets to be hit and massive bullish action on or after September 2019.
Enjoyed this content?
Make sure to hit like and follow to show your support.
Namaste.

MDABTC Moeda Loyalty Points LONGBUY zone: ~ 6000-6300
STOP LOSS: 5650 (-8%-10%)
SELL 1 : ~ 6900 (+11%)
SELL 2 : ~ 7777-7878 (+28%)
(???sell3~97000-101000 (+68%)???)

MDA A GREAT BUYING OPTION RIGHT NOWBUY REGION IN GREEN
SELL TARGET IN RED
STOP LOSS IN YELLOW
BE SAFE IN YOUR TRADING
SET YOUR STOP LOSS
LET IT RIDE
We do live trading on youtube every single day where Scalping bitcoin on a smaller time frame as well as looking at the current trend on the higher time frames.
However upon any charts request we will be looking at the them accordingly
Each Day we are live on youtube at 9AM EDT so please feel free to join the telegram group and learn together from the technique I used.
A few Things about the methods of Trading
No Indicators are Used except for VWAP and sometimes VPSV but that is pretty much it
The only thing that is used is only support and resistance
so Come and Join and feel Free to Ask any questions.
==> TeleGram Chat channel t.me
==> Telegram Trade Channel t.me
GOODLUCK :)

$MDA, testing the resistance at 8400sats as volume is increasing$MDA / $BTC,
Has been bouncing in a thight range for around a week, currently testing the resistance at 8400sats as volume is increasing
If manage to break above it, 9.5k / 10.5k as targets
UCTS Buy signal on the 6H
Wait for confirmation of breakout prior taking action.
#MDA