The Yen can bounceThe breakout within last two weeks has seen the yen made higher higher, before reversing downward over the past two days at a key horizontal, Fibonacci and trendline resistance level. The Yen form double tops before reversing. Today, the Yen has bounce off the support of a rising channel, which supports the Intermediate Daily trend, and Primary 4-Hour trend. Using Mean Reversion Strategy, the Yen forms a market structure low inside a regression channel, likely to back to the top, with the first take profit at the middle of the channel. The Support is a strong support, and the reversal candle stick has made an impulsive move over the last hour, signaling a rally in sight
Meanreversion


Mean-Reversion Counter-Trend Setup for QQQA relatively simple mean-reversion setup developed on QQQ today. We had a gap-and-go break last week's high on decreasing volume, creating bearish divergence on the cumulative volume percentage indicator. Maxx Momentum failing the 6 ema test on a parabolic-up (unsustainable move) triggers the entry. There may still be a day or two worth of shorts to squeeze out before this reverts to the mean, but there's a good chance we see a significant pullback before ATH's are breached. With Volatility getting crushed by mid-day today, puts a few weeks out were had for cheap at HOD. returning to the 15 period mean price on the 78 min chart within the week is most likely outcome, paying approximately 50% of the premium price. Would sell a close above ATH for about a 50% loss if it occurs before 2/8. The way I see it, this trade will pan out quickly either way, making long-puts the ideal way to play it. If we get a significant gap-down, I'd target fib retracements from last Friday's low with a stop at the exp b/e price around 321.

Altcoin market cap about to correct? Watch 420B level...Tradingview data on market caps can become wonky at times but assuming these are accurate, I have 420B as a key level to maybe start off alt season 2021. We are looking good so far but we may also be due for a mean reversion move (i.e. correction to the average price). If you look at the preceding trend (here using the 3 day chart), price do not really stray far from the EMA(10) and right now market has been trading above the EMA(10) for 3 candles already without touching it.
We might see the market go sideways (into a trading range) for a few days until it converges with the average or we could see a more pronounced correction (breaking below 420B level) soon targeting the average.
It's also possible that the market just breaks resistance (475B) right away without reverting to the mean but that is just not sustainable IMO (based on data at hand).
Note: not trading advice.

SQ Top Of Channel Resistance Bounce - Going ShortUsing RSI and the upper/lower channel bounds for SQ indicates a pullback occurring in the near future , my timeframe is 1-2 weeks. SQ is not going to maintain these elevated levels for long, and will soon revert to the mean.

audusd - Sell time ? over heated ?With the RBA pumping more cash into the system (as with the rest of the world) and the USA finally moving on from a dramatic election/change of government, its interesting to see this charts starting to look more n more bearish - IMO
4hr chart
A: crossing of 50MA below the 200 MA's, and price action firmly below all 3 MAs - Bearish sign
B: 0.76 S+R & Fib-1 76% are close, making a bit of a zone. PA a bit sideways in here, recent break under 76% looking to retest now as a resistance level - bearish
C: down trend on MACD peaks, swing from bullish to bearish coloring - Slightly bearish
Daily chart
Has risen way off the 200MA's, has formed a top near the 123% Fib-2 extension, and trending sideways since consolidating down towards the 0.76 S+R
There is a Risk here that this support will hold on the Daily
However, im thinking we may see a pull back towards the Golden Ratio of Fib-1 around 0.75 mark which is why I'm looking to go short around 0.7617 for the potential swing down to 0.75
Fibonacci Reference dates
Fib-1 - 02/11/20 - 07/01/21
Fib-2 - 19/03/20 - 01/09/20

EURUSD 1D MEAN REVERSION TRADING STRATEGYBest Mean Reversion Strategy:
Before we get to that point, first and foremost, let’s see what tools we need to use for this strategy.
The best mean reversion indicator that works 85% of the time is the RSI indicator.
So, you will need the RSI oscillator on your charts.
Now, there is one more important thing that needs to be done. The RSI settings must be changed from the default 14-period to 2-period RSI. So, we’re having not just any type of RSI, but a very fast RSI. Levels are 10 & 90.
The other technical indicators we’re going to deploy on the charts are:
10-period simple moving average.
200-period moving average.
Note* Another thing to keep in mind is the recommended time frame is the daily chart. Intraday charts won’t work because the fast-period RSI will generate a lot of false signals on lower time frames.
Now, let’s see how we can combine the 3 indicators into a profitable mean reversion strategy.
The first obvious question is when to buy and sell currency.
To answer this question the mean reversion trading strategy needs to satisfy 3 triggers:
The price needs to be above the 200-day EMA. This means that the overall price is in an uptrend so, we’re only going to look for buy signals in bull markets.
Second, we look for the price to below the 10-day SMA, which shows a deviation from its mean.
Last but not least, we look at the RSI to overshoot below 10, which signals that we’re in oversold territory.
Note* For sell signals use the same trading rules but in reverse.
Once all 3 conditions are satisfied we enter a trade at the open of the following day.
Once we’re in a trade we also need, we also need to know when to exit the market. This is where the 10-period simple moving average comes into play again. What we’re looking for is for the price to reverse back to the 10-period SMA strategy.
More often than not the price will overshoot to the upside and break above the 10-period SMA.
So, to fully capitalize on the entire move we use multiple take profit targets:
The first profit target is to cash half of the position once we touch the 10-period SMA.
The second portion of your position is left until we break and close above the 10-period SMA.
Based on our backtesting result, on average your trades should reach the second target within 1-3 days. The longer you keep your position open, the lower the chances of the trade to succeed. As a general rule, you should cash out of your entire position within the first 3 trading days.
Now, we have left out for last the most important part, which is managing risk.
When it comes to the protective stop loss we’re advising not to place a stop loss right away, but instead, use a time stop.
Let me explain…
Based on our backtesting results we have found that a lot of the times the market will do a false breakout below the previous day low (high) and hurt our position.
So, to avoid this scenario we have found a great trick to move around it.
Our rule is very simple:
If by the first half of the day our position shows a loss, we close that trade and call it a day.
This is a risky play but we have the edge on our side to play this kind of trick. After all, trading is a risky game and everyone needs to decide for themselves how to manage risk.
Final Words – Best Mean Reversion Strategy
In summary, the most alluring thing about mean reversion trading is the high win-loss ratio and the simplicity behind it. One thing to keep in mind is that the mean reversion strategy tends to perform poorly when the market is in a hard-mode trend. But that shouldn’t be much of a big deal since the market is ranging 75% of the time.
The key takeaways from the mean reversion trading strategy are as follow:
Mean reversion can be used with all asset classes (stocks, commodities, currencies or cryptocurrencies).
Range trading and overbought/oversold signals work the best with this method.
Adjust the RSI settings to a fast-period.
You can generate quick profits – short holding time periods.
A trading tip – use a time stop instead of a price stop.
Thank you for reading!
Mean Reversion Trading Strategy with a Sneaky Secret.
In this guide, you’ll learn a mean reversion trading strategy with some trading secrets that will assist you to limit the downside. The first part of the guide will highlight what is mean reversion trading, while in the second part we’ll reveal the mean reversion strategy and how you can fine-tune it to fit your personality.
If this is your first time on our website, our team at Trading Strategy Guides welcomes you. Make sure you hit the subscribe button, so you get your Free Trading Strategy every week directly into your email box.
The mean reversion trading systems are more appealing to a lot of traders because it tends to have a higher win rate as opposed to the trend following strategies. Even when the markets are in well-established trends, mean reversion happens quite often.
So, there are more opportunities to profit from mean reversion trading.
Let’s kick the ball rolling and start with the basic by first explaining what is mean reversion in trading and then we’re going to reveal 5 trading principles that can be used with the mean reversion strategy.
Table of Contents
1 What is Mean Reversion Trading?
2 How Mean Reversion Trading Works?
3 Why the Mean Reversion Strategy Works?
4 Mean Reversion Trading Strategy
5 Final Words – Best Mean Reversion Strategy
What is Mean Reversion Trading?
Put it simply; mean reversion trading assumes that over time the prices of any asset (stock, commodity, FX currency or cryptocurrency) in time will revert back to the mean or average price.
In other words, reversion to the mean trading comes down to the old saying:
“What goes up must come down.”
The mean reversion theory is at the foundation of many trading strategies that involve buying and selling of those asset class prices that have deviated from their historical averages. The idea is that in the long-term prices will return back to their previous average prices and normal pattern.
Example of mean reversion trading strategies includes:
Reversals.
Pullback trading.
Retracement.
Range trading system.
Overbought and oversold strategies.
Our best mean reversion strategy is to trade those price ranges that occur after a severe price markup or markdown. In this case, reversion to the mean implies trading around the middle of the range as our average price.
In essence, mean reversion is playing around a central value be it the middle of the range, or a moving average, or however you wish to express it.
The reversion to mean trading system tends to produce a higher win rate in those instances where we can notice extreme changes in the price.
We can measure extreme price changes relative to the time frame used.
Obviously, there is also a probability that the price will not revert back to its mean. This can indicate that there is a real shift in the market sentiment and we’re in a new paradigm.
Now that we know what is mean reversion trading, let’s see how the mean reversion regression works.
How Mean Reversion Trading Works?
With mean reversion, we’re looking to trade against the heard.
A lot of the times when you’re doing mean reversion trading, you’ll be quick in-and-out of a trade. That’s why day trading mean reversion strategy works better.
There are other different ways to trade with the mean reversion strategy, including:
Price stretch from a simple moving average strategy.
A break outside the Bollinger Bands strategy and a return back to the mean.
A test of support and resistance strategy while the price is consolidating.
The linear regression is clearly slopping upwards and it’s acting as a magnet to the price. Each time the price deviates from the average price line it snaps back to it outlining the reversion to the mean concept.
The main advantages of the mean reversion strategy include:
Effective exit strategy – the take profit target is always the average price.
High win rate – the shorter the mean reversion time frame used the higher the win rate.
Good risk-adjusted returns.
All trading strategies have their own pros and cons.
The biggest flaw is that once you’re in a trade you’ll often see first a loss before you see a profit.
The main components of the mean reversion strategy should include:
1. Entry signal after the price has moved away from its average price. You can simply calculate how far away percentage-wise are from the mean or use an ATR strategy multiple declines or simply use a volume oscillator to gauge oversold/overbought readings.
2. Exit signal gives you a way out once you get into a trade.
3. Broad market timing.
Why the Mean Reversion Strategy Works?
Mean reversion is a key element part of how all financial markets work.
Mean reversion happens because the prices have a tendency to overshoot and undershoot their intrinsic value. These “price anomalies” happens because the impact of new information that hits the market takes time to be digested by the market.
The market participants will take some time to understand the new information as the information is filtered slowly. Additionally, it takes time for the market to establish a fair value.
Secondly, mean reversion trading also works because prices also move based on collective emotions.
What this means for traders is that the price tends to overshoot to the downside a bit more than they overshoot to the upside. This is true because fear tends to be a bigger emotion than greed.
Let’s put the puzzle pieces together and construct our reversion to the mean trading strategy.

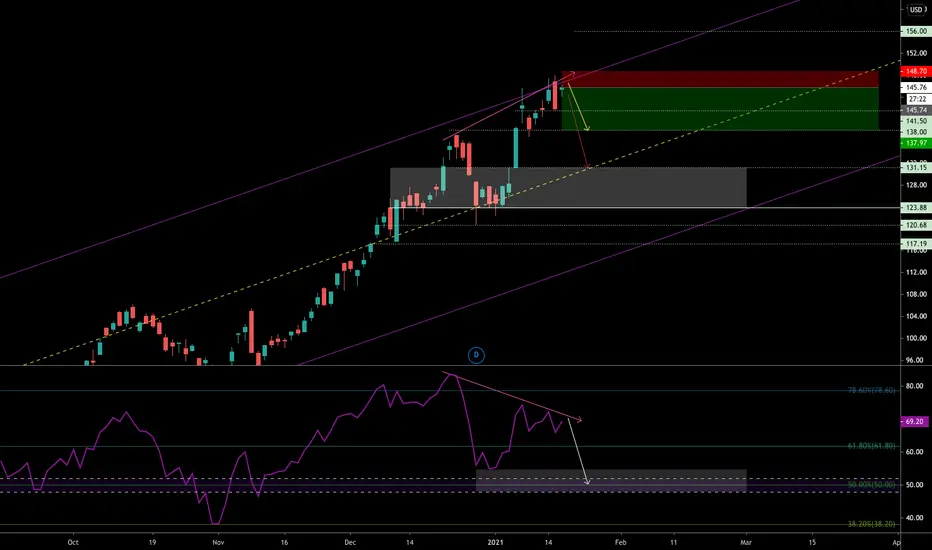
ARKK Potential mean reversion pullback/correctionARKK price sitting a +3 standard deviations above identified linear regression mean with a potential RSI divergence identified signaling a possible pullback or correction to levels of support.
Linear regression analysis
ARKK's current bull trend beginning on MAR 18 2020 has been well identified
A linear regression trend pulled to current date gives a Pearson's R maxed at 0.97634... indicating a strong correlation
Current price is sitting at +3 standard deviations (SD) above linear regression mean
RSI Divergence
RSI divergence identified from DEC 23 2020 - JAN 15 2021 levels
As per my own RSI strategy, I overlay fibonacci retracement levels on my RSI indicator
Previous observations indicate that a price break below the 0.618 RSI level corresponds to a break of identified areas of support when found with a divergence of price action
Support at RSI range of 48-52 could correspond with a retest of some region of price action support
Cumulative analysis
As price action continues to make higher highs and RSI continue to make lower highs, I am looking for a pullback or potential correction to coincide with a potential mean reversion. Using RSI bearish divergence as a signal, I have a higher degree of confidence that this will occur.
Using fibonacci extension/retracement levels as well identified areas of support and resistance as they correspond to linear regression mean and SD areas, key areas of support appear to be at approximately $141.50, $138, and $131.
I will be watching price action over the next few days to watch for confirmation or rejection of this analysis as RSI is still in a bullish range and volume could certainly continue to push price higher and invalidate the currently observed possible divergence signal. A bullish move and breakout of ATH could see a move to $156.


NQ Power Range Report with FIB Ext - 1/13/2021 SessionContract - CME_MINI:MNQH2021
- High - 12901.00
- Low - 12872.50
Evening Stats
- Gap: = N/A
- Session Open ATR: 200.94
- Volume: 16k
- Open Int: 231k
- Trend Grade: Bullish
Key Levels (Rounded - Think of these as a range)
- Long: 13337
- Short: 12415
Keep in mind this is not speculation or a prediction. Only a report of the Power Range with Fib extensions for target hunting. Do your DD! You determine your risk tolerance. You are fully capable of making your own decisions.


Pair Trading - Mean Reversion on BTCUSDTPERP/ETHUSDTPERPPrice might be crossing under the fast MA (yellow) and revert towards the slow MA (purple), the mean. For this trade, you can do a 1.3-to-1 reward to risk setup - 3% target profit, 2.2% stop loss.
Pair Trading (from Wiki): A pairs trade or pair trading is a market neutral trading strategy enabling traders to profit from virtually any market conditions: uptrend, downtrend, or sideways movement. This strategy is categorized as a statistical arbitrage and convergence trading strategy.

Pair Trading - Mean Reversion on BCHUSDTPERP/LTCUSDTPERPPrice might be crossing over the fast MA (yellow) and revert towards the slow MA (purple), the mean. For this trade, you can do a 1.5-to-1 reward to risk setup - 9% target profit, 6% stop loss.
Pair Trading (from Wiki): A pairs trade or pair trading is a market neutral trading strategy enabling traders to profit from virtually any market conditions: uptrend, downtrend, or sideways movement. This strategy is categorized as a statistical arbitrage and convergence trading strategy.

Pair Trading - Quick Scalp on BCHUSDTPERP/LTCUSDTPERPSecond attempt for the price to cross the fast MA (yellow) and revert towards the slow MA (purple), the mean. For this trade, you can do a ~2.4% 1-to-1 reward to risk setup.
Pair Trading (from Wiki): A pairs trade or pair trading is a market neutral trading strategy enabling traders to profit from virtually any market conditions: uptrend, downtrend, or sideways movement. This strategy is categorized as a statistical arbitrage and convergence trading strategy.

Scalping Forex Pairs After US Market CloseI'm sharing a strategy I've used for many years, that is scalping certain forex pairs after the US market closes and before the Asian markets open. During this time there isn't any economic news released so prices have a tendency to oscillate and don't trend which is a perfect environment to use the Buy Sell Bands for a mean reversion strategy.


Mean Reversion IdeaI am curious to see if price reverses back to the the MA's
RSI >70 in 4Hr
RSI >70 in 1Hr
MACD lines compressed in 4Hr
MACD lines compressed in 1Hr
Indicator heavy trade.
Let us see.


EU move towards MEAN EUR USD has been on a 200+ day bull run. Might be time to return to a more reasonable rate.


Home Bancorp $27.25 Price TargetP/E: 12.5
Dividend: 3.55%
P/FCF 9.36
Debt/Eq 0.02
Oper Margin 82%
Net Margin 17.5%
EPS Q/Q -60%
