Citigroup $C is cheap and oversoldBanks are still very cheap, $C trades at 6 PE with a 3.14% dividend yield and technically speaking its stock price is now at the lower part of its trading range for most of this year. Both the Range Strength and Hurst Exponent indicate the price is in a non-trending ranging mode, the RSI is at 22 and price is 8.38% below it's 50 day MA which is a lot for a mega cap like Citi, here looks like a good long play back to the 50 day MA.
Meanreversion

EURJPY SHORT (Mean Reversion)Confluences:
1: Stop loss hunt at previous high on weekly level plus a breakout.
2: Price heading towards high of the June(2021) which is an important supply zone with many retail stops.
3: Price has been moving very quickly which signals an over extended market for the pair.
Summary:
Price is currently over extended and has been moving in a up trend for 2 almost weeks straight. We are looking for a potential stop hunt at the high of June where many retail stops may be sitting.
There's is a potential for strong mean revision to take place allowing big players to hunt some stops and grab some liquidity before we see a continuation to the upside in a few weeks to come.
This trade is expected run for the next 8-9 trading days or until the target is reached, whichever comes first. Always remember to Buy to the low and Sell the high. We will see how this current weekly candle closes before looking for any entries early next week.

GBPCHF Long (Mean Reversion) with 3X Potential Reason
List of Reasons for potential pull back/mean reversion:
1: The market is over extended and has been moving bearish for almost 3 weeks straight with no pull back. This is more visible on the weekly chart than on the daily chart.
2: The trendline on the daily chart was broken with no retest.
3: Month Support level was broken with no retest around the 1.25*** area
Summary:
The trade has the potential to be a 4:1 RR or more abut this will depend on how deep the pull back is. Targets are set using fib tool. We also have to wait for the market to change from bearish to bull which will be visible on the H4 and Daily chart.
Once the market turn bullish, we will then be able to determine the correct RR of the trade. The trade will be left to run until the target is reached or between 5 to 10 trading days, whichever comes first.
Those who plan to sell the market in its current state must be very careful as smart money might close short some positions on the pair, forcing price to turn bullish, allowing them grab some liquidity.


GBPJPY SHORT (Mean Reversion)Confluences:
1: Stop loss hunt at previous high on weekly chart.
2: Price heading towards high of the year(2021) which is an important supply zone with many retail stops.
3: Price has been moving very quickly which signals an over extended market for the pair
Summary:
Price is currently over extended and has been moving in a up trend for 2 weeks straight. We are looking for a potential stop hunt at the high of the year where many retail stops may be sitting.
There's is a potential for strong mean revision to take place allowing big players to hunt some stops and grab some liquidity before we see a continuation to the upside in a few weeks to come.
This trade is expected run for the next 8-9 trading days or until the target is reached, whichever comes first. Always remember to Buy to the low and Sell the high. We will see how this current weekly candle closes before looking for any entries early next week.

Regressive VWAP Breakout StrategyStrategy type: Breakout
Ingredients: Price, Volume, Regression
Prerequisite add-ons (free): Regressive VWAP and Strategy Visualizer
Target market: CME:BTC1! or BITSTAMP:BTCUSD
- Long Entry on Close crossing over Regressive VWAP
- Short Entry on Close crossing under Regressive VWAP
- Optional: exit when price retraces to upper band (LX) or lower band (SX)
The key to this breakout strategy is the Regressive VWAP, which weighs Price and Volume with Regression Analysis, making the slope and its bands more responsive, with a degree of mean reversion.
Below is another example, this time CME_MINI:ES1! .

Bought PYPLBought PYPL
Overextended
Entropy decreasing with significant positive correlation
Might have to HODL for a bit but w/e

AUDJPY SHORT (Mean Reversion)Confluences:
1: Stop loss hunt at previous high on weekly level plus a breakout.
2: Price heading towards high of the June(2021) which is an important supply zone with many retail stops.
3: Price has been moving very quickly which signals an over extended market for the pair.
Summary:
Price is currently over extended and has been moving in a up trend for 2 almost weeks straight. We are looking for a potential stop hunt at the high of June where many retail stops may be sitting. We might see a further push to the upside at the new weeks open.
There's is a potential for strong mean revision to take place allowing big players to hunt some stops and grab some liquidity before we see a continuation to the upside in a few weeks to come.
This trade is expected run for the next 8-9 trading days or until the target is reached, whichever comes first. Always remember to Buy to the low and Sell the high. We will be looking for any entries early next week. Remember to always buy the low and sell the high.

Diversify your strategyThe holy grail of diversification is to find several uncorrelated asset classes all with positive returns. One problem, though, is that diversified passive investing has caused all asset classes to become more and more correlated over time. Increasingly, you see stocks, bonds, commodities, and cryptocurrencies all move together.
One approach to diversification that's increasingly popular with quants is to diversify your strategies rather than your asset classes . Long-short strategies are a popular example. Almost by definition, your short strategies will make money when your long strategies lose money, and vice versa. The challenge of making this work is that it's really hard to design short strategies with positive expected return. Since the market tends to go up over time, playing the market short is a bit like betting against the house at a casino. If you find a short strategy that actually works, that's gold right there.
Fortunately, there are some relatively uncorrelated strategies that work for long-only traders. This chart shows the Invesco "Momentum" and "Pure Value" ETFs. As you can see from the red and green arrows, the two ETFs often move in opposite directions. When one is producing positive returns, the other often isn't. Owning both can help smooth out your drawdowns and returns.
The same can be said for "mean-reversion" and "trend-following" strategies. Mean-reversion strategies involve buying assets that have made a big move downward. If you bought China stocks after their recent huge-selloff, that was a mean-reversion trade. Trend-following strategies, by contrast, involve buying assets that have made a big move upward. If you've bought oil and gas stocks in recent weeks, that was a trend-following trade. Both strategies tend to "work," but again, they're somewhat uncorrelated.
These strategies can further be broken down into short-term and long-term versions. Oil and gas is in a short-term uptrend, while the Nasdaq index is in a long-term uptrend. Facebook and Bristol-Myers Squibb are a short-term mean-reversion candidates after their recent sell-offs, while Calavo Growers and Regis Corporation are long-term mean-reversion candidates. The nice thing about using a mixture of short-term and long-term signals is that they allow you both to profit from stable market conditions and to quickly pivot at least some of your capital when market conditions change.

Idea: How to "wait and see" before jumping into this tradeCurrently watching TSLA because of the hype over Q3 earnings (to be announced).
About this setup:
- Investment horizon: Medium term (i.e 2 weeks to a month).
- Timeframe: Daily chart
- Strategy used for backtesting: Mean Reversion (ATR) Strategy
Idea: Using Price by Volume Histogram to find current support. Also, we want to mimic the initial point of entry signalled by the Mean Reversion (ATR) Strategy algorithm.
Scenario: Price is currently 843; should have entered at 733 following the algorithm. It's too late now, but still waiting to enter the trade.
Setup:
Using the built-in volume profile tool, set the range starting from the hypothetical point of entry (Sept. 20) extending it up to the current bar (Oct. 15). The red line is the POC developed over time. In theory, it approximates the moving average of price weighted by volume. This arguably provides more meaningful information compared to simple/exponential moving averages because (a) it takes volume into account, and (b) and it sticks to the defined fixed range of period drawn on chart.
Other points to note:
- 70% of the price distribution is between 762-816 (non-transparent area of histogram); price is currently above, so we assume TSLA is overbought.
- the discrepancy between current price and red line is due to lack of volume. If more buyers come in, the histogram will be skewed upward (actually to the left, if looking from correct side), and the red line (POC) will also rise up.
- POC has been horizontal at 780 since period of consolidation that began on Sept 28. We define this as the area of support.
- POC stands for "point of control", it's the longest bar of the histogram.
Stage 1: Do nothing. Just wait.
Stage 2: Enter at area of support.
- Scenario 1: later, if price rises to 860 (i.e as per 12month target price set by analysts at Goldman) => Tighten your trailing stop loss and/or start taking profits.
- Scenario 2: later, if hits stoploss placed below area of support during a selloff => Accept the loss, wouldn't be surprised if we revisit prior supports ranging between 680-720
Other notes:
- there are at least 8 analysts covering TSLA; their targets range between 120 to 1200. (Source: NASDAQ ER summary ) We used GS's 860.
- this is not an investment advice, it's just a thought process

Situational Fluency | Are Markets Favorable For My Strategy?You may have heard the adage, make hay while the sun shines. In market terms, we might translate this to ... make (the most) money when conditions are favorable for your strategy.
The recent increased volatility yesterday, and last Monday 9/20, also increase the probability that range days will follow. In this video, I take a look at a VWAP Bands strategy (Stay IN Your Lane) that does very well under these conditions.
The primary indicator for the strategy shown in the video is called " VWAP Stdev Bands v2 Mod UPDATE" and is available in the public library on TradingView.

API3: Trend Continuation Analysis with TargetsAPI3 appearing to find support on well correlated uptrend.
Anticipating support at -2 standard deviations (SD) below regression trend mean to hold.
Watching for either a mean reversion, break above, and retest for bullish confirmation or break below -2 SD for exit.
Analysis:
Price
Currently price action is ranging between $4.75 resistance corresponding well the POC for volume profile (blue line), and $3.99 support level just above Fib 23.6% retracement pulled from ATH to local low. Pink dashed lines on chart are areas of significant support/resistance as determined through analysis of multiple fibonacci pulls or simple S/R identification.
RSI
RSI currently sitting at neutral level of 51 needs to stay above 38, ideally looking for a cross and close above 55 in the next day or two for confirmation for bullish continuation.
ADX/DI
Increasing bullish trend though weakening slightly
MACD
MACD still in bullish territory above zero line. Though it appears to be nose-diving with a trajectory towards a zero-line cross, price action appears to be diverging from this move downward and MACD is starting to curl up.
The trade:
Entry: $4.17
TP1: $6.00
TP2: $7:00
Stop (Mental w/ alerts): $3.779
RR: 4.7
An ascending triangle has been drawn using the -2 SD of linear regression trend and the POC of volume profile/resistance.
Watching for bullish breakout of this triangle.
If PA breaks down out of the triangle I will be watching for support at stop-loss area at $3.779.
This stop will be a mental stop-loss with alerts as I will want to see a Daily candle close below this before exiting trade to avoid getting whipsawed.
If price closes below stop, trade will be exited and will reevaluate entry watching for support from identified areas (dashed pink lines).
-Spreck

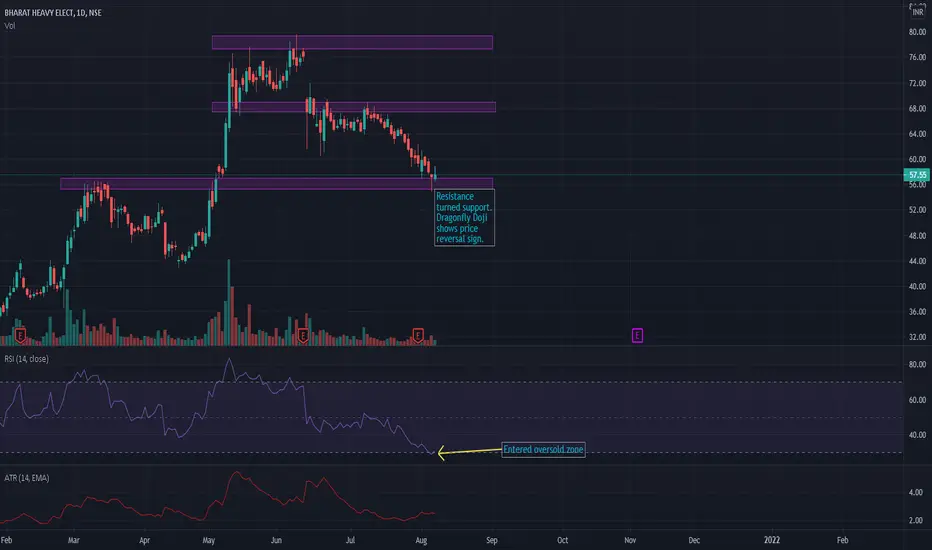
BHEL - price analysisNSE:BHEL has shown reversal sign with dragonfly doji candle at 56 level. It is also a support level which was a previous resistance. RSI(14) just entered oversold zone. If price stays above 56.90 level, it could go to 67.
HUT Daily AnalysisComing up to a key supply zone. Two possibilities can come from this. Either the price breaks above and, ideally retesting resistance and support, runs to test higher levels.
or
The broader market seems some pressure and this level is rejected causing the price to retrace to the 200 SMA, and if that can't hold then the demand zone below.
Waiting for confirmation will help you pick a direction early on in the rally. This can be found in the form of a break and retest for an upside breakout, or a bearish divergence from a mean reversion trade.
Setting up this trade with a profit factor of 2.0 or greater makes it statistically efficient to trade.

Take-off for UAL but it could be a dangerous flightUAL recently smacked a support level at around $48 and seems it could possible rebound to the upside. However there is very major catalysts for UAL to further within the coming weeks. Covid is still relentless as always and with the new 'Delta variant' proving to be more adaptive, and dangerous it could potentially impact the already suffering fundamentals of the airline industry. One thing going against the virus is the current vaccine rollout which is currently on par with expectations. This could then act as a buffer for UAL despite the new developing strains such as the delta and lambda variants.
As its currently summer in the US as expected flights have been increasing and interestingly enough even bet pre-Covid levels which is great news for UAL and other airlines.
From a technical standpoint indicators push a bullish narrative with the Bollinger bands, rsi and mean reversion being oversold signalling a buy opportunity.
Alot of support levels also were prominent where there was support level from the 32.8% Fibonacci level, linear regression aswell as the 180 day sma.
Overall it appears like UAL has momentum to launch from its current price, possibly to $53 prior to hitting a resistance channel. However due to the nature of the company negative news sentiment will be very influentially on the stocks price so be wary.

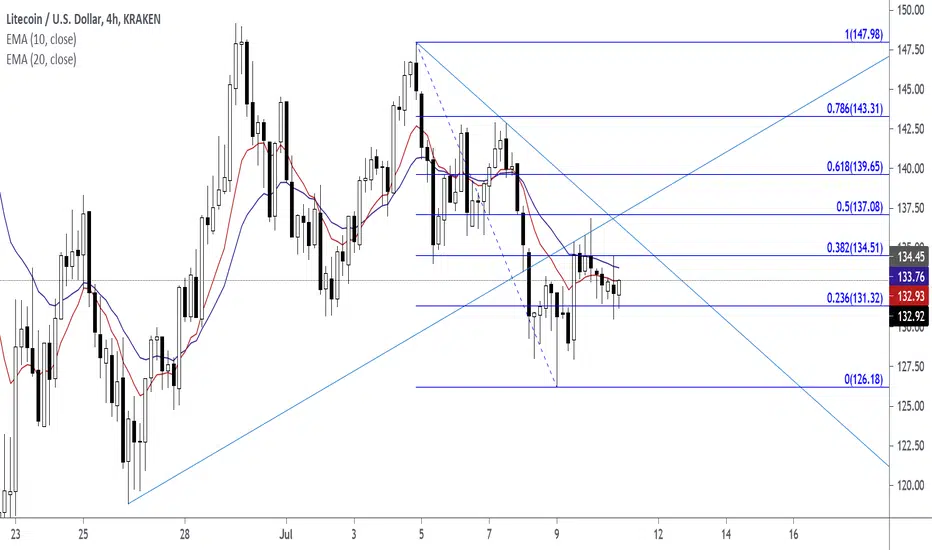
LTCUSD Fibonacci Retracement LevelLTCUSD. Ideal entry is at the 0.382 Fibonacci Level. The Pin Bar close near that level. There was a gap that occurred on July 8, 2021 at 03:00. The gap represented horizontal support resistance level. Price closed in the area of the EMA 10 EMA 20. Price closed below diagonal trend level and retested that diagonal level as new resistance.
Confluence:
Diagonal Trend Line Level
Gap (Horizontal Support Resistance Line Level)
Fibonacci Retracement Level
EMA 10 Dynamic Support Resistance Level
EMA 20 Dynamic Support Resistance Level
Pin Bar at Lower High
Under-reported: momentum crash of 2021Pretty amazing nobody is talking about the #momentum crash that erased 3 year gains of this strategy. I guess the lesson here is as much as we like to chase things on the way up, never underestimate the power of value and reversion to the mean! $PDP $MTUM

[Positional] Bharat Forge Long & Short BetBuy if breaks above : based on bullish Flag theory
Sell if breaks below : Based on mean reversion theory
Note -
One of the best forms of Price Action is to not try to predict at all. Instead of that, ACT on the price. So, this chart tells at "where" to act in "what direction. Unless it triggers, like, let's say the candle doesn't break the level which says "Buy if it breaks", You should not buy at all.
=======
I use shorthands for my trades.
"Positional" - means You can carry these positions and I do not see sharp volatility ahead. (I tally upcoming events and many small kinds of stuff to my own tiny capacity.)
"Intraday" -means You must close this position at any cost by the end of the day.
"Theta" , Trade Setup based on option Decay !
=======
I won't personally follow any rules. If I "think" (It is never gut feel. It is always some reason.) the trade is wrong, I may take reverse trade. I may carry forward an intraday position. What is meant here - You shouldn't follow me because I may miss updating. You should follow the system I share.
=======
Like -
Always follow a stop loss.
In the case of Intraday trades, it is mostly the "Day's High".
In the case of Positional trades, it is mostly the previous swings.
=======

NZDUSD long – Daily mean reversion tradeMean reversion trade after bounce from weekly level.
Entry: 50% retracement
Target: 3:1
Management: Set & forget

BTC likely has a technical bounce likely coming. but from where?Want to draw your attention to the purple line. the cpr or central pivot zone. notice how price reverts either direct to strike these levels reguardless if price continues or reverses. This same thing happens on daily cprs, weekly, and monthy cpr with over a 90% rate of occurance.
This chart is projecting the future weekly levels. it is possible that the reversion happens prior to the close. or following... likely from the coming L3 which right now is at 31k
These types of bounces reguardless of how frequent are hard to play because the developing or "next level" s they are labelled on the chart is hard to be sure of before they are set in stone.
That being said dca is a possible stradegy. Currenly the incoming cpr levels are 2 to 4k higher than this price point. So I would expect a bounce from these regions or 30 / 31.5 up the where the new central pivot is formed upon the weekly close.

HARMONY ONE monthly camarilla pivotsStop loss at L4. Entry on L3. Target H3. Extra targets for longer positional trade if successful are labelled on the chart

Link chainlink monthly/weekly camarillaWith a tight stop loss on the weekly L4 it is possibly link maybe have some mean reversion upward based on a combination of camarilla weeky and monthly pivot points levels. Would want to see it maintain and have a reaction from the L3 levels.
also oscillation is low. A tight stop is potentially a good setup for this historically bullish asset

EOS eosusdt monthly camarilla pivotsDaily chart. with monthly cam pivots. So long as it can bounce off of or hold above the monthly L3. It might be a good entry position after some long consolidation.
It is worth noting that the weekly stop loss level for those wanting a stop loss (aka level L4) is around 4.28. For those who want to run a tighter risk reward trade
Also a wide cpr and untested monthly pivot shows hints of a higher possibility that the price may range instead of simply tank from here
