The Edge Of The Fork - The Joker In Your PocketWOW!
\ \ First of all, I want to say THANK YOU for all the boosts, follows, and comments. You guys & gals give me the energy to continue this journey with you.\ \
Today, I want to show you that what we’ve learned with horizontal lines can also be applied to "Medianlines," or Forks.
Listen, I don’t want you to blow your brain with all the rules.
Not at the beginning of this journey, and not later on either.
Don’t ask yourself:
* when to use which Fork
* which swing to measure
* when to trade
* where to set your stop
* what if... bla bla bla
That’s not fun — that’s stress.
I don’t like stress — nobody does.
So let’s just chill and have fun here.
That’s my personal reason for doing all this Trading thing. I want to have fun — the money will take care of itself, just like the destination of a trail takes care of itself, as long as I keep putting one foot in front of the other. And that’s simple, right?
So let’s do it exactly the same way.
Just simple steps, connecting some dots, and BAM! — You’re there before you even know it §8-)
\ Let’s jump to the chart:\
Today, you’ll find out why Medianlines/Forks are a cousin of the horizontal Channel — but NOT the same.
Where are they different?
Forks are different because they’re capable of projecting the most probable path of price. And that’s a HUGE difference.
Yes, you can apply the full rule set of Forks to a horizontal Channel.
But the Channel CANNOT project the most probable path of price.
I hear you, I hear you: "No one and nothing can foresee the future. How is it even possible that Forks can?"
\ Here’s why:\
There’s a thing called "Statistical Importance." And it means that if something happens very often in the same way, we have a higher chance of seeing the same behavior again in the future.
And that’s what the inventor, Allan Andrews, discovered — and he created the rules around his findings.
\ A high probability that price will move in the direction of the projected path, as long as it stays within the boundaries of the Medianlines/Fork.\
That’s the whole "magic" behind Medianlines/Forks.
And the same applies to the "Behavior of Price" within and around Medianlines. That’s really all there is to it.
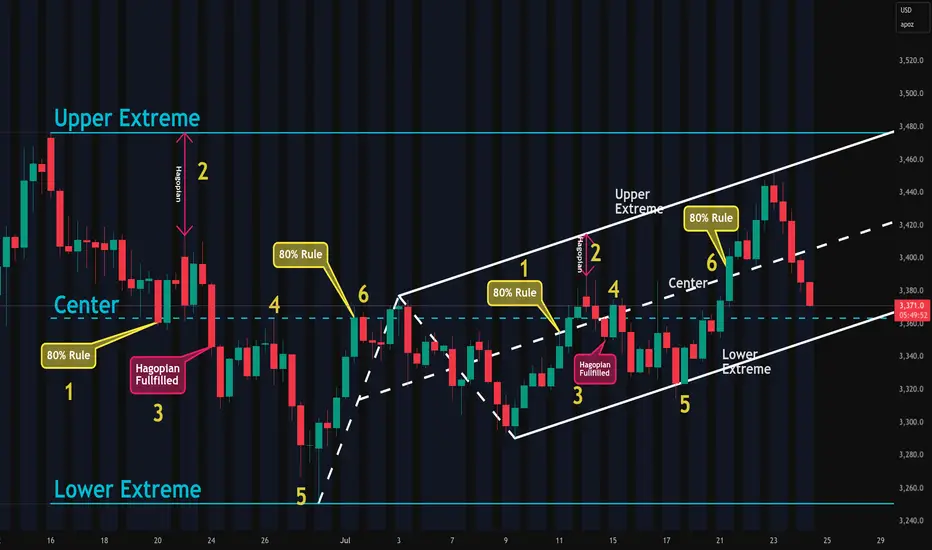
Look at the chart and compare the Channel and the Fork:
1. Price reaches the Centerline about 80% of the time
2. HAGOPIAN → price goes farther in the opposite direction than where it came from
3. HAGOPIAN’s rule fulfilled
4. Price reaches the Centerline again
5. Price reaches the other extreme
6. Price reaches the Centerline about 80% of the time
You’ll see the same behavior inside the Fork!
That’s beautiful, isn’t it? §8-)
And here’s a little Joker in your pocket — if you know the difference between the Channel and the Forks!
Do you know what it is?
Yep! You’d automatically know the direction to trade — giving you another 10% edge right out of the box — LONG TRADES ONLY. Because the Fork projects the most probable path of price to the upside, not down.
That's all folks §8-)
Like this lesson?
With a simple boost and/or a little comment, you load my Battery so I can continue my next step on the trail with you.
Thank you for spending your time with me §8-)
Medianlines
Median Line Trade RGTIPrice tests the LMH and rejects it. Look for a long at the retest. We get set at 12.50.
TP1 is logical at 2.5R and just before the prior top in case we fail to follow through
TP2 is at the median line. As Dr Andrews says "Price makes it to the Median Line 80% of the time".
Ok 'we got lucky' on some news for such a quick set of T/P's. Price definitely moved quicker than expected. However it wasn't luck that put us in the position.

DJI – Ready for the Final ActAfter the breakdown below the last support on March 11th, the price pulled back and formed P2.
A frightening drop followed, reaching P3, then a sharp V-shaped recovery up to point (4)—just a few points shy of the Center Line.
If P2 doesn’t get taken out, things could turn ugly again. Because in that case, my new target lies below the white Lower Median Line Parallel, at P5.
Nothing is certain—never has been. But these days, *everything* feels off balance.
The moves are insane. Governments trading ahead of the news, making hundreds of millions at the expense of ordinary people. It’s like reality has left the building.
Tiny positions. Tight stops. Very high risk-reward ratios. And absolutely zero FOMO.
That’s how these markets must be traded.
Anything else, and we’re bound to get wrecked.
\#backfromcontemplation

A Gold'en Newtonian Sell-Off Porjected By MedianlinesSir Isaac Newton stated the Third Law of Motion in his landmark work, Philosophiæ Naturalis Principia Mathematica (commonly called the Principia), which was first published in 1687. This law appears in Book I, in the section titled Axioms, or Laws of Motion.
(Axiom: A self-evident truth)
Newton did explicitly present it as an axiom. In fact, it's Axiom III (or Law III) of his three fundamental laws of motion. Here's how he phrased it in the original Latin and in his own English translation:
"To every action there is always opposed an equal reaction: or the mutual actions of two bodies upon each other are always equal, and directed to contrary parts."
And what does this have to do with Medianlines / pitchforks?
This tool measures exactly that: the action — and the potential reaction!
Medianline traders know that pitchforks project the most probable direction that a market will follow. And that direction is based on the previous action, which triggered a reaction and thus initiated the path the market has taken so far.
…a little reciprocal, isn’t it? ;-)
So how does this fit into the chart?
The white pitchfork shows the most probable direction. It also outlines the extreme zones — the upper and lower median lines — and in the middle, the centerline, the equilibrium.
We see an “undershoot,” meaning a slightly exaggerated sell-off in relation to the lower extreme (the lower median line). And now, as of today, we’re seeing this overreaction mirrored exactly at the upper median line!
Question:
What happened after the lower “overshoot”?
New Question:
What do you think will happen now, after the market has overshot the upper median line?
100% guaranteed?
Nope!
But the probability is extremely high!
And that’s all we have when it comes to “predicting” in trading — probabilities.
Why? Because we can’t see the future, can we?
Gold?
Short!
Looking forward to constructive comments and input from you all

ZINC - Seems it breaks monthly supportThe lanted green support line has a crack.
It's a first indication of a turn in mid-term trend.
Long term Medianline view on ZINC shows that price is battling at the L-MHL. If we get a weekly close and new open below it, it's ripe for a short.
At least I will stalk it on the daily.
PTG1 is the Center-Line.

VRSN - VeriSign has reached it's upper extremeThe white up-sloping Fork gives us the most probable path of price for VRSN.
As we see, that was a Hell of a run.
Price has reached the U-MLH, which is the natural Extreme by the law of physics.
What's the natural reaction?
A move back to the Mean.
What's the Mean?
The Center-Line.
This is a high probability trade I take blindly.
But I mange my risk with open Eyes, even when this trade has a win rate of over 80%.
Don't let greed your Brain!

Reverse At Centerline In NQJust watch how price came down to the red Centerline. From there the Bulls where waiting.
Now we push back up to the white L-MLH.
Further potential targets are shown with the green arrows.
Just observe it and learn from it.
Done4Today §8-)

MSTR - Short again with two profit targetsP4 was a rejection at the Center-Line, the perfect short. To me the current situation commands me to add to this short.
BTC is weaker and in a scary spot. MSTR also weaker and on the way to the PTG1. This time, the add to my short is not a technical signal, but a gut feeling and a combination of the current world situation.
And hey, I maybe get slapped because I FOMO into this. But that's OK. Sometimes I need a little bit more Fun in the Game. I do such unintelligent trading when the overall performance allow me to.
Let's go Captain Ahab!!!

NVDA - Waiting for a pullback to add to my short exposureThe first NVDA analysis went pretty well.
Let's see what we can do from here.
Over the weekend the world was going crazy once more. This knocked the markets down and they opened in the red, and so does NVDA.
I would like to see a pullback to the 1/4 line. Because this would give me the chance to load the short even more.
Target is the Center-Line.
(Former analysis linked)

BTCUSD Textbook but bad for LongsAccording to the trading framework of the Medianlines, BTCUSD is behaving perfect.
If we close below the white Center-Line, first profit target is at the 1/4 line, second is at the L-MLH.
Only a reversal aka HAGOPIAN can turn the momentum from down to up. It's when price is open and close above the white Center-Line again.
Turbulent times ahead...

Coffee KC - Why I see $390 and $470 as possibleThe Medianlines project the most probable path of price. It's not a fortunetelling tool. It's a technical tool which is based on serious statistical research.
So, what I do when I use it is, using statistical proven evidence on a graphical basis, supported by a definite trading framework.
Why do I pound on these information?
Because it's important to understand what Medianlines aka Pitchforks are based off, and what they are good for in trading. No "Magic", just a tool that helps a trader/TA in it's daily Job.
ANALYSIS OF COFFEE
The up-sloping white Fork shows us the most probable path of price. It's up. Price blew through the Center-Line, found support, and advanced even more to the upside from there.
Then we have the slanted yellow dashed lines.
What are they?
Many say this is a action/reaction thingy.
Others say, it's a timing tool.
I say, it's both.
The way I use it, it takes in the angle from the last real high, and the low of the pullback from it. Then I go back to the last low before the new high. This creates an Angle, and a width. Combined it gives us not only a potential timing, but with the dynamic of price movement also potential resistance/support.
So, we can see where we got such signals - where the orange circles are. The second one intersects very nicely with the Center-Line of the white Fork. I observe this "incident" often when I use them.
Back to Coffee...BRB §8-)
We see the time/price line intersecting with the 1/4 line of the Fork. I expect a reaction there - even a pullback back to the Center-Line is possible from there.
But if price also blows through this level, then I know that the next Target will be the Upper-Medianline-Parallel.
So, there we have it.
I hope you can take away some knowledge from this post and thanks for all the boosting and following folks.

RUT - Russel is in a similar "Dump" patternIn 2021 we saw the Russel creating this Dump Pattern:
1. Sideways
2. Break the high
3. Dump
Watch how it looks now.
To me it's very, very similar.
Any other confirming signals?
Yes!
Price reached the white Center-Line and started to go south.
Here's my game plan:
If the weekly TB is broken on a close, and an Open is below the TB afterwards, I'm looking for a short entry.
PTG1 is at the red Center-Line and a runner with a definite PTG2 at the green support line.
My weapons will be the Options, not the Futures. It gives me much more leeway and freedom of flexibility.

A Google Short Term TradePrice is back to balance at the Center-Line.
From here we have a 50/50 chance that it will either shoot through it, or turn and trade in the opposite direction.
My bias is short because of the overall market situation.
(Partial) Target is the GAP-Fill at the L-MLH, which a Stop I can afford and not even think about it when it get hit.

A rercurring Topping Pattern - Take (partial) Profit?What's this?
..just a Pattern.
..a recurring pattern.
..a very similar, recurring pattern.
So what is this post good for?
Maybe just a heads-up?
Or just that you can roast me to point out that BTC is stretched, and has a high chance of pulling back or even going South.
However, be happy, not angry §8-)

Why I Buy MacDonalds With Both HandsMCD tanked impressively lately.
I had no clue why.
Then I checked the News, which I very rarely do.
There was one article that made absolutely no sense to me:
"Concerns about weight-loss drugs:
There are some concerns that the growing popularity of weight-loss drugs, such as Ozempic and Wegovy, could take away demand from food companies like McDonald's."
To me, this writer has inverse Logic.
Why?
Because if I would love the (crappy) MCD Food, and I could just take a Pill and loose weight, I would probably eat more at MCD.
However, I buy with both hands since MCD is a the Center-Line of this Pull-Back Fork, as soon I have some indication.
(Heads Up: Earnings ahead!)
And remember: You can buy, even when you sell (...hint: Puts). It's the Buffet way. If price close in the money at end of DTE, you got the Put's premium, AND the Stock for a way cheaper price. If price is closing out of the money after DTE, you keep the premium....double Whopper §8-)
Away for a healthy Burger at $MyOneKitchen.

CROX - Change in Trend and repeating history?Every time CROX closed above the range with high volume, a uptrend followed.
Will it be the same this time?
Fundamentally, they say, CROX is a steal.
Indeed, if I check the numbers and ratings, it shows me that CROX seem to be a really solid Company.
Although my prior analysis pointed to the Abyss, I now are more interested in a LT buy in CROX.
Let's wait for a high volume close above the range and then take a ride.

BTCUSD - Expecto ShortonumIt's a little bit overdue...
The Green line is a pressure line.
I expect a short-term drop.
Also, see RSI.
PC4TWld

META has the potential for an EPIC failThe squeeze to the upside was phenomenal!
But in my view, they over-pumped it - who ever it was...
The white Center-Line provided good support when price failed at the GAP/Resistance Zone. this zone is built just with the range of the GAP-Bar.
After the CL support, meta reached the another temporary high at the orange CL, bounce back to the white CL again and once more got pumped up to the orange CL/GAP/Resistance zone, where it hangs out now.
Of course; If I had the money to move markets, I would want my Stock to be as high as possible to a) unload and b)short it for a Double-Whammy.
The huge divergence with price and RSI speaks for it self.
I know that I know NOTHING.
But I know what I can "Project" into the future.
It's good to be prepared, also for a move in the opposite direction, which is Up Up and away.
That means, if I short, my risk is small. No need to be a Hero and win a T-Shirt for putting myself at risk to loose my House, Cats & Dogs.
I am fully aware, that price is currently ABOVE the white CL and no lower low is broken yet. That's what makes a short so difficult.
Peace4TheWorld!

NVIDIA did the wrong move.The open was outside of the L-MLH and the HAGOPIAN is playing out too.
Next Target is the Center-Line, which has a roughly 80% chance to reach it.
So, I let my small position ride for a early Christmas gift §8-)
Peace for the wold!

Frozen Orange Juice - Retirement Trade.OK, this is just4fun peeps....or not? §8-)
Seeing OJ at the U-MLH with such a exponential run up, it is at least worth a "Shot".
...of course with managed risk and money management!
Don't go crazy with this LOL.
Cheers
...slurp...slurp...

RTX has 2 Short-Levels I would jump inThe orange Fork projects the pull-back potential, which is the Center-Line.
There are 3 short levels I see:
1. The primary is way up in the primary Sellers Zone.
Although this would be the most profitable one, it has a
caveat: Price would by then have broken the Trend Barrier (Dotted slanting Trendline).
2. The secondary Short lies the Secondary Short level, right where the GAP happend. Within this level is also a tiny bunching, where price was not able to overcome.
As for the Oscillators, the MACD and Mansfield are pointing to a Down-Trend. Only the RSI seems to be oversold and is indicating a potential pullback, which is in essence the reason to look for a short. It's supported by the Buyers Zone, where price was picked up by the Bulls.
Definitely a Chart that has it's place in my watch list.
Happy day Tr8dingN3rds §8-)

S&P500 on the way to the projected levelHere we are, seeing the projection I posted on my site and here becoming reality.
P4 was slightly above the Center-Line.
How price is falling through it.
Next Target is P5.
Either the Warning-Line, or the Lower-Medianline-Parallel.
In between I expect a bounce up to the Centerline.
Also, keep in mind that we could get a HAGOPIAN!
That means, if price is not reaching the L-MLH, and pulling back above the CL, then possibilities are up for a huge move to the North.
I took partial profits as shown in my last video on YT today. The rest is riding down to one of the targets.
Steak & Lobster Baby! §8-)
Wish you all a happy day.

TESLA ran into the sellers zone againYes, I'm already short TESLA.
And I want to load my boat even more.
Here's why:
1. The grey up-sloping Pendulum Fork produces a big HAGOPIAN.
2. Price get's knocked on the head, every time it trades into the Sellers Zone. (Sellers are still there).
3. Red down-sloping Fork: Price got rejected at the U-MLH.
That's it?
Yes, that's it.
If you want the very details of this analysis, I did a deep dive of TSLA this morning and posted the Video.
Let me know what you think about this trade §8-)
