Link LongLink manages to Hold 200 MA (Orange line). In July 21 it closes above orange line and touched 36$. Second reason Link working on web3.
Recommended to buy Link Short term to Long term.
Buy Link 15.7, tgt 16.7, 17.5 , 18.7, 20, 23. Long term target 50-75$
Medium

Capitulations or fakeouts are good signalsThis is a long fakeout in the chart of $ENPH. We look at this fakeout after it brakes a trendline and you don't find continuation to the downside after retesting the break.
After this, the fakeouts market liquidates many MANY sell positions and call options that they do 2 things:
Scare the sellers with bad loses
Add tons of liquidity or volume around these prices.
Plus, the MACD gives a delayed, but great signal to ATH. And the fundamentals are looking great:
www.etoro.com
So, I can do 2 things, go for different mini trades in the 4 hours allocating 0.5% to 1.5% of my portfolio and leveraging those either X2 or X5. Or I can go the low-risk option and add a larger allocation, up to 5%, and just let it be there.
1) Short-term trading (swing trades) with low leverage:
The Pros of this strat are having more capital to open other trades like BTC (which is moving now) or just having cash for hedge purposes.
The Cons is the risky trades as I can lose that capital easier in this way as the short-term trades are usually fewer probability trades.
2) Long-term position with higher allocation.
On the contrary, a long-term position is a higher probability trade, not a time-consuming (a simple SL and TP order would do) position, but it allocates a large amount of capital.
I'll try to do half and half this time.
Let me know what you think about this

Bitcoin Adoption in El Salvador is HUGEWhile the majority of the companies in the survey pool were small businesses as they account for 71% of the respondents, 16% of them were large companies and 13% were medium scale businesses.
What this survey shows is that despite the litany of moves the government has made to drive its people towards Bitcoin, the level of adoption is still considerably low.
Despite the low adoption rate, President Nayib Bukele remains bullish on the flagship digital asset, and the country currently holds around 1,800 units of the coin.
El Salvador’s Bitcoin Bond plan hits a snag
El Salvador’s plan to build a Bitcoin city financed by a $111 billion Bitcoin bonds appears to have hit a snag as the country’s finance minister, Alejandro Zelaya, in a recent interview with a local TV station hinted that the ongoing war in Ukraine could impact the implementation of the bond.
The bond was first announced in November 2021, and it was revealed that half of the money generated from the bond sales would be spent on building infrastructure and geothermal energy-powered Bitcoin mining. The other half would be used to purchase Bitcoin for the country.

Why Laxmi Organics is a strong Short to Medium term BUY NSE:LXCHEM
TEN POINTS
1. Laxmi Organic Industries is a specialty chemical manufacturer, focused on two key business segments - Acetyl Intermediates (AI) and Specialty Intermediates (SI)..The company is currently among the largest manufacturers of ethyl acetate in India with a market share of approximately 30% of the Indian ethyl acetate market. Laxmi Organic exports about 25% of the manufactured products.
Additionally, it is the only manufacturer of diketene derivatives in India with a market share of approximately 55% of the Indian diketene derivatives market in terms of revenue in FY21 and one of the largest portfolios of diketene products
2. Stock gained 50% in one month only after listing -hitting a high of 628 and reported a significant jump in its net profit to ₹98.68 crore in the quarter ending June as compared to ₹18 crore in the corresponding quarter of the previous fiscal. Its revenue from operations also witnessed a massive jump to ₹689 crore from 354 crore in the year-ago quarter.
3. However massive rainfall in Pune factory forced the company to close one of its factories for some time during the SEP 21 quarter and Net profit tumbled from ~98 cr in SEP 21 to 10.3 cr in SEP 21 qtr.
4. Coupled with profit booking the stock tumbled to 385 levels.
5. After a 3 month consolidation the company seems to be turning around its limitations shown in the previous quarter.
6. On the positive side- India Ratings and Research (Ind-Ra) has upgraded Laxmi Organic Industries Limited’s (LOIL) Long-Term Issuer Rating to ‘IND AA-’ from
‘IND A+’. The Outlook is Stable, the ratings agency quoted
7. Despite 60% decline in SI volumes on qoq basis on account of 45 days shut down at SI Unit (Mahad) which caused heavy loss, Laxmi’s H1FY22 profits were close to FY21 performance led by rapid growth in specialty business and higher spreads in acetyl business during the first quarter and normalised acetyl spreads during the second quarter. There is a strong visibility on SI order book for H2FY22. Laxmi has acquired significant international accounts during Q2FY22, as 24% of SI sales were from exports as against 5% in Q2FY21.
8. Buying at current levels is recommended for a short to medium term target of 500-520 for the short term and 620 for the longer term.
9. Maintain stop loss around 430
10. Risk reward ratio of 1:3

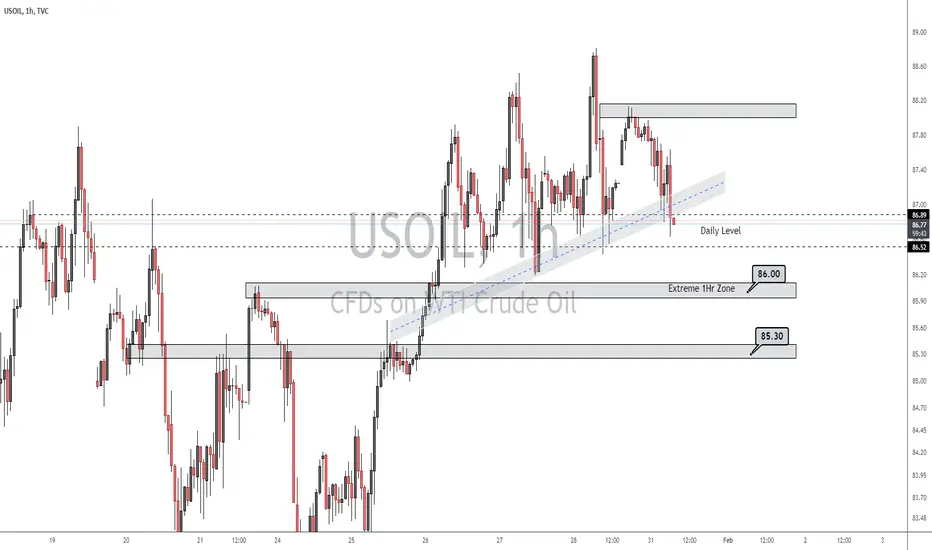
USOIL 1Hr Medium Term AnalysisI'm bearish on crude as we begin the week, in the medium term. We have been quite bullish on this
commodity. However it looks like we may correct to 86 and/or 85.30$ price point before
continuing our Bullish Ascent to 90$
Bitcoin Bitcoin is allergic to the 350 day moving average. Spending > 10% of it's time in this region over the last 2 years. Admittedly we've been in a bull run but this is a good time to buy for me looking toward a mid to late January peak.
Second to this 350 MA tap is the MACD that seems to want to cross to the positive from a oversold Bitcoin perspective.
www.lookintobitcoin.com
This is a link to a great resource in lookintobitcoin.com check out the 350 day moving average here. Trade with care, use a stop loss and never go all in!

LONG NATURAL GAS ( HIGHER HIGH HIGHER LOW )Based on simple price action TA, we can see price trying to go up slowly caused by not enough cold weather on next weeks.
4$ is a clear resistance but I am just aiming the leg up this move.
Like and share thanks !

Market sell off in small cap stocks Market sell off in small cap stocks. Small cap stocks are usually the first to sell off and the last to rally bad times for the markets ahead?

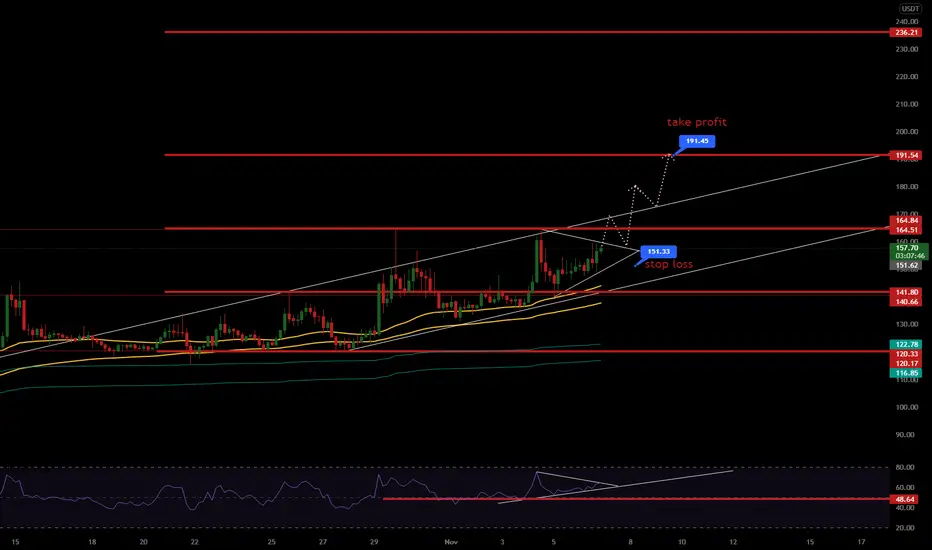
AXS/USDTentry zone = now
exit zone = 191
if u happy with my idea pls like my sweet followers
* ___ *
GBPNZD Long Trade SetupIt's hard to say whether the last low is the end of the green C, but if it's, we should have a complete expanding flat between the orange lines. So, I'm looking for long trade setup. It seems like a reversal structure that has been forming after the last low. That's why I'm waiting for a correction to place a pending order. If I see a smaller trade setup after the correction, I'll take that one.

GER30 Short Trade SetupWe may have a complete expanding flat, and a reversal structure. That's why I placed a pending order under the last low, but I'm hoping for another upward movement and a small trade setup after the correction. If it happens, I'll update the entry price and lot size.

USDCAD Long Trade SetupI think we have two options. First, a complete correction under the blue trendline and one more downward impulse. If it happens, I'll take a long trade after a reversal structure. Second, an expanding flat between the yellow lines, and a reversal impulse. Because of this option, I'm waiting for a correction to place a pending order.

Bullish cup & handle in ICICIBANKICICI Bank has broken cup and handle pattern and have retested and moved up from the level. there is high probability of it to test the price of 800) in coming 1-2 months. If BANKNIFTY will remain sideways or bullish then it it will surely touch 800.
These are my view on the etries
accumulation zone 667.5-670
distribution zone 750-800
Risky zone 650 or below
Price should move up equivalent to depth of the cup ~140 points from entry zone as per theory.
PS: do your own analysis before taking entry based on this anaysis

GER30 Short Trade SetupIt seems like we may have a complete running flat between the green lines. If this is the case, a reversal structure should be in the making. I'm waiting for a trade setup on the lower time-frame to sell it. The second scenario is a correction over the blue trendline and more upside. That's why I'll try to move SL to BE around trendline if I take a trade.

USDCAD Long Trade SetupWe may have a complete correction, and if so, we should have a reversal structure. That's why I've placed a pending order over the last top. If I see a small trade setup after the correction, I'll modify my entry price and lot size accordingly.

CADJPY Short Trade SetupAlthough we have a new high, the previous monthly top (the red A), which is shown by the dashed line, hasn't been broken yet. This means, the monthly structure remains a running flat. That's why I want to take a short trade. Structure-wise, the minimum target will be 73.700, but it won't be my trading target since it will take a long time to get there. I placed a pending order under the potential reversal impulse. The risk here is having a small correction like the previous one that is marked by the yellow box. If it makes a bigger correction like the blue one, we will have time to move SL to BE.

AUDNZD Long Trade SetupI think a huge correction between the red lines is made, and the last low can be the end of it. The last part looks like a squeezing channel, which is one of the best reversal patterns. Although everything looks good for upside, it's still in the channel, and it can come down more. What we have after the last low looks like a reversal structure. Now, I'm waiting for a lower degree trade setup to place a pending order.

XAGUSD Long Trade SetupOn the daily scale, a running flat should be in the making, and it seems like we need an upward impulse for a complete wave B inside that daily running flat. So, I'm looking for long trade setups. As you can see, we got a bounce-back, which can be the reversal impulse, after a new low, which can be the end of the wave C. Now, I'm waiting for a correction to place a pending order. If my forecast is accurate, the white line should be broken. That's why I'll probably set my SL under that level. My target is 30 - 32 area.

BTCUSDT/ Medium-TermWinter and Autumn is coming and electricity energy increase because every air conditioner turning off, gradually mining and miner increase and BTC start bullish.
This is just my analysis and not signal for buy or sell.
Good have a profit

AUDCHF Long Trade SetupWe may have a complete correction, and if this is the case, we should have a reversal impulse. Now, I'm waiting for a small correction to place a pending order. The only thing that I didn't like here is the depth of the blue ABC. Even 0.382 retracement level has been reached. Of course, it can be a shallow correction, or we can have a bigger one. We'll see that part, and in the case of the green B, I'll hedge my trade.

EURJPY Short Trade SetupThe red B probably is the end of the monthly expanding flat. Then we got a reversal impulse, and a running flat. The last top can be the end of the 2nd wave, and we may have a reversal structure. That being said, a correction and more upside is still possible. That's why I'm waiting for a small trade setup to place a pending order. I'll move SL to BE at the new low.

SPX500 Short Trade SetupIt isn't one of the best shaped and clear one, but what we have here might be an ending diagonal after an upward impulse for a decade. If this is the case, we should see a downward impulse as the wave A of a yearly corrective structure. So, we can assume that the next wave will be pretty big and fast. That's why I keep looking for short trade setups. If the last top is the end of 5, we should have a valid reversal pattern. I can place a pending order under the last low, but I want to move SL to BE when that low is broken. That's why I'm waiting for a small trade setup after the correction, which is between the yellow lines, to place a pending order. I'll set my SL over the all-time high. If the price starts falling without any trade setup, I'll place an order under the last low.

CHFJPY Short Trade SetupAfter the expanding flat, which ended at blue C, a reversal impulse and correction between the blue lines have come. After the last top, we got a lower degree impulse and a correction between the yellow lines, which seems like a complete one. Then another reversal impulse and correction between the purple lines. The issue is that correction because it seems odd. I think we have two options here. First, we may see a wave up until the yellow trendline for a nicer correction. In this case, I'll wait for a reversal pattern to place a pending order. Second, a correction and more downside. In this case, I'll set an order under the last low.
