Silver huge bull setupbroke down from the trend that most would draw and assume a retracement or even bear however, even with a lower break out of the fib channel it will still be within a setup for a megaphone bull break out. Elliott wave analysis of the megaphone happened to be aligned with a 50% retracement of the December run at the end of wave 4 though this wave passes through the 38.2% at the bottom of the fibs channel meaning it might get stopped out short of the full 50% retrace. The end of Wave 5 indicates a decisive moment for longer bull or bear move however, the bull megaphone pattern combined with the longer timescale wave 5 of the channel/pennant also ending within margin of error at the breakout point does lean towards a further break of the much longer timescale pennant putting targets way up to $2500.
Megaphone
DXY possible support on megaphone supportPrice has been range bound for a while forming a megaphone pattern.
Closest area for a retrace up is imminent if it is going to happen and should be quite aggressive price move.
However, price will fall much more if it breaks down out of this megaphone pattern.
Megaphone Top On S&P 500This is the daily chart of SPY that is displaying, in my opinion, a megaphone pattern that will likely resolve to the downside. As evidence of this being a megaphone pattern is the disjointed trend lines as well as the relatively large volumes that correspond to the "higher highs" and "lower lows." My reasoning for expecting this to be a reversal pattern stems from seeing bearish divergence in a number of indicators- the daily chart displays a bearish cross in the True Strength Indicator and the picture that I've included also shows a bearish trend in the TSI.
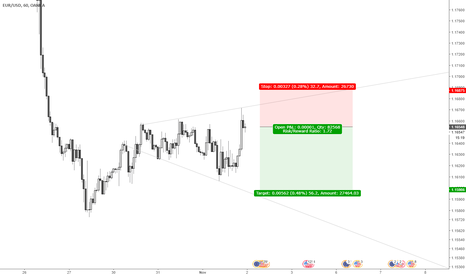
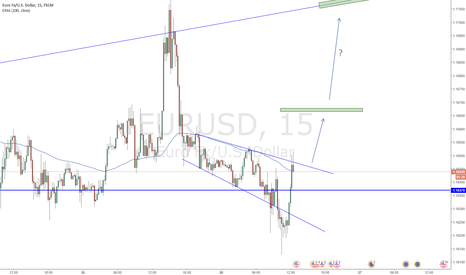
EURUSD Megaphone Looking for a breakout of the megaphone pattern and a retest, but not sure where that will happen, could be just at trend line or 100 EMA in 15 min chart (preferably).
Also possible consolidation in bigger chart, but am cautious because of news later today, therefore will just look for a short term trade ( Megaphone ).
USD/JPY ready to restart?Following recent fears generated largely from Trump's impeachment hypothesis, as we can see from the chart a megaphone structure was formed on this cross, probably indicates an excess of market. We believe, however, that we will have a bullish trend so we are willing to buy, ready to turn in case of breakout below 110 level. Keep track of the levels marked on the chart.
USD/JPY ready to restart?Following recent fears generated largely from Trump's impeachment hypothesis, as we can see from the chart a megaphone structure was formed on this cross, probably indicates an excess of market. We believe, however, that we will have a bullish trend so we are willing to buy, ready to turn in case of breakout below 110 level. Keep track of the levels marked on the chart.
NQ Broadening TopThe NQ is making a broadening top pattern. This is not a bearish or bullish pattern, since it trends upward 49.6% of the time and downward 50.3% of time. It has a nice look, where price was trending upward 6 months leading into the pattern, with downward sloping volume. To pick a top in this market is dangerous, with the low volume grind. I am looking for clear resistance at the top TL, where the previous days low is violated on a strong daily close. However, I believe the markets could try to close towards highs leading into Trump´s inauguration, with price at highs or near them. After that it´s anyones guess. This is also the week before opex, so we could see a Thursday / Friday low? All bs at the moment. However, if next week is like all the other days in the election cycle for Trump, I would not be surprised if next week is an upside bias week. Notes on chart Go to bulkowski for good information on broadening tops at thepatternsite dot com


