My BTC top /new ATH in 2023 & 2024-2025 scenarios!!! BTCUSDT Hi dear community and my loyal followers.
I'm leaving here my highly probable 2 scenarios for BTC top/new ATH in 2023 & 2024-2025.
99% in crypto expect new ATH in 2024-2025 after halving and expect history to be repeated but what if they will be wrong and BTC hits new ATH in 2023 and surprises everyone and enters to long & devastating bear market in 2024-2025 and don't satisfy needs of the herd)). I like doing the opposite what majority expects and go against the herd. But I'm ready for both scenarios))).
As you see on the charts I draw my targets and path for BTC in 2023 and in 2024-2025.
My max target for 2023 will; be 72-85K based on my previous analyses I posted earlier/ They are targets I calculated based on Fib levles, Bullish megaphone chart pattern, Elliott waves etc.
And my max target for 2024-2025 after halving event will be 150-180K again based on fib levels, major trendlines, some secret projections, my experience & chart patterns.
But if BTC hits new ATH in 2024-2025, we'll see huge and deep correction at 48-53K zone and dump to 22-25K zone.
We'll come back to this analyses in couple months or in 2 years))) In any case be prepared for both scenarios. Stay safe and be level headed. I'm bullish in 2023.
If you like my ideas and analyses, don't forget to like, comment, share my ideas, and follow please. I"ll appreciate any single follow and any kind of support.
I wish you good trades and huge profits.
Megaphonepattern

megaphone bottom - bullishPattern identification, bullish view on Nifty 50. upcoming bullish trend as per the pattern. previous view as per bullish flag we have a range to break which confirms that same on this pattern too.

SPY & QQQ 15m Trend Change Back to Bulls, Need 1h trend change - After this mornings hourly bear flag with no follow through from bears bulls try to play defense and we had a megaphone pattern play out in the morning.
- QQQ was holding SPY up for the entire day, then the last 30mins bear sectors in SPY joined Bull sector QQQ.
- need to confirm a hourly uptrend to set the daily higher low for bulls.
- would like to see bulls play offense tomorrow.

AUDUSDHi
AUDUSD has been examined in different dimensions:
1- Strong supply and demand levels that I identify with my own indicator and system.
2- The structure of recently formed waves
3- Current market momentum
4- The structure of classical and price patterns
In this idea, I identified the direction of the market in different ways and in the second step, I analyzed the potential of continuation or reversal. Usually, paying attention to the trend and strength of the trend can greatly increase the accuracy of the analysis.
In general, I tried to describe the continuation of the movement in the simplest possible way in the diagram.
⚠️ Disclaimer:
This is a personal opinion and you are responsible for any trading decisions.

USDJPY********************MEGAPHONE PATTERN********************
This is a personalized analysis based on trends, strength of drives and potential moves.

$MRNA - Moderna: Megaphone TopOn weekly we can see that the price has formed a long-term Head&Shoulder, where its right shoulder is a Megaphone Top.
Price is hugging & kissing its upper trendline, which is also an area of a perfect entry to go SHORT, as there is a very small risk compare to a very big reward.
I will be looking and patiently waiting for a Key Reversal from upper trendline to go SHORT.

SPY Breakdown Reversal out of Megaphone PatternSPY has been in an erratic uptrend since October. on the 2H chart,
It is now in a megaphone pattern with more touches of the lower support
trendline than touches of the upper resistance trendline.
This suggests a breakdown out of the pattern.
The MACD shows the lines below zero and the MACD about to cross under
its signal.
Price is about to break under EMA200 which may be considered
a support and so the initiation of a downtrend out of the pattern,
This appears to be a good setup to short the SPY or buy put options
all while waiting federal news later this week.

MEGAPHONE PATTERN ...!!!!! UP?????Hello, everybody! If you like the concept, don't forget to like and follow it.
T he megaphone and cup pattern's development began with the price.
Please show your support for me by liking and following my ideas.
Also, let us know what you think in the comment section.

BTC bullish megaphone pattern with double bottom +RSI breakoutHi dear community. I'm looking at weekly timeframe. As you see there is a huge megaphone bullish chart pattern on BTC chart, its target I published on my previous analyses.
I think the recent dump to 15.5K is a fake breakdown/bear trap/ with double bottom + RSI bullish divergence like 2021 November top, which was a false breakout/bull trap/ with double top+ RSI bear div.
So I think the real bottom was at 17.5K in June like the real top in 2021 April.
I'm considering that BTC has succeeded to break RSI diagonal trendline and now It is making a retest, I think it will hold and send BTC to 28-30K. On chart you can find my explanation why I think RSI diagonal resistance has broken.

BTC bullish megaphone pattern with 80-85K targetI'm looking at weekly timeframe. As you noticed BTC formed bullish megaphone pattern with 80-85K target by Q2 2023. BTW there is also falling wedge pattern inside megaphone pattern which increases bullish case scenario. King of crypto broke weekly RSI trendline which is historical for BTC. At the moment BTC has broken weekly descending triangle with 24-25K target, so all my predictions based on my analyses posted since June 2022 are right. I told you BTC bottom was in at 17.5K on 18.06.2022 and I haven't changed my idea since then.
Do you believe new ATH in 2023 or not? Comment bellow, check all my analyses bellow related ideas and if you like my analyses and ideas please follow me.

Is Huobi Token Megaphone Pattern Bullish or Bearish?Over the past 3.5 months, Huobi Token (HT) has been developing a megaphone pattern, also known as the broadening pattern. The pattern is neither bullish nor bearish, but it hints at a period of heightened volatility as long as HT's price remains trapped inside the megaphone support and resistance levels.
HT Megaphone Pattern
The megaphone pattern can be recognized by successive higher highs and lower lows. On the price chart, this pattern is visible by two diverging trendlines. Usually, the pattern marks a period of high volatility with no clear market direction.
HT's price is testing the upper resistance trendline of the megaphone pattern around the $7.10 level.
RSI Oscillator
After the recent sharp rally, HT's price is greatly overbought. The Relative Strength Index (RSI) has reached 84, its highest reading since February 2021. Fears of the rally losing momentum are justified, as other technical factors are calling for a pause.
Aside from extreme overbought levels, HT's price is also battling the key 200-day simple moving average.
200-Day Simple Moving Average
While we broke above the 200-day simple moving average, it remains to be seen how this will play out within the megaphone pattern. For a fundamental shift in the market sentiment, we need multiple daily closes above the 200-day SMA.
The current daily candle already shows signs of rejection at the megaphone resistance trendline, which may be another sign that, in the short term, the bullish momentum is running out of steam.
Looking forward: To the downside, the first support area is the $5.00 big psychological level. A daily break and close below $5.00 will eventually open the door for a retest of the lower support trendline.

WBD Megaphone Bearish megaphone forming here for WBD.
Look for a breakout below 12.23
Possible move down to 11.50 followed by a move to 10.50 support
Set stop loss around 13.53 swing high
This is not financial advice. Good luck!

COIN LONG = Ascending Megaphone PatternNASDAQ:COIN
COIN downrended from November 2021 to later July
loosing 85% of its price along the way. Having completed
its reversal, it is now up trending in a megaphone pattern
reflecting increasing volatility. Relative volume has increased.
I have plotted in mid-Fibonacci levels.
I see this as a swing long setup, and will take the trade
setting up the stop loss as the market low late July.
Targets include the Fibonacci levels as well as where
price hits the mid=line of the megaphone where it could
break through or bounce in this high volatility zone.
I will leave a runner to see if price can eventually reach
the late 2021 price level especially if the crypto market
undergoes a resurgence.

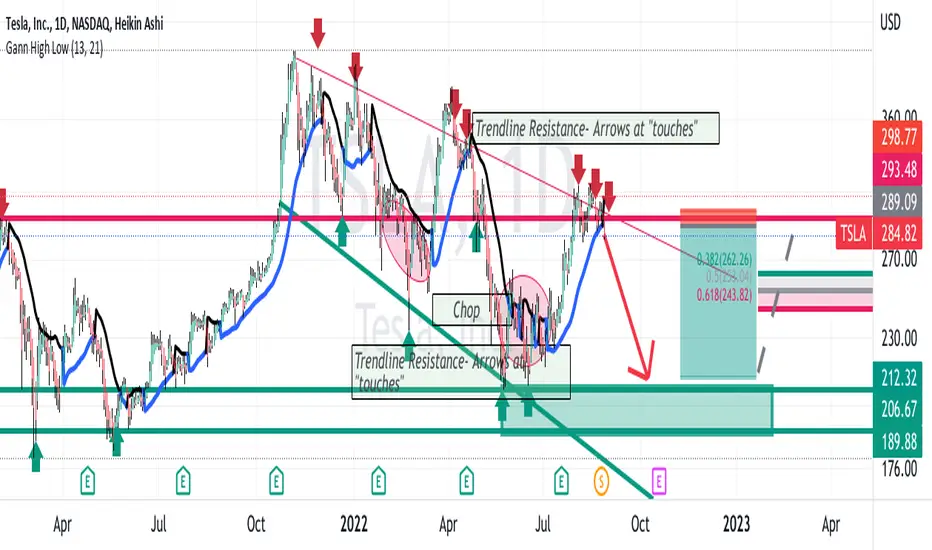
TSLA descending widening channel MEGAPHONE SHORT NASDAQ:TSLA
TSLA on the daily chart has a megaphone pattern showing increasing volatility as the price action is downward.
Supportive and resistance trendlines are touched multiple times. At present, the price is also at a horizontal S/R line being the 2021 year high.
Another horizontal line is the double bottom of Spring 2021 forming a support zone.
My analysis is that TLSA will downtrend from here heading down until the mid-Fibonacci
retracement levels and perhaps further to support zone at 188-208 and potentially lower
if short sellers aggressively gain directional momentum.
I have taken an out-of-the-money put option with a strike of $ 200 for October 21st mindful of the earnings date.
POTX a cannabis ETF is a siwng LONG Setup ( ACB MJ TLRY)POTX as shown on the 30 minute chart
is showing an ascending megaphone pattern,
a reflection of increased volatility,
The price is sitting on the lower megaphone support line
and the RSI shows weakness.
Green up arrows show each time the price has touched the
support line it has reversed to the upside. The same for the RSI.
I see this an an excellent swing long setup with a target
of about $22 or 25% in a diversified EFT allowing for
a bit of risk mitigation.

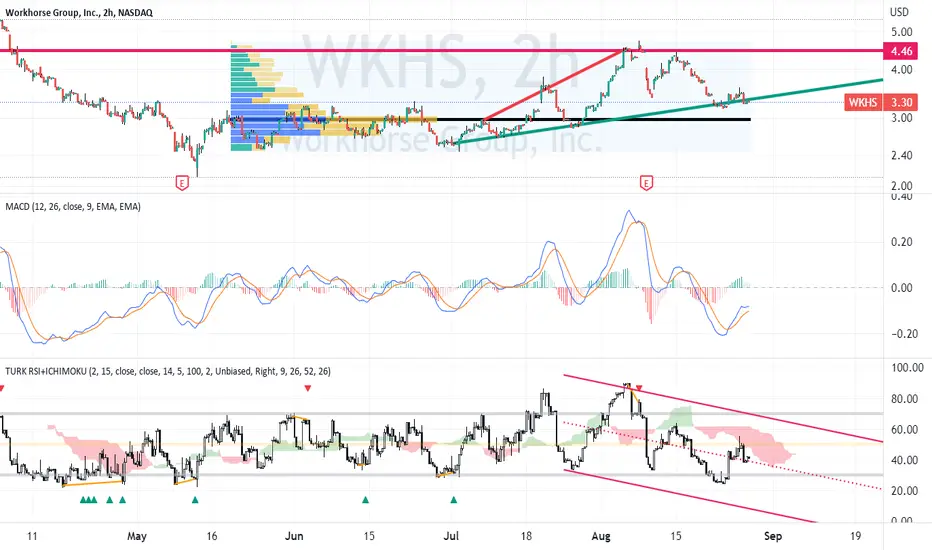
WKHS LONGWKHS on the 2H chart is showing an ascending megaphone pattern.
Price is currently sitting on the ascending support line and above the POC of the volume profile.
The MACD lines are underneath the histogram while the RSI is in the mid-range.
I see this as a swing long setup targetting first the top of the volume profile
and then the upper resistance trendline The upside is 30 and 50 % respectively
making it a low risk when placing a stop loss at 3.22 the swing low from the beginning
of the week. A xll option trade with a strike of $3.50 for September 16th is also considered.
MATICMATIC log weekly chart shows that we are in W4 now or finished with W4. Inside a mega bull mega phone pattern with the bottom TL showing .08c as a capitulation target that would only get tested if BTC nukes to $7k & top TL around $39 which also seem very unlikely. Most likely wave 4 is finishing up and we can extrapolate W1 to overlay the coming 5th wave target and look for $5 for a conservative wave 5 top. If FOMO hits the 2.618 fib level is at $8.20

ROP Large Broadening MegaphoneA large Megaphone structure is apparent on ROP
This pattern has been continuing since 2013
Price will likely stay within this megaphone due to its age, meaning a move down on this 9H chart
Long term however this pattern is very bullish

BSEAll details are given on chart. If you like the analyses please do share it with your friends, like and follow me for more such interesting breakout charts.
Disc - Am not a SEBI registered. Please do your own analyses before taking position. This post is only educational purposes and not a trading recommendation.

Unity +300% UpwardsHi Traders,
Unity being (one of the) wheels for an upcoming VR&AR revolution, this stock might be trading around 3x to it's current price in few years (maybe next).
An expanding triangle (megaphone) pattern suggests we are at the lower band now which is a good entry for buying opportunity. We might see some pressure at 160-170 which is 61,8 FIB and a DEC 20resistance level. Short opportunity is waiting there.
Good luck.
TONY

BTC: Simple trade idea (Long and ShortHere is my idea that came up out of my mind after analyzing BTC chart.
The idea is that BTC is currently moving in a megaphone pattern.
A long trade is currently active and if it ever follows my path. The short trade will be initiated too.
All details explained on the chart
Don't mind commenting your thoughts

CAN Megaphone and Wyckoff Accumulation PatternCAN is printing a Broadening Bottom Megaphone pattern on the CAN daily chart; the RSI looks to be increasing on the price lows indicating increased momentum.
Zooming out it also looks like an accumulation pattern has been forming over the past several months.
The megaphone may work as the "Spring / Test" stages for Phase C if it plays out and bring the price back up into the recent trading range.
If the Megaphone breaks down, then it may be a take a while to climb back.
I am not a financial advisor or professional trader by and stretch, so please do your own research.

SPX500USD MEGAPHONE PATTERN AND FIBONACCI RATIOS SPX500USD has formed a megaphone pattern on its daily chart.
The price has rejected the mid range MID RANGE 4410.0.
Megaphones patterns tend to reverse the prices trends in 5 wings.
Fibonacci extension tool is used to determine potentials targets to the downside.
TP1 4068.7 61.8% SYMMETRY ABC
TP2 3892.0 78.6% SYMMETRY ABC
TP3 3619.9 100% SYMMETRY ABC
