$DOW Jones is at important technical point.Wave 5 is complete and we are at the crossroads. On one side we are in the midst of the destruction of the dollar and starting stages of hyperinflation, on the other side so many dumb "investors" are trying to play the market and they have no clue what they are doing. Margin debt levels are at the highest level in history, the crowd is so convinced that this time it is different and they are always get wiped out. It will be interesting to see how things will develop. In any case, If you are smart you will make money.
Megaphonepattern


AUD-CAD Correction from resistance! Sell!
Hello,Traders!
AUD-CAD is trading in a bullish megaphone pattern
However, we never know when will the megaphone breakout
Therefore, since now we are seeing clear bearish signals on the pair
Which are the double top formed below the resistance confluence
We will expect the pair to fall locally to the nearest support
Local Short
Sell!
Like, comment and subscribe to boost your trading!
See other ideas below too!

$amd - megaphone patternthis decided to take its sweet time, but looks like it's ready. if earnings go well, we should see a nice move to the top of the megaphone then potentially higher.

ETH Sell High, buy LowIn Theory, also using BTC Dominance chart to support this. Eth looks as though it has had 3 waves up, and seeing if it has peaked against BTC, looking to confirm with a move down below 0.04000 to confirm megaphone pattern on the pair.
Will consider starting a pattern of converting back into ETH mid-way through the megaphone, or lower if it is offered. Have been converting from ETH to BTC all the way up, sold as much ETH as I care to at this point, core position still has plenty in the bag to spare.

Bitcoin special analysis!! CHECK THIS ONE OUT 😍° BTC
Good evening everyone, a second update of today, I posted earlier the support levels of the falling BTC! I just wanna give an update, since October 2020 Bitcoin was in a so called megaphone as you can see on the first pic!📣 The upper part of the megaphone was acting a resistance and was tested 5 times!!
Right now, there's a chance that this megaphone resistance will act as support, which it is right now! (zoomed in on the second page) Lets all hope for the best because honestly, we just wanna see the 50k ASAPP!!! 😍😍

S&P500 Holding Above Broadening Wedge, FibsThe S&P 500 Index(SPX) closed Friday at $3,768.26, down -56pts(-1.5%) on the week. Price marked its 8th weekly close above the upper line of the yellow broadening wedge pattern which for now indicates a successful breakout from the consolidation pattern. After hesitating just below the 127% Fibonacci extension(based on the 18Feb2020 high and the 23Mar2020 low Fibonacci Range) for most of December, price is now trading between the 127%-141% Fibonacci extension levels with the 141% extension being the next target/resistance level if the current wedge breakout sees upside continuation.
Last weeks’ price candle closed as an inside candle(bearish harami) which is where the entire trading range of the candle(upper wick to lower wick) was within the trading range of the candle prior to it. This is considered a bearish pattern when preceded by an overall uptrend in price, but there have been many recently that did not result in moves lower in price. For now price has positive momentum as indicated by the green price candles. In this momentum algorithm price candles are colored green when price has positive momentum, gray when price has neutral or no momentum, and purple when price has negative momentum.
The overall trend and momentum in the S&P 500 are considered to be bullish with a move up toward $3,900 likely as price looks for the next Fib extension to test. Stop-loss orders for trend traders should be placed just below the upper line of the broadening wedge pattern as a return back within that consolidation range would likely lead to more downside pressure on price.

FSLY: GAP FILL IN PLAYBullish set up on Fastly
We have a huge gap to fill and a megaphone pattern.
Let's see if we can go fill that gap and move towards the top of the megaphone.

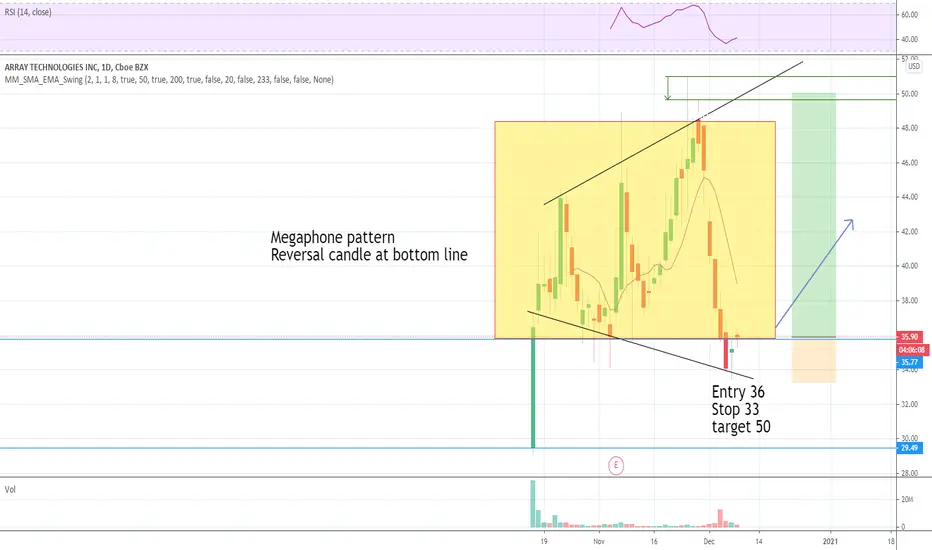
ARRY LongMegaphone pattern
Reversal candle at bottom line
Entry 36
Stop 33
Target 50
I am not a PRO trader. I need few months to practice trading strategies.
If you like this idea, please use SIM/Demo account to try it, until my trading plans get high winning rate.
Viscious Wall Street Bulls on the MEGAPHONE!So, Corona is on everyone's lips but how long will it keep the raging bulls from taking charge?
Any signs of, mitigation measures against the pandemic will provide massive reprieve for the fallen giant DOW Jones!
It may as well have begun....
The image above shows a classic MEGAPHONE in a bullish trend, We have just jumped out of the bear trap, cannot say it's over, but when it does, it will be viscious, the momentum will obliterate the alarms.
I'll be looking to cut my Short positions and prepared to begin the "Long" return home :)
Will you Join me?

Is NEO making a bearish megaphone?Looks like NEO ( BINANCE:NEOUSD ) will retest the previous support, between $4.5 and $7.5 (look at Red box), completing the bearish megaphone, and if the bearish megaphone breaks to the lower side, then it will retest the previous support below that, of $1.89.
Do you agree?
Leave a comment and a like!
Good luck

S&P 500 IndexS&P 500 Index
Mega phone pattern formation
Currently price is around resistance trend line of Megaphone on weekly time frame,,
RSI bearish divergence :- Price is making higher high and RSI is making lower high,,
Time cycle :- Index is making peaks and lows as regular interval of 36 weekly bars,,,
History :- After every bull phase index tends to fall below the low from where the bull move started,, will the history this time,,
Before 30 nov index should top out,, and initial down fall of 10 to 15% can be seen as the reversal of trend,,, and slowly should pan out in down ward direction,,,

14.400& monthly close for BTC- October 20I ussually don't do such short analysys, but today i think we will close around that number. Let's see... On the wider timeframe BTC is in a formation of "megaphone", i belive. Inside that it has broke out of the symetrical triangle and succsessfully retested a breakout. It is now in formation of a bullflag, which will take us hopefully to mentioned number. Sorry bears ;) Well, let's ee...
Cheers!

S&P Megaphone patternSeems like the current S&P market level is seeing the resolution of the megaphone pattern to the downside.
The break below the 3 point was the indication that the pattern is resolving to the short side and heading toward the targets indicated on the chart.
Something I'm not sure of is the bounce in late September; could this have negated this pattern?
Thoughts, comments?

WKHS- The Strat- MegaphoneLooks like a 2-2 reversal on the daily. Looking for the move up to the top of the megaphone next week


AMD- The Strat- MegaPhone ideaLove how you can go back in Tradingview and review your ideas to see how they worked out.
Lets see how this one goes. Inside week for AMD. I'm thinking NEXT week we may break THIS week's high and continue up to the top of the "megaphone."

LendingTree: Bullish Technicals and Fundamentals ExplainedIn this analysis, I'll be providing an in-depth analysis on LendingTree, as well as an explanation on megaphone patterns and its bullish upside.
What is LendingTree Inc.?
Lendingtree (TREE) is a company that offers a platform for borrowers and multiple lenders, offering the opportunity for its users to find the best possible deal on their loans.
Business Model
- Users of TREE gain access to multiple loan offers, and TREE’s clients gain the benefit of a cost-efficient customer acquisition.
- Essentially, LendingTree is a platform where people shop for money.
- Lendingtree works with major banks such as Citibank, Wells Fargo, as well as mortgage brokers, p2p specialty finance institutions, and small businesses.
- Their clients’ pain point is that borrower acquisition is a key constraint to growth.
- They offer a personalized platform called My LendingTree in which users can track their financial credit and performance
- Their cumulative user growth has been increasing at an exponential rate
- One fact many people misunderstand is that LendingTree does not take a markup fee.
- Their revenue comes from the payments made by lenders (their institutional clients), who pay to join the LendingTree marketplace.
- TREE also gets paid by their clients when its users sign up for their loans or services.
- While mortgage loans are their main focus, they are expanding into areas of: personal loans, auto loans, business loans, student loans, credit cards, saving accounts, and home equity loans.
Financials
- LendingTree’s revenue has tripled to $1.1 Billion by the end of 2019, almost triple the revenue of 2016.
- They continue to demonstrate tremendous growth as consumers shop for mortgages over time
- While their revenue was dominantly mortgage based, they have managed to diversify into generating revenue from non-mortgage related loans and services.
- However, their operating expenses have also significantly increased due to huge marketing budgets, and their operating income is not as exponential as their revenue growth
- Their quarterly revenue changes have been showing inconsistencies, and reported negative earnings for 2020 Q2.
- However, the company demonstrates steady and strong free cash flow
Technical Analysis
- We can take a look at TREE’s weekly chart for long term insight
- To begin with, the chart is currently trading within a textbook megaphone pattern
- A megaphone pattern can be a continuation or reversal pattern depending on how prices react near the resistance
- This pattern demonstrates 5 distinct swings, each getting larger than the previous one,
- As demonstrated above, we are currently in the middle of the fifth swing
- We can see that a reverse head and shoulders pattern has been forming since the third swing.
- We have temporarily broken out of the descending trend line resistance (marked by the dotted blue line), and forming what seems to be the right shoulder
- The formation of the right shoulder can also be seen as a bullish flag pattern, where prices are consolidating before a breakout
- On the short term, we are consolidating below the 0.618 Fibonacci retracement resistance.
- We have tested the pivot line support, as prices look to break out
- Even if we see a rejection at the trend line resistance on the fifth swing, there is a 60% upside potential based on the megaphone pattern structure
Conclusion
With the Fed having said that interest rates will remain at near zero, and considering the fact that the US housing market is still in an uptrend, given that we see more recovery in the economy, we could anticipate huge growth for LendingTree as more users seek to get loans. The technicals demonstrated on LendingTree’s chart are also extremely bullish, making this stock a solid mid-term investment.
If you like this analysis, please make sure to like the post, and follow for more quality content!
I would also appreciate it if you could leave a comment below with some original insight.

PINS- Megaphone pattern ideaAn idea for next week.
Although time continuity to the up side the general market is iffy right now.

Cipla good short candidateCipla spot cmp 745
760 to 790 good range to go short
view gets negated above 820 levels on closing basis..
More details on charts of patterns and trend.

DOCU broadensmegaphone-ish broadening, but will consolidate and regather around S2: 174
E: 190 (fib .786 retracement holds)
T1: 216
T2: 225
S: 177.81

Go LONG on USDJPY - MEGAPHONE TRENDUSDJPY megaphone trend formed and we are at support, go long here to the next resistance.
If you like my analysis give your comments and do follow.

All Aboard Gap City, Headed for the Republic of BearistanThis is the general clashing of the trends I'm seeing; which is causing extreme volatility. The megaphone, horn effect on the prices is an indication that the bear trend is stronger. It's going to pull us into the new trend's channel.
