MELANIA Main Trend. Memes with high hype and risk. July 17, 2025Main trend. Time frame 3 days (less is not necessary). Showed conditional levels (zones near them), and percentages of decrease from the maximum (note, I showed from the zone where the main retail of “affected investors” began to connect, that is, the maximum is much lower than on the chart).
Note that now a conditionally large volume “enters”, it is displayed on the price chart (this is important), a sideways squeeze has begun. Local impulse and rollback are now in the moment.
Also showed a large % (intentionally) for orientation, from minimum to maximum zones. On such hype assets, as a rule, medium-term - long-term holding (bought in the right zone) shows significant income.
All level zones are conditional, due to liquidity, but the price will most likely “play” after the breakdown of the downward trend in this range, another alt season (which many do not notice due to the slow breakdown of their opinions, news chaff, and inadequate goals). As for me, above these huge % (resistance zone, or up to 0.869, so as not to waste time), you should get rid of this meme, or its % from the previous position should already be minimal (5-10%).
There are hype zones, there are zones of potential gain (fading hype, interest, and a large % from the maximums). On such assets of "manual trading", where cryptocurrency has no value, it is always sold little by little (many do not understand this), but in order to sell, you sometimes need to make interest, and "instill hope" in previously deceived "investors" who want to get out at least at a loss (it is unlikely to happen). At the right time, 1-2 tweets - statements from the "powers that be" - are pumped up due to low liquidity by a huge percentage.
On such cryptocurrencies, you do not need to guess the “bottom” or maximums. Pricing is formed differently here, as there is no real supply/demand, utility, but only psychology and "hitting the jackpot" of gambling addicts. Be smarter. Diversify such assets, distribute the risk in advance. Make purchases/sales according to plan, without emotions.
When the price goes up, you think it will go much higher, but even if it does, you must sell a certain volume in certain planned zones, without any emotions or sense of lost profit.
Similarly, when the price goes down, people are driven by fear and refuse to buy, and these were probably the minimums of fear.
The average price of the set and reset is important. No minimums and maximums are needed. Be patient and consistent in your actions and plans.
Melania

MELANIA: Divergence, Signal, BaseThis is MELANIA on the 1-day chart.
First, I want to emphasize the bullish divergence on the RSI, which started on April 21, while price continued to drop, RSI held or even moved higher.
Second, although we’re still below the 50MA and the chart doesn’t yet have a 200MA, both systems are long:
• PSAR is bullish
• MLR > SMA > BB Center
Third, it appears a base has been forming since June 27.
All these factors combined led me to open a long position, but of course, this is just my view, not financial advice.
Always take profits and manage risk.
Interaction is welcome.

MELANIA go BOOM?Its purely based on DOM and some internal things i happen to feel! rest you to watch, expecting a small spring for the catchup!

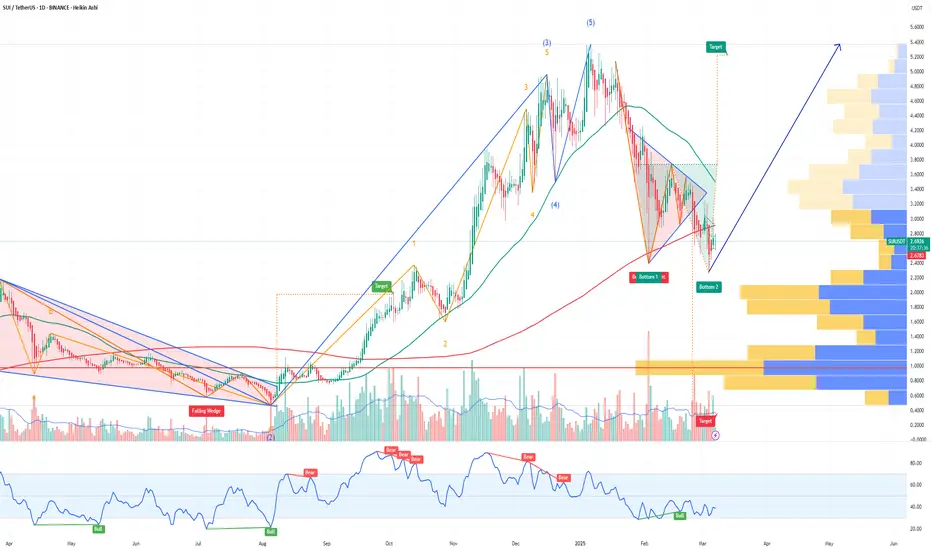
Trump's World Liberty Financial to add SUI to strategic reserve!CRYPTOCAP:SUI , a leading Layer-1 blockchain, has entered into a significant partnership with World Liberty Financial (WLFI), a decentralized finance (DeFi) platform affiliated with Donald Trump.
This collaboration involves integrating Sui's native token (SUI) into WLFI's "Macro Strategy" reserve, a strategic token fund designed to diversify holdings and support emerging blockchain projects.
The partnership also aims to explore product development opportunities leveraging Sui's technology.
WLFI's Macro Strategy reserve already includes prominent digital assets such as Bitcoin, Ethereum, and tokenized real-world assets like U.S. Treasury-backed tokens.
The addition of SUI reflects WLFI's focus on supporting innovative blockchain projects while expanding decentralized finance access to a broader audience.
The announcement of this partnership coincides with broader developments in the U.S. crypto landscape.
President Trump is expected to unveil details about a proposed "Crypto Strategic Reserve" during the White House Crypto Summit on March 7, 2025.
This reserve is anticipated to focus primarily on Bitcoin while also considering other digital assets
Trump-backed World Liberty Financial plans to add SUI to its strategic reserve.
I think the upside for SUI is Huge from here!
TRUMP & MELANIA Collapse - Sh*tcoin Reality CheckIf you had bought BINANCE:TRUMPUSDT or BINANCE:MELANIAUSDT.P at any point during the last three months, you’d likely be deep in loss within just days. These tokens, despite using the names of major political figures, followed a typical memecoin pattern:
🚀 Launch hype → 💰 Speculation → 📉 Massive dump
But here’s what traders need to remember:
🔁 These types of tokens can pump again. All it takes is a tweet, a trending news event, or a post from an influencer or celebrity—think Elon Musk. A spark like that could fuel a rally.
⚠️ However, the risk is extremely high. These projects often lack fundamentals, and the price action is driven mostly by hype and speculation. If you choose to trade them, know your risk tolerance and never overexpose your portfolio.
💡 This is the reality of memecoins. Recognize the pattern, protect your capital, and stay sober in the market.
📊 Follow for grounded insights and market wisdom—no hype, just facts. 🔔

MELANIA Roadmap (4H)It seems that MELANIA is caught in a large bearish Diametric!
A meme coin left to the market!
It appears to be in wave D of this Diametric.
From the supply zone, we expect another rejection toward lower levels.
The closure of a daily candle above the invalidation level will invalidate this analysis.
For risk management, please don't forget stop loss and capital management
Comment if you have any questions
Thank You

MELANIA Hi,
It failed its first initial breakout, retested the trend and we are currently witnessing a move higher.
I have moved my SL to entry to make it a risk free trade while the FOMC is going ahead later today.

MELANIA Looks Bearish (1H)The situation with the meme coin MELANIA doesn't look good.
There is limited data available for this meme coin, but on the chart, 3 ABC waves of a pattern can be identified.
If wave C drops to the 0.618 or 0.786 Fibonacci levels of wave A, it may reach the specified targets on the chart.
The chart currently lacks a trigger for entering a position.
For a sell/short position, it's better to wait for the price to reach the red zone. For a buy/long position, we need to see reversal patterns along with confirmations.
For risk management, please don't forget stop loss and capital management
Comment if you have any questions
Thank You

MELANIA - TIME FOR PAYBACK!WHAT a RUG! Its not less than a rug! But play like the whales! Added 4hour chart where Ive marked a bottom green box where you can actually do buy it, till two stops, red and oranges!!

MELANIA coin from Top to BottomMELENIA coin from Top to Bottom
should we call this a big scam?
I hope you didn't get caught (loss to the coin) with this coin.

Long idea on $TRUMPI understand the nature of this instrument; it is volatile enough to wipe out anyone. Considering all factors—there's FUD, there's trash, and prices are low. Time to test the theory of probability

Bullish on $MELANIA1. We have MSS illustrated by the lightbulb icon
2. We have market respecting and finding support at the reclaimed orderblock
3. We have buyside draw and OTE OB- to reach
This is a mean reversion setup

MELANIA - Be MelancholyEQH is there means its going to hit up liqui shorts, but when they do this, you know what to do! Just dont blank longs!!!!!!!!! PLEASE!

#MELANIAUSDT further bearish movement!📉 SHORT BYBIT:MELANIAUSDT.P from $1.420
🛡 Stop Loss: $1.440
⏱ 1H Timeframe
✅ Overview:
➡️ BYBIT:MELANIAUSDT.P continues its bearish trend, failing multiple times to break above resistance $1.469.
➡️ POC at $1.469 indicates a strong liquidity zone, acting as resistance and reinforcing bearish pressure.
➡️ The price broke below $1.424, confirming further downside momentum.
➡️ The next key support level is $1.380, which is the primary target for this short setup.
⚡ Plan:
📉 Bearish Scenario:
➡️ Enter SHORT from $1.420 , as the price continues its decline.
➡️ Manage risk with Stop-Loss at $1.440 to protect against a potential reversal.
➡️ Main downside target:
🎯 TP Target:
💎 TP1: $1.380 — the nearest support level for profit-taking.
📢 If the price BYBIT:MELANIAUSDT.P remains below $1.424, the downtrend is likely to continue.
📢 However, a move back above $1.440 could invalidate the short setup.
🚀 BYBIT:MELANIAUSDT.P Expecting further bearish movement!

TRUMP vs MELANIA! Dont do the same mistake!Tired of getting liquidated when melania coin plays with you with a dead cat bounce? Change stances do shorts till 0.950 to 0.750! What a day what a hype! Trump is just getting ready to get some buyers, expecting a hyped move to $35 to fall to $10 lol! Just mark my words here!

MELANIA - A Big NO!Please! NO to MELANIA, unless some news comes out, its a clear dead cat bounce to eat your liquidity! I said if you anticipate a news, then can do things as such to play but its a clear Dead cat bounce. Stances marked.

$TRUMP Coin Tanks 80% from All-Time High – What's Next?Market Overview
The $TRUMP coin, a Solana-based meme token inspired by former President Donald Trump, has seen a dramatic decline, shedding nearly 80% of its value from its $75.35 ATH recorded on January 19, 2025. The coin, which launched on January 18, 2025, skyrocketed overnight, attracting traders eager to capitalize on its meteoric rise. However, a lack of development and utility has raised concerns, leading to a rapid sell-off.
Technical Analysis
As of the time of writing, $TRUMP is trading at $17.75, marking a 17% decline in 24 hours. The Relative Strength Index (RSI) stands at 31, signaling oversold conditions. While this hints at a potential buying opportunity, the coin remains highly volatile.
Key Technical Levels:
- Immediate support: $17.00 (psychological support)
- Major support: $15.00 (next critical level in case of further decline)
- Resistance: $25.00 (short-term bounce potential)
- Bullish breakout: A reversal above $30 could reignite bullish momentum
With major exchanges like Binance, Coinbase, and Kraken listing $TRUMP, the coin remains highly liquid, but whether it can reclaim its previous highs remains uncertain.
Fundamental Analysis
Despite its steep decline, $TRUMP maintains a market cap of $3.55 billion, securing a CoinMarketCap ranking of #34. It has a circulating supply of 200 million tokens with a max supply of nearly 1 billion, which could lead to future dilution concerns.
The token's price action has been largely speculative, driven by hype rather than tangible fundamentals. The lack of a defined roadmap, development plans, or intrinsic utility poses significant risks. However, its **strong meme appeal and cultural relevance** continue to attract traders.
Future Outlook
While some traders expected $TRUMP to reach $100, the current price action suggests a prolonged consolidation or further decline unless new catalysts emerge. The token’s fate depends on market sentiment, potential utility developments, and broader crypto trends.
Key Considerations:
✅ Oversold RSI – Possible short-term bounce
⚠️ No intrinsic utility – High risk, purely speculative
📉 High volatility – Not for the faint-hearted
Final Thoughts
$TRUMP coin's meteoric rise and steep fall highlight the high-risk nature of meme tokens. While its presence on major exchanges adds credibility, the lack of fundamental value makes it highly unpredictable. Traders should exercise caution and manage risk appropriately, as the next move for $TRUMP remains uncertain.

Is This the Bottom? MELANIAUSDT at a Critical Turning PointThe Market is at a Crossroads – What Comes Next?
Twelve days ago, MELANIAUSDT.P stood at its absolute high of $14.496, but since then, it has collapsed an astonishing 87.1%, currently trading near its absolute low of $1.865, which was just set today.
The sell-off has been relentless, but is the market about to reverse? Technical indicators are signaling extreme oversold conditions—RSI(14) at 25.23, deep into the danger zone where price often finds a local bottom. The MFI(60) also hovers at 30.98, confirming weak buying pressure, but with a potential for reversal.
Despite this, the asset remains below its key moving averages (MA50 at 2.115, MA100 at 2.252), meaning bulls have significant resistance ahead. Short-term price action is dominated by volume spread analysis (VSA) patterns, showing alternating waves of aggressive buying and selling.
Is this the moment for buyers to step in, or will we see another leg down before any real recovery? With resistance sitting at $1.988 and $2.086, a breakout above these levels could ignite a rapid short squeeze.
Time is ticking—will the market hold this level, or is another flush-out incoming? Stay tuned.
MELANIAUSDT Roadmap: Tracing the Market's Footsteps
Tracking the Market Moves: Key Confirmed Patterns
The price action of MELANIAUSDT has been a rollercoaster, with alternating surges of buy and sell volume dictating the flow. Let’s break down the confirmed patterns that shaped the recent market landscape.
Phase 1: The Build-Up – Buy Side Takes Control
January 27, 08:00 UTC – "Increased Buy Volumes"
Direction: Buy
Open: 2.358 | Close: 2.446 | High: 2.55
Buyers stepped in hard, pushing MELANIAUSDT to $2.55, signaling bullish momentum. This pattern held strong as price action followed through.
January 29, 19:00 UTC – "VSA Manipulation Buy Pattern 4th"
Direction: Buy
Open: 2.3 | Close: 2.309 | High: 2.349
The price maintained upward movement, proving the prior bullish pattern was valid.
Phase 2: The Reversal – Sellers Take Charge
January 29, 18:00 UTC – "Increased Sell Volumes"
Direction: Sell
Open: 2.317 | Close: 2.3 | Low: 2.224
Despite an earlier bullish run, sellers regained momentum, pushing prices lower.
January 31, 15:00 UTC – "VSA Manipulation Sell Pattern 4th"
Direction: Sell
Open: 2.086 | Close: 2.105 | Low: 2.086
The sell-off gained further traction as the price failed to recover above key resistance levels.
Phase 3: The Last Stand – Bullish Bounce Attempts
February 1, 00:00 UTC – "Increased Buy Volumes"
Direction: Buy
Open: 1.935 | Close: 1.936 | High: 2.021
Price briefly bounced, testing $2.021, but lacked follow-through strength.
February 1, 01:00 UTC – "Buy Volumes Takeover"
Direction: Sell
Open: 1.936 | Close: 1.921 | Low: 1.916
Buyers lost the battle, confirming further downside pressure.
What’s Next?
The current technicals suggest we are at a make-or-break point. MELANIAUSDT is hugging its absolute low at $1.865, with resistance lurking at $1.988 and $2.086. The market’s next move will likely depend on whether buyers can reclaim lost ground or if sellers continue to apply pressure.
Stay sharp, watch for volume confirmation, and manage risk accordingly!
Tracking the Market Moves: Key Confirmed Patterns
The price action of MELANIAUSDT has been a rollercoaster, with alternating surges of buy and sell volume dictating the flow. Let’s break down the confirmed patterns that shaped the recent market landscape.
Phase 1: The Build-Up – Buy Side Takes Control
January 27, 08:00 UTC – "Increased Buy Volumes"
Direction: Buy
Open: 2.358 | Close: 2.446 | High: 2.55
Buyers stepped in hard, pushing MELANIAUSDT to $2.55, signaling bullish momentum. This pattern held strong as price action followed through.
January 29, 19:00 UTC – "VSA Manipulation Buy Pattern 4th"
Direction: Buy
Open: 2.3 | Close: 2.309 | High: 2.349
The price maintained upward movement, proving the prior bullish pattern was valid.
Phase 2: The Reversal – Sellers Take Charge
January 29, 18:00 UTC – "Increased Sell Volumes"
Direction: Sell
Open: 2.317 | Close: 2.3 | Low: 2.224
Despite an earlier bullish run, sellers regained momentum, pushing prices lower.
January 31, 15:00 UTC – "VSA Manipulation Sell Pattern 4th"
Direction: Sell
Open: 2.086 | Close: 2.105 | Low: 2.086
The sell-off gained further traction as the price failed to recover above key resistance levels.
Phase 3: The Last Stand – Bullish Bounce Attempts
February 1, 00:00 UTC – "Increased Buy Volumes"
Direction: Buy
Open: 1.935 | Close: 1.936 | High: 2.021
Price briefly bounced, testing $2.021, but lacked follow-through strength.
February 1, 01:00 UTC – "Buy Volumes Takeover"
Direction: Sell
Open: 1.936 | Close: 1.921 | Low: 1.916
Buyers lost the battle, confirming further downside pressure.
Technical & Price Action Analysis
Key support and resistance levels define the battlefield for MELANIAUSDT. If these levels fail to hold, expect them to flip into resistance zones, making upside moves harder.
Support Levels:
1.863 (Critical last low, any break could mean fresh downside)
Resistance Levels:
1.988 (Immediate overhead resistance, must break for bullish momentum)
2.086 (Key level, reclaiming it opens more upside room)
3.306 (Far target, but if bulls wake up, it’s the next big hurdle)
Stay sharp, watch for volume confirmation, and manage risk accordingly!
The price action of MELANIAUSDT has been a rollercoaster, with alternating surges of buy and sell volume dictating the flow. Let’s break down the confirmed patterns that shaped the recent market landscape.
Phase 1: The Build-Up – Buy Side Takes Control
January 27, 08:00 UTC – "Increased Buy Volumes"
Direction: Buy
Open: 2.358 | Close: 2.446 | High: 2.55
Buyers stepped in hard, pushing MELANIAUSDT to $2.55, signaling bullish momentum. This pattern held strong as price action followed through.
January 29, 19:00 UTC – "VSA Manipulation Buy Pattern 4th"
Direction: Buy
Open: 2.3 | Close: 2.309 | High: 2.349
The price maintained upward movement, proving the prior bullish pattern was valid.
Phase 2: The Reversal – Sellers Take Charge
January 29, 18:00 UTC – "Increased Sell Volumes"
Direction: Sell
Open: 2.317 | Close: 2.3 | Low: 2.224
Despite an earlier bullish run, sellers regained momentum, pushing prices lower.
January 31, 15:00 UTC – "VSA Manipulation Sell Pattern 4th"
Direction: Sell
Open: 2.086 | Close: 2.105 | Low: 2.086
The sell-off gained further traction as the price failed to recover above key resistance levels.
Phase 3: The Last Stand – Bullish Bounce Attempts
February 1, 00:00 UTC – "Increased Buy Volumes"
Direction: Buy
Open: 1.935 | Close: 1.936 | High: 2.021
Price briefly bounced, testing $2.021, but lacked follow-through strength.
February 1, 01:00 UTC – "Buy Volumes Takeover"
Direction: Sell
Open: 1.936 | Close: 1.921 | Low: 1.916
Buyers lost the battle, confirming further downside pressure.
Technical & Price Action Analysis
Key support and resistance levels define the battlefield for MELANIAUSDT. If these levels fail to hold, expect them to flip into resistance zones, making upside moves harder.
Support Levels:
1.863 (Critical last low, any break could mean fresh downside)
Resistance Levels:
1.988 (Immediate overhead resistance, must break for bullish momentum)
2.086 (Key level, reclaiming it opens more upside room)
3.306 (Far target, but if bulls wake up, it’s the next big hurdle)
Trading Strategies Based on Rays
The concept of Rays from the Beginning of Movement offers a unique perspective in technical analysis. These rays, built on Fibonacci and geometric principles, help define dynamic levels that guide price movement. Instead of static levels, rays adjust dynamically, ensuring a more adaptive trading approach.
Optimistic Scenario:
If the price interacts with 1.863 and holds, the first target would be 1.988, the second 2.086, and the third 3.306.
Moving Averages confirmation above these levels can signal a continued bullish push.
Pessimistic Scenario:
A breakdown below 1.863 flips it into resistance, opening the path to new lows.
Bearish confirmation via VSA rays and moving averages crossovers would solidify this outlook.
Potential Trades:
Long Entry at 1.863: Targeting 1.988 with a stop below 1.850.
Breakout Trade above 2.086: Aiming for 3.306, stop-loss near 2.000.
Short at Resistance Rejection (1.988-2.086): Stop above the level, targeting previous support.
Watch for interaction with rays before entering trades—these levels define the battleground where market players decide the next big move!
If you have any questions, drop them in the comments! Let’s discuss potential setups, share insights, and improve our trading decisions together. 🚀
Don’t forget to Boost this idea, save it, and check back later to see how price respects the levels I’ve marked—because understanding reaction zones is everything in trading!
My proprietary indicator automatically maps out all rays and levels, but it’s available only in Private Access. If you’re interested in using it, send me a message.
I also provide custom technical analysis on any asset you need. Some analyses I share for free, while others can be private if you don’t want your setup made public. Let’s discuss your request!
Rays work on all assets, and price moves accordingly. If you want a markup for a specific asset, make sure to Boost this post and write in the comments—I’ll do my best to cover it!
Make sure to follow me on TradingView so you never miss a new analysis. All updates and ideas are posted here first! 📈🔥

Melania/USDT Box Range Setup
Melania is currently trading within a well-defined box range, consolidating before the next potential move. If it holds within this structure, we can expect a breakout soon. I’m targeting $3 in the next move, but patience is key.
For now, it’s crucial to watch how price reacts at key support and resistance levels. A dip within the range could be a buying opportunity, but always manage risk accordingly.
Not financial advice, do your own research.

Mrs President Melania! We Traders for you!!Yeah show your poweer!! Again in a pretty make or break where breaking would lead it to $1.95 and breaking it oh god yes please 3.22 is what you shall pray to break it for.

Trump Coin: Bearish Signals and Double Bottom AheadAs of January 25, 2025, Bitcoin (BTC) is trading at approximately $102,378, exhibiting bearish tendencies. This downturn is influencing altcoins, including Trump Coin (TRUMP), which is currently priced around $27.14.
Technical Analysis of Trump Coin (TRUMP):
Head and Shoulders Pattern: On higher timeframes, TRUMP has formed a head and shoulders pattern, a classic bearish indicator suggesting potential downward movement in the mid-term.
Double Bottom Support Level: The anticipated decline may lead TRUMP to revisit its previous double bottom support around the $5 mark.
Short-Term Bullish Spike: Before reaching the $8.80 support level, a brief bullish surge towards $12.544 is expected, possibly offering short-selling opportunities.
Supporting News and Market Sentiment:
Recent developments have contributed to the bearish outlook:
Regulatory Concerns: President Donald Trump's executive order to establish a task force for proposing new cryptocurrency regulations has introduced uncertainty, leading to market declines.
Meme Coin Volatility: The launch of TRUMP and MELANIA meme coins saw initial surges followed by significant crashes, highlighting the speculative nature of these assets and raising concerns about their impact on the broader crypto market.
Given these factors, traders should exercise caution. Monitoring key support and resistance levels, along with staying informed about regulatory developments, is crucial for making informed decisions regarding TRUMP and the broader cryptocurrency market.

MELANI- Chart - Identifying Bearish Trend and Potential TradeMELANIA/USDT Chart Analysis
Greetings, let's take a closer look at the MELANIA/USDT chart and unpack the key details:
Overview
The chart displays an interesting pattern - a clear descending channel formation with lower lows and lower highs over the past few days. This suggests a strong bearish momentum in the MELANIA MEME.
Key Levels
1. Resistance: The yellow descending trendline acts as a key resistance level. Breaking above this trendline could signal a potential trend reversal.
2. Support: The zone around $2.65 appears to be an important support area. A break below this could lead to further downside.
3. Stop Loss: Given the bearish structure, a stop loss order placed slightly above the previous swing high at $2.5 would be prudent.
Price Targets
1. TP1: $6.3 - This level represents the 61.8% Fibonacci retracement of the recent downswing.
2. TP2: $7.2 - This is the 78.6% Fibonacci retracement, which is a common target for bullish reversals.
Trading Strategy
Based on the current chart structure, a bearish bias is warranted. A potential trading opportunity could be:
Entry: Short on a break below the $2.6 - $2.8 support zone.
Stop Loss: Slightly above the previous swing high at $2.5
Take Profit 1: $6.3
Take Profit 2: $7.2
It's important to note that the crypto market is highly volatile, so proper risk management is crucial. Always do your own research and analysis before making any trading decisions.

First Lady - Melania's Analysis!So breaking yellow line invites more flow down, ideally pattern drawn what cam happpen!!!
