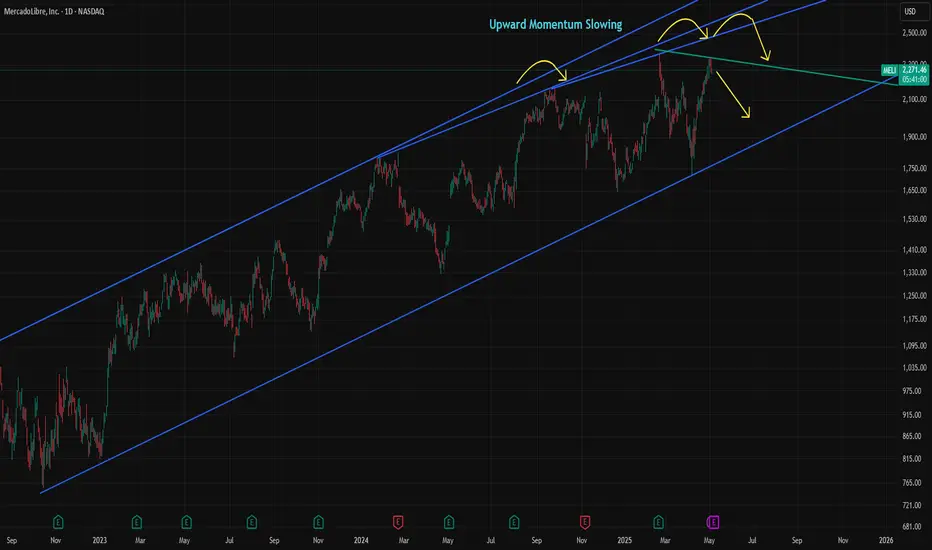
MELI at Risk from Momentum Shift and High ValuationMELI has gained over 35% since the April dip, but momentum has been fading since September. The slowdown has become increasingly visible, and last week's high may remain the top for some time unless Wednesday’s earnings report surprises the market on the upside.
The consensus estimate for MELI’s revenue is $5,497.05 million, representing a 26.86% year-over-year increase but a 9.27% decline quarter-over-quarter. MELI is currently trading at a forward P/E of 41.9x, which is significantly higher than the 19.8x average of comparable companies. Its geographic advantage over U.S.-based peers gave MELI an edge in April, but without strong earnings to support the high valuation, the stock could become vulnerable.
Over the past five years, MELI averaged 56.2% annual sales growth. That figure is expected to fall to an average of 22.1% over the next three years, which remains solid but signals a clear deceleration.
MELI could move more than 7% on earnings day, depending on the report. If the stock falls below 2,000, it may present a buying opportunity. However, the loss of momentum is usually a negative signal for sustaining trends, so the risk of buying the dip is higher than before.
MELI
MERCADOLIBRE ($MELI) SOARS IN Q4—E-COMMERCE & FINTECH SHINE MERCADOLIBRE ( NASDAQ:MELI ) SOARS IN Q4—E-COMMERCE & FINTECH SHINE
(1/9)
Good evening, Tradingview! MercadoLibre ( NASDAQ:MELI ) is sizzling—Q4 revenue up 37%, a $ 6.1B haul 📈🔥. Fintech and e-commerce fuel a 33% surge—let’s unpack this Latin dynamo! 🚀
(2/9) – REVENUE RUSH
• Q4 Take: $ 6.1B—37% leap, tops $ 5.9B est. 💥
• EPS: $ 12.61—blasts past $ 7.94 hopes 📊
• Net Income: $ 639M—beats $ 402M dreams
NASDAQ:MELI ’s humming—growth’s got zing!
(3/9) – BIG MOVES
• GMV: $ 14.5B—56% jump FX-neutral 🌍
• Payments: $ 58.9B TPV—49% up 🚗
• Credit Boom: $ 6.6B—74% growth 🌟
NASDAQ:MELI ’s flexing muscle—full throttle!
(4/9) – MARKET VIBE
• P/E: ~60—above Amazon’s 40, PDD’s 20 📈
• Growth: 37% smokes peers’ 10%
• Targets: 2,400−3,000—10-38% upside 🌍
Premium price—worth the juice?
(5/9) – RISKS ON DECK
• FX Woes: Brazil, Mexico currencies wobble ⚠️
• Comp: Amazon, locals eye the prize 🏛️
• Rates: $ 6.6B credit—defaults lurk? 📉
Hot run—can it dodge the heat?
(6/9) – SWOT: STRENGTHS
• E-comm: $ 14.5B GMV—LatAm king 🌟
• Fintech: $ 58.9B TPV—Pago’s gold 🔍
• Logistics: 6 new centers—zippy edge 🚦📉
NASDAQ:MELI ’s a double-threat dynamo!
(7/9) – SWOT: WEAKNESSES & OPPORTUNITIES
• Weaknesses: High P/E, FX swings 💸
• Opportunities: Ad bucks, untapped markets 🌍
Can NASDAQ:MELI zap past the bumps?
(8/9) – NASDAQ:MELI ’s Q4 surge—what’s your vibe?
1️⃣ Bullish—$ 3,000 in sight.
2️⃣ Neutral—Growth’s hot, risks hover.
3️⃣ Bearish—FX bites back.
Vote below! 🗳️👇
(9/9) – FINAL TAKEAWAY
NASDAQ:MELI ’s $ 6.1B Q4 and fintech flex spark buzz—$ 14.5B GMV shines 🌍🪙. High P/E, but growth rules—champ or chase?

MercadoLibre (MELI): A Powerhouse in Latin America! MELI is solidifying its position as a dominant player in the e-commerce and fintech markets across Latin America. With Argentina’s economic surge and aggressive expansion in Brazil and Mexico, MELI is poised for significant growth.
📈 Key Highlights:
Economic Recovery in Argentina driving e-commerce activity.
Expansion into logistics and food delivery diversifying revenue streams.
Growing adoption of Mercado Pago enhances its financial ecosystem.
While I see strong fundamentals supporting a buy rating, a 5% drop could offer a better entry point. My fair price estimate is $2,709, based on a 5 year DCF analysis.
Let's keep an eye on the support levels around $1,936 and $1,824.
#MELI #MercadoLibre #Investing #StockMarket #Ecommerce #Fintech #LatinAmerica #GrowthStocks #InvestmentOpportunities #Stocktobuy #Pullback

W Short Trade Symmetrical Triangle Breakdown Wayfair is an e-commerce platform for furniture and home goods sold online.
It has had gradually decreasing volatility on the daily chart in a symmetrical
triangle, W is halfway between the past earnings in early February and the upcoming in
May. Price is currently also compressing inside the triangle and halfway between
the mean VWAP and the first upper VWAP as the chart shows. The analysis of a short trade
is also supported by the AI algo of Luxalgo using Gaussian Regression line analysis to forecast
the downtrend. Targets are 47.25 which is the intersection of the forecasted trend down
and the support trendline of the triangle as well as 38.65 which is the intersection of that
same trendline and the pivot low of October 2023. The stop loss is 63.9 at the immediate pivot
high. The trade is projected to be a 25% trade is equal partial profits are taken at both
targets or 28% if the first target is a 1/3 partial closure.

Momentum, Growth & Innovation: Updated WatchlistMomentum, Growth & Innovation: Updated Watchlist
www.tradingview.com
My updated trading watchlist includes a diverse range of companies across various sectors, prominently featuring technology, healthcare, and finance, among others. These companies, currently part of ARK Invest's holdings, are identified as being in a confirmed Stage 2 uptrend, indicating strong bullish trends according to Mark Minervini's methodology. This analysis will highlight key sectors represented, providing a broad understanding of the market dynamics at play.
Technology Sector
Companies like NASDAQ: NASDAQ:AMD (Advanced Micro Devices Inc) NASDAQ: NASDAQ:MSFT (Microsoft) NASDAQ: NASDAQ:NVDA (NVIDIA Corporation) and NASDAQ: NASDAQ:GOOG (Alphabet) underscore the significant emphasis on technology, particularly in semiconductors, cloud computing, and artificial intelligence. These firms are at the forefront of innovation, driving trends in digital transformation, and represent strong growth opportunities as they capitalize on increasing demand for technology solutions.
Healthcare and Biotechnology
NASDAQ: NASDAQ:IONS (Ionis Pharmaceuticals) NASDAQ: NASDAQ:RXRX (Recursion Pharmaceuticals Inc) NYSE: NYSE:NET (Cloudflare) and NASDAQ: NASDAQ:VRTX (Vertex Pharmaceuticals Incorporated) highlight the focus on healthcare and biotechnology. This sector benefits from ongoing advancements in medical research, genetic sequencing, and personalized medicine. Companies in this space are pivotal in addressing global health challenges, including new therapies and vaccines, reflecting potential for significant impact and investment returns.
Finance and Cryptocurrency
With holdings like NYSE: NYSE:ICE (Intercontinental Exchange Inc) NASDAQ: NASDAQ:COIN (Coinbase Global Inc) and AMEX: BITO, there's a clear interest in financial services and the burgeoning field of cryptocurrencies. These selections point to the growing influence of digital assets and blockchain technology in reshaping financial transactions, investment strategies, and asset management.
Consumer Discretionary and E-Commerce
Companies such as NASDAQ: NASDAQ:AMZN (Amazon.com Inc) NYSE: NYSE:SHOP (Shopify Inc.) and NASDAQ: NASDAQ:MELI (MercadoLibre) represent the e-commerce and consumer discretionary sectors. Their inclusion underscores the continued growth in online retail and digital consumer behaviors, accelerated by global shifts towards online shopping and digital platforms for goods and services.
Aerospace and Defense
With NYSE: NASDAQ:KTOS (Kratos Defense & Security Solutions Inc) NYSE: NYSE:LHX (L3Harris) and NASDAQ: NASDAQ:AVAV (AeroVironment Inc.) there's an acknowledgment of the importance of aerospace and defense. These companies are involved in cutting-edge technology for national security, space exploration, and unmanned aerial vehicles, sectors expected to see substantial growth due to increased defense spending and interest in space.
Conclusion
My watchlist reflects a strategic focus on high-growth sectors poised for continued expansion and innovation. By targeting companies within technology, healthcare, finance, consumer discretionary, and aerospace & defense, the list aligns with sectors that not only have strong current performance but also hold future growth potential.

MercadoLibre ($MELI): A Deep Dive into Q4 EarningsIn the dynamic landscape of Latin American e-commerce, MercadoLibre ( NASDAQ:MELI ) has emerged as a towering figure, often dubbed as the "Amazon of Latin America." However, its recent fourth-quarter earnings report unveils a tale of resilience amidst tax obstacles and growth challenges. Let's delve deeper into the intricacies of MercadoLibre's performance and the underlying factors shaping its trajectory.
Tax Provisions and Profit Stability:
MercadoLibre's ( NASDAQ:MELI ) fourth-quarter net profit of $165 million may seem stable at first glance, but the narrative becomes nuanced upon closer inspection. The company faced a significant setback due to two one-off tax provisions in Brazil, amounting to $351 million. Despite this tax hit, MercadoLibre ( NASDAQ:MELI ) managed to maintain its profitability, albeit falling slightly short of analysts' forecasts.
Understanding the Tax Landscape:
The tax provisions, largely stemming from differential Brazilian rates and payments to Argentina, underscore the complexities of operating in Latin America's regulatory environment. Senior Vice President Andre Chaves indicated that the market had anticipated these provisions, reflecting the company's proactive approach in navigating regulatory challenges.
Revenue Growth Amidst Headwinds:
Despite the tax hurdles, MercadoLibre ( NASDAQ:MELI ) demonstrated robust revenue growth, with a 42% year-on-year increase in quarterly net revenues, reaching $4.26 billion. Sales in Brazil, the company's largest market, surged by 35%, showcasing resilience amidst economic uncertainties.
Challenges in Sustaining Growth and Profitability:
While MercadoLibre ( NASDAQ:MELI ) continues to report impressive growth figures, analysts have raised concerns regarding its ability to sustain growth while ensuring profitability. The company's quarterly operating margin witnessed a decline to 13.4%, attributed to factors such as increased promotional spending and margin compression during the fourth quarter.
Navigating Market Dynamics:
MercadoLibre's ( NASDAQ:MELI ) fintech arm, Mercado Pago, exhibited promising growth with a 34% increase in net revenues. However, challenges persisted in key markets like Argentina, where economic volatility and inflationary pressures posed hurdles to profitability.
Outlook and Strategic Initiatives:
Despite the margin compression in Q4, MercadoLibre ( NASDAQ:MELI ) remains optimistic about margin recovery in the upcoming quarters. Executives highlighted investments in free delivery options and enhancements in logistics infrastructure as strategic initiatives aimed at bolstering margins and driving sustainable growth.
Conclusion:
MercadoLibre's ( NASDAQ:MELI ) fourth-quarter earnings underscore its resilience in the face of tax obstacles and growth challenges. While the company navigates regulatory complexities and market dynamics, its strategic initiatives position it well for future growth and profitability. As Latin America's e-commerce powerhouse, MercadoLibre ( NASDAQ:MELI ) continues to chart its course amidst a volatile economic landscape, reaffirming its status as a key player in the region's digital economy.

SHOP solid growth and strength into earningsOn the 4H chart SHOP has been trending up since last fall when it fell through the high volume
area and then rebounded crossing through it and rebounding. Earnings have been solid beats
for over a year. Volume is persistent and steady while the relative strength rising from a bounce
down to the 50 level to begin this month. This is a solid earnings play but also could be
a long term investment but not until there is another dip or minor correction to set up for
a low risk entry. Last earnings gave SHOP about $10-12 in a quick price pop. I am looking
for something in the range of $6-8 higher as a conservative target

$PDD - Rising Trend Channel [MID-TERM]🔹Moving average indicator has provided a POSITIVE signal, indicating a continued upward trend.
🔹Resistance at 104 could potentially trigger a NEGATIVE reaction, but an upward breakthrough of 104 indicates a POSITIVE signal.
🔹Once breakout resistance at 46 is considered a POSITIVE signal.
🔹Technically POSITIVE for the medium long term.
Chart Pattern:
◦ DT: Double Top | BEARISH | 🔴
◦ DB: Double Bottom | BULLISH | 🟢
◦ HNS: Head & Shoulder | BEARISH | 🔴
◦ REC: Rectangle | 🔵
◦ iHNS: inverse head & Shoulder | BULLISH | 🟢
Verify it first and believe later.
WavePoint ❤️

MercadoLibre still bullish expectations
Hi viewers, MELI bullish in last periods, here still technically picture looks like it can go more, expecting to see higher bullish push
TP1:1320
TP2:1370
TP3:1410

Multiple Ideas for MELI the next weekLike you can see the Graph. MELI has a good fundamentals from the last Earnings and Revenue. One the F. Volume profile levels reach the 61,8% of the Fibonacci Retracement. So It's time to wait if the POC moves to that area and make things more interesting. The other Escenario is Wait for a Breakout. I think both Ideas are good if the Ocillator goes in a red wave marking a good retracement and go bullish again with more power and momentum

MELI clean chartPretty clean chart!
Broke out from the pennant, consolidated, now its time to expansion higher?
Watch $1100 level break for a possible move towards $1300
No break, No trade.

MELI Engulfing Green Bar Three Line Bearish886.75)MELI is like a hydrid between Shopify and Amazon on the South American markets
Fundarmentally its revenue compared to market cap is more favorable than either of those.
On the weekly chart, MELI double topped to its historical high in February 2021 and September 2021.
It then descended to a pivot bottom in July 22
The chart now shows a large green engulfing candle taking out most or all of the previous
5-15 candles or a so called " Big Ass Candle". This could represent the end of a consolidation period
and the beginning of the resumption of down-trending price action. Last August a similar
engulfing green weekly candle preceded a downtrend.
I have plotted the long-term anchored VWAP and also the 6-month volume profile.
I will take a short swin trade if price drops below the POC line of the volume profile. ( 886.75)
If however, price approaches or crosses the VWAP ( 1060) I will take a long trade.
Given the stock price a 6 month expiration call or put option may be the best trade
method allowing for the taking of multiple contracts and then scaling out type trade
management stratery.

MELI - Double TopA double top has led price down a bearish road
I have plotted a Fibonacci trend and .236 shows promise for a recovery due to the large support cluster that can be seen around this area
This will continue the uptrend on a higher timeframes


MecardoLibre - when does it end?!MecardoLibre
Medium Term
We look to Sell at 692.89 (stop at 756.88)
Preferred trade is to sell into rallies. The medium term bias remains bearish. A Fibonacci confluence area is located at 438.30. Previous support located at 430.00. There is scope for mild buying at the open but gains should be limited.
Our profit targets will be 444.73 and 372.00
Resistance: 690.00 / 830.00 / 1265.00
Support: 500.00 / 430.00 / 285.00
Disclaimer – Saxo Bank Group. Please be reminded – you alone are responsible for your trading – both gains and losses. There is a very high degree of risk involved in trading. The technical analysis, like any and all indicators, strategies, columns, articles and other features accessible on/though this site (including those from Signal Centre) are for informational purposes only and should not be construed as investment advice by you. Such technical analysis are believed to be obtained from sources believed to be reliable, but not warrant their respective completeness or accuracy, or warrant any results from the use of the information. Your use of the technical analysis, as would also your use of any and all mentioned indicators, strategies, columns, articles and all other features, is entirely at your own risk and it is your sole responsibility to evaluate the accuracy, completeness and usefulness (including suitability) of the information. You should assess the risk of any trade with your financial adviser and make your own independent decision(s) regarding any tradable products which may be the subject matter of the technical analysis or any of the said indicators, strategies, columns, articles and all other features.
Please also be reminded that if despite the above, any of the said technical analysis (or any of the said indicators, strategies, columns, articles and other features accessible on/through this site) is found to be advisory or a recommendation; and not merely informational in nature, the same is in any event provided with the intention of being for general circulation and availability only. As such it is not intended to and does not form part of any offer or recommendation directed at you specifically, or have any regard to the investment objectives, financial situation or needs of yourself or any other specific person. Before committing to a trade or investment therefore, please seek advice from a financial or other professional adviser regarding the suitability of the product for you and (where available) read the relevant product offer/description documents, including the risk disclosures. If you do not wish to seek such financial advice, please still exercise your mind and consider carefully whether the product is suitable for you because you alone remain responsible for your trading – both gains and losses.

ONLN Price Target $39 by Jan 2023This is purely an Amazon play, but ONLN is now trading below Pre-IPO levels. I believe that its exposure to Amazon, alongside other names that have seen a brutal sell-off (MELI, BABA, EBAY), makes it an excellent long-term buy for traders looking to find a great cost average entry point for the long term. We have to remember that Amazon is a great business still experiencing 20%+ YoY EBITDA growth and is sitting on 96bn dollars of cash. I also expect Amazon to see further price appreciation with its upcoming 20-1 split.

MELI: Short Setup at Resistance Level MELI - Short Term - We look to Sell at 1175 (stop at 1233)
Preferred trade is to sell into rallies. 20 1week EMA is at 1177. The bias is still for lower levels and we look for any gains to be limited. Previous resistance located at 1150. Further downside is expected and we prefer to set shorts in early trade.
Our profit targets will be 953 and 890
Resistance: 1150 / 1350 / 1450
Support: 1000 / 900 / 750
Disclaimer – Saxo Bank Group. Please be reminded – you alone are responsible for your trading – both gains and losses. There is a very high degree of risk involved in trading. The technical analysis, like any and all indicators, strategies, columns, articles and other features accessible on/though this site (including those from Signal Centre) are for informational purposes only and should not be construed as investment advice by you. Such technical analysis are believed to be obtained from sources believed to be reliable, but not warrant their respective completeness or accuracy, or warrant any results from the use of the information. Your use of the technical analysis, as would also your use of any and all mentioned indicators, strategies, columns, articles and all other features, is entirely at your own risk and it is your sole responsibility to evaluate the accuracy, completeness and usefulness (including suitability) of the information. You should assess the risk of any trade with your financial adviser and make your own independent decision(s) regarding any tradable products which may be the subject matter of the technical analysis or any of the said indicators, strategies, columns, articles and all other features.
Please also be reminded that if despite the above, any of the said technical analysis (or any of the said indicators, strategies, columns, articles and other features accessible on/through this site) is found to be advisory or a recommendation; and not merely informational in nature, the same is in any event provided with the intention of being for general circulation and availability only. As such it is not intended to and does not form part of any offer or recommendation directed at you specifically, or have any regard to the investment objectives, financial situation or needs of yourself or any other specific person. Before committing to a trade or investment therefore, please seek advice from a financial or other professional adviser regarding the suitability of the product for you and (where available) read the relevant product offer/description documents, including the risk disclosures. If you do not wish to seek such financial advice, please still exercise your mind and consider carefully whether the product is suitable for you because you alone remain responsible for your trading – both gains and losses.

MELI: Shooting Star Posted? MELI - Short Term - We look to Sell at 1166.70 (stop at 1241.12)
Preferred trade is to sell into rallies. Closed below the 50-day EMA. Posted a Bearish Shooting Star formation. Previous resistance located at 1150.00. Further downside is expected and we prefer to set shorts in early trade.
Our profit targets will be 974.38 and 914.10
Resistance: 1150.00 / 1350.00 / 1450.00
Support: 1000.00 / 900.00 / 750.00
Disclaimer – Saxo Bank Group. Please be reminded – you alone are responsible for your trading – both gains and losses. There is a very high degree of risk involved in trading. The technical analysis, like any and all indicators, strategies, columns, articles and other features accessible on/though this site (including those from Signal Centre) are for informational purposes only and should not be construed as investment advice by you. Such technical analysis are believed to be obtained from sources believed to be reliable, but not warrant their respective completeness or accuracy, or warrant any results from the use of the information. Your use of the technical analysis, as would also your use of any and all mentioned indicators, strategies, columns, articles and all other features, is entirely at your own risk and it is your sole responsibility to evaluate the accuracy, completeness and usefulness (including suitability) of the information. You should assess the risk of any trade with your financial adviser and make your own independent decision(s) regarding any tradable products which may be the subject matter of the technical analysis or any of the said indicators, strategies, columns, articles and all other features.
Please also be reminded that if despite the above, any of the said technical analysis (or any of the said indicators, strategies, columns, articles and other features accessible on/through this site) is found to be advisory or a recommendation; and not merely informational in nature, the same is in any event provided with the intention of being for general circulation and availability only. As such it is not intended to and does not form part of any offer or recommendation directed at you specifically, or have any regard to the investment objectives, financial situation or needs of yourself or any other specific person. Before committing to a trade or investment therefore, please seek advice from a financial or other professional adviser regarding the suitability of the product for you and (where available) read the relevant product offer/description documents, including the risk disclosures. If you do not wish to seek such financial advice, please still exercise your mind and consider carefully whether the product is suitable for you because you alone remain responsible for your trading – both gains and losses.

Short MELI CMP $1085.36Short MELI CMP $1085.36. This one is clear downtrend. Appears to be double bottom pattern but price will continue to fall to $900 area as per analysis. Trading below all major moving averages. No signs of buyer stepping in. MACD turned negative recently. Short target of $900 area coming soon which is also 200 SMA level on weekly chart.

Long MercadoLibre - Emerging Market bull run setupthis is a no brainer buy the pullback
huge news today about crypto asset wallet support, but price is down with the rest of the markets
revisit of the $2000 area looks good for next year summer-fall 2022

MELI MountainSo do you believe that Meli is going to drop to the spot (X)? I don't want to see it, but this looks like a double top mountain to me. I have been reading up a little on Meli and like AMZN, BABA... i think that it's worthwhile finding a strategy to get into a long term play that works. In the meantime... I will play a put here and there if I can catch it.

MELI SHORTNASDAQ:MELI
Short NASDAQ:MELI
Classic Double Top Paired with bad company fundamentals ie NASDAQ:AMZN is gonna beat them out...
Its simple.... short it... that's all

MELI: Downtrend to Continue?MELI - Short Term - We look to Sell at 1290.00 (stop at 1392.00)
Posted a Double Top formation. Closed below the 20-day EMA. Trading volume is increasing. Our overall sentiment remains bearish looking for lower levels. Further downside is expected and we prefer to set shorts in early trade.
Our profit targets will be 959.00 and 763.00
Resistance: 1300.00 / 1709.00 / 1970.00
Support: 972.00 / 755.00 / 630.00
Disclaimer – Saxo Bank Group. Please be reminded – you alone are responsible for your trading – both gains and losses. There is a very high degree of risk involved in trading. The technical analysis, like any and all indicators, strategies, columns, articles and other features accessible on/though this site (including those from Signal Centre) are for informational purposes only and should not be construed as investment advice by you. Such technical analysis are believed to be obtained from sources believed to be reliable, but not warrant their respective completeness or accuracy, or warrant any results from the use of the information. Your use of the technical analysis, as would also your use of any and all mentioned indicators, strategies, columns, articles and all other features, is entirely at your own risk and it is your sole responsibility to evaluate the accuracy, completeness and usefulness (including suitability) of the information. You should assess the risk of any trade with your financial adviser and make your own independent decision(s) regarding any tradable products which may be the subject matter of the technical analysis or any of the said indicators, strategies, columns, articles and all other features.
Please also be reminded that if despite the above, any of the said technical analysis (or any of the said indicators, strategies, columns, articles and other features accessible on/through this site) is found to be advisory or a recommendation; and not merely informational in nature, the same is in any event provided with the intention of being for general circulation and availability only. As such it is not intended to and does not form part of any offer or recommendation directed at you specifically, or have any regard to the investment objectives, financial situation or needs of yourself or any other specific person. Before committing to a trade or investment therefore, please seek advice from a financial or other professional adviser regarding the suitability of the product for you and (where available) read the relevant product offer/description documents, including the risk disclosures. If you do not wish to seek such financial advice, please still exercise your mind and consider carefully whether the product is suitable for you because you alone remain responsible for your trading – both gains and losses.
