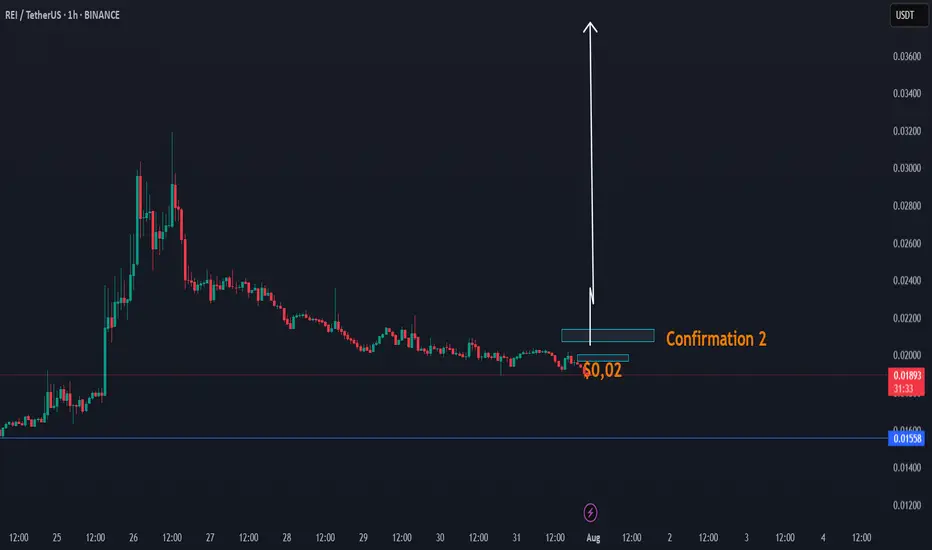
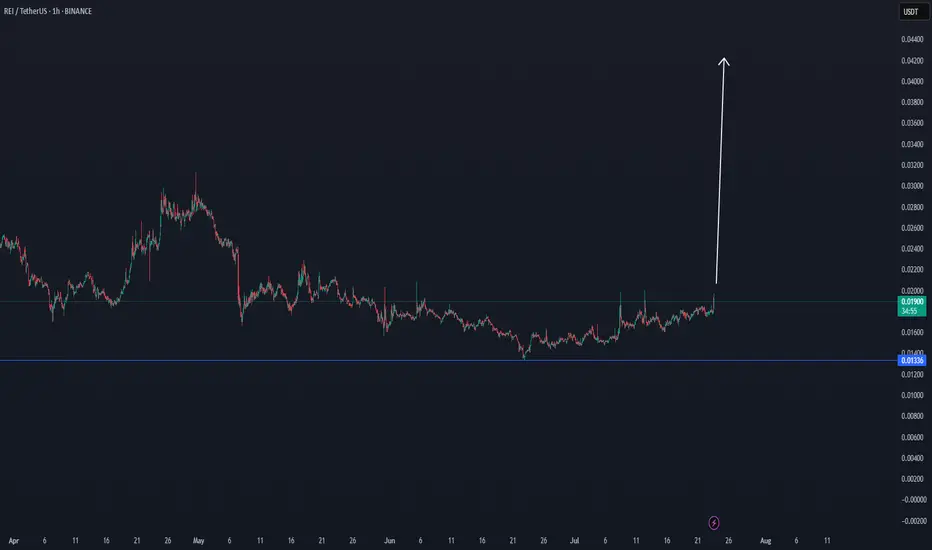
DAY UPDATE REI/USDT THE INCREASE CANDLE OF UP $0,03 - $0,05REI is an interesting coin since the update of Q4
We have seen that this coin was able to increase to $0,031 and until here $0,018 zone, a return to where we are now. There is a high chance that this coin can recover next 24H if this coin is able to confirm the confirmation $0,02 - $0,021
This coin, as before, was targeted at $ 0.02 and had low volume. We expect that if it comes back to $ 0.02, it will be confirmation of the volume, which can take the trend with a candle to up $0,03
REI CONFIRMATIONS ZONE
Higher time frame
When you look normally at this coin, then this coin is in a trend line of breakdown. This can change with the next confirmations. The question is, are we going to see again $0,02 the next 24h? If yes high chance of a break.
We also have a cycle update 2025, check it here, expecting $0,90
MEME
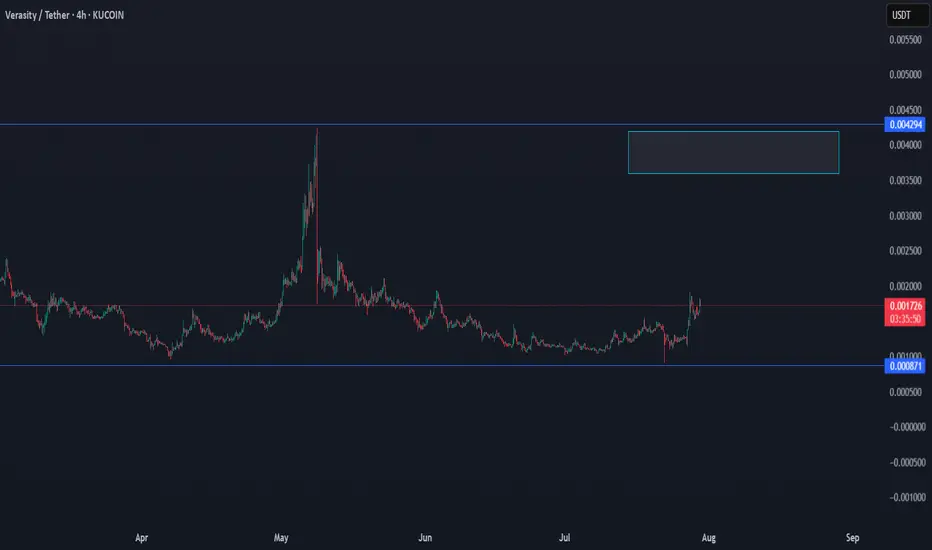
VRA/USDT THE RETURN TO KEY LEVELVra has good chance to return to the key level, since the last data shows a growth in the volume.
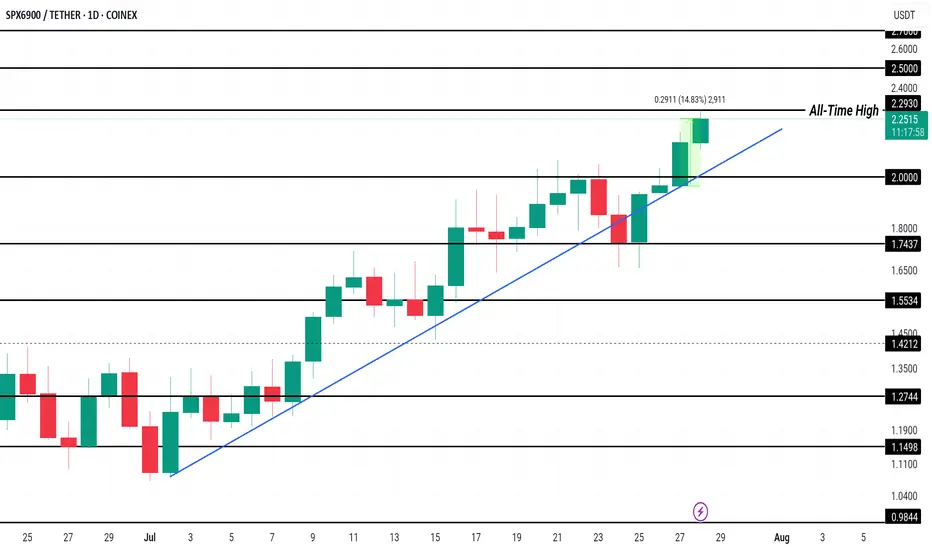
SPX Price Hits New All-Time High, $2.50 Up NextCOINEX:SPXUSDT has been experiencing a consistent uptrend since the beginning of the month, leading to the formation of multiple all-time highs, including one today at $2.27 . This price action reflects strong investor interest, pushing the altcoin to new levels and generating a positive market sentiment.
Currently trading at $2.23, COINEX:SPXUSDT has gained 14% in the past 24 hours . The Ichimoku Cloud, acting as support, signals bullish momentum. This suggests that SPX could rise further, with the potential to reach $2.50 or higher if market conditions remain favorable and investor confidence persists.
However, if selling pressure intensifies, COINEX:SPXUSDT could experience a reversal . A dip below the $2.00 support could push the altcoin toward $1.74 or lower, invalidating the bullish outlook.
PEPE Daily Setup Holding Strong
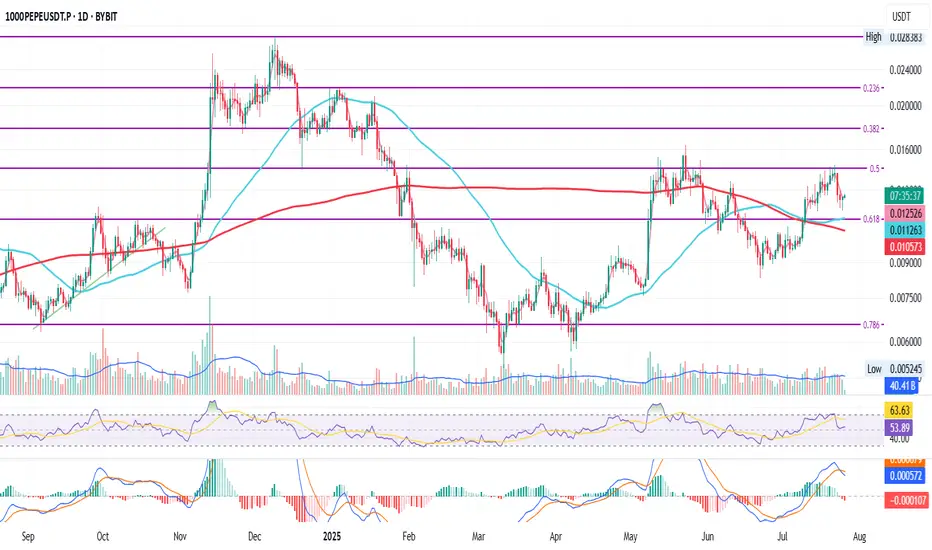
This is PEPE on the daily
Price recently crossed above the 50MA which is currently resting on the 200MA after a golden cross
It was rejected at the 0.5 Fib but is now holding above the 0.618 Fib as well as the 50MA and 200MA
RSI is finding support at the mid level while MACD just turned bearish
Chances are we see a pullback first, a search for support, before the next possible move up
We’ll be here to watch it unfold
Always take profits and manage risk.
Interaction is welcome.
PENGUUSDT Daily Chart Analysis | Powerful Uptrend in PlayPENGUUSDT Daily Chart Analysis | Powerful Uptrend in Play
🔍 Let’s dissect the current PENGU/USDT daily chart, highlighting the unmistakable bullish structure and mapping potential targets as this trend matures.
⏳ Daily Overview
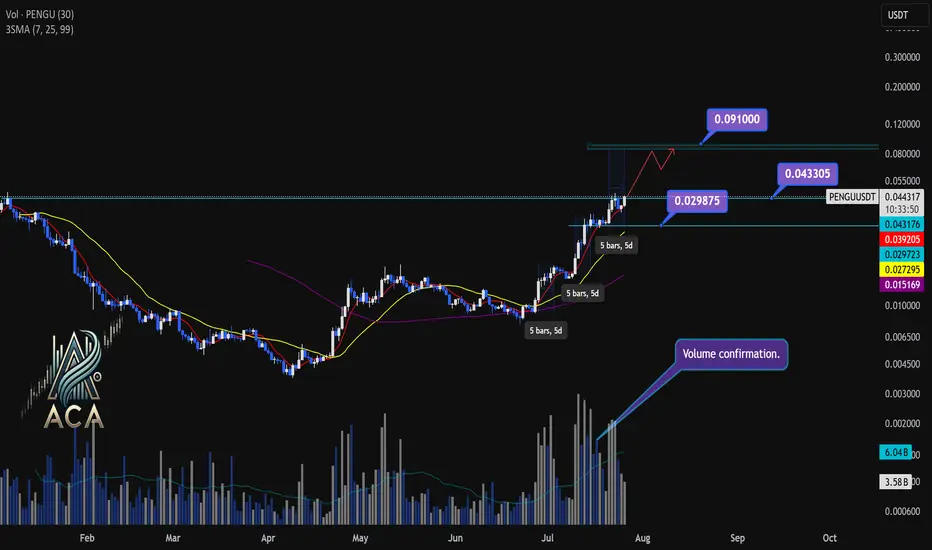
PENGUUSDT is riding a strong upward trend, with all three daily SMAs (7, 25, and 99) lined up in bullish sequence—clear confirmation of momentum. Recent rallies are also supported by textbook volume behavior: volume consistently surges during price climbs and tapers off during minor corrections, reflecting the classic signature of a robust uptrend.
🔺 Bullish Setup and Price Targets:
The next major upside target sits at $0.0910, almost 85% above the current level. For bulls, a daily candle closing above $0.043305 with convincing volume should act as a confirmation for fresh highs—though, as it’s Saturday, even moderate volume could suffice for a valid breakout.
📊 Key Highlights:
- All SMAs (7, 25, 99) confirming the uptrend on daily timeframe.
- Volume spikes on upward moves, fades on corrections—classic bullish confirmation.
- Historical trend velocity: Each time a new high (HH) is set, it’s preceded by around 5 days of advance; first leg was +83%, second +124%, the next (projected) is +160%, aligning with the $0.0910 target.
- Corrections: After each rally, pullbacks have measured about 15% and 20%. Should the first target be reached, expect a correction up to 25%—a healthy reset for further continuation.
🚨 Conclusion:
With all signals aligned—moving averages, volume dynamics, and historic price structure—the path remains bullish. A decisive close above $0.043305, especially with solid volume, could be the catalyst for the next major leg higher. As always, monitor for typical correction ranges post-breakout in line with the prior trend.
REI/USDT CYCLE UPDATE $0,90 by 2025 - Price prediction📈 REI/USDT CYCLE UPDATE – $0.90 by 2025
REI could break above its old ATH, targeting $0.90 in the upcoming cycle. Why?
Upcoming
✅ Ultra-fast blockchain (⏱️ 1.5s block time)
✅ Gas-free or near-zero fees – perfect for DeFi, NFTs & gaming
✅ EVM-compatible – easy migration for Ethereum dApps
✅ Low market cap → high upside potential
✅ Clean tokenomics with staking + resource model
✅ Built for speed, scale & adoption
DATA
Data shows that there is a structural trend going on, where this coin can break soon.
If the altcoin market heats up, REI has the fundamentals & tech edge to explode past previous highs. 🚀
🧠 Watch this one closely.
#REINetwork #Crypto #Altseason #EVM #PricePrediction #Web3
This is not trading advice, but a view from a side of study.

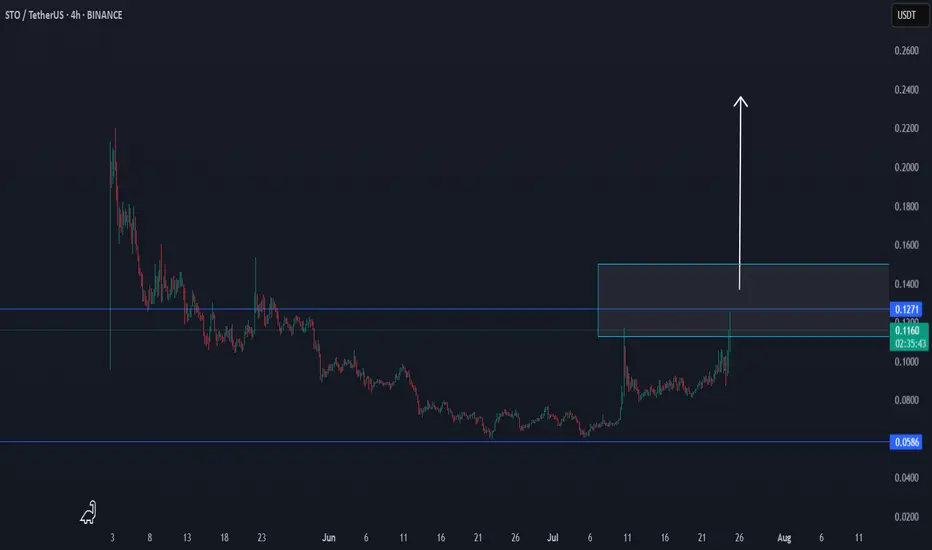
STO/USDT THE FLY EFFECTSTO/USDT are in a trend, which can break.
We will follow the confirmations in the coming time frames.
Volume looks interesting.
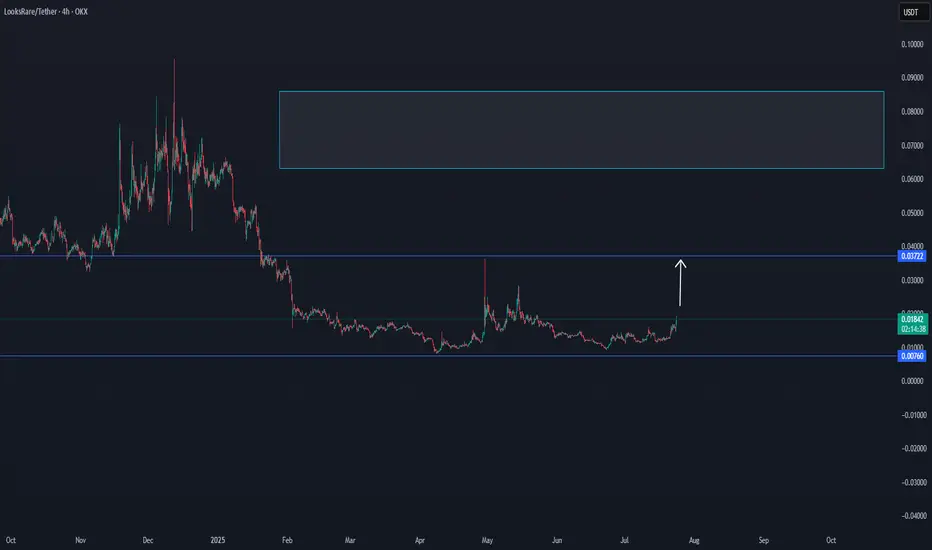
LOOKS CAN ENTER LONG TERM CYCLE AFTER THISLooks seems to make an important trend, which can allow this coin to enter a cycle area.
On the low time frame, it shows breakdown. The main view is that this coin is positive.
$0,035 is an important cycle target, which can be done with time depending on the last confirmations.

BTC NEW VOLUME TREND 122KThis is a small time frame update, where BTC can try to target 22K again in the coming time frames. Since the last 15H breakdown volume, BTC can enter new uptrend volume
From the box level, there is a good chance for a new uptrend.

LOOKS/USDT NEW INCREASE VOLUMELooks seems to have trending on a low time frame new increase trending, following to see if this coin is able to get confirmed in the next hours.
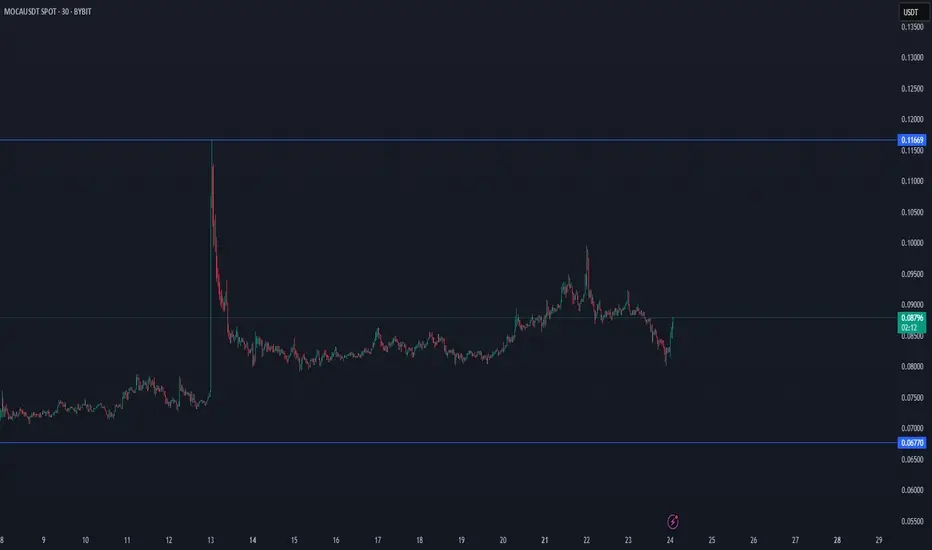
MOCA/USDT NEW VOLUME RANGEMOCA/usdt starting with new volume range, which can get confirmed in the next hours.
our follow will here for this coin to see new confirmations.
REI/USDT THE NEXT WHALE INCREASE COIN $0,04 TargetREI/USDT THE NEXT WHALE INCREASE COIN
This coin seems to have a powerful DCA effect, which can be confirmed in the coming time frames with a break.
When there is interest, and new confirmations, here below the update.
entering this coin only when there are more confirmations
The first confirmation is to get first out of this box
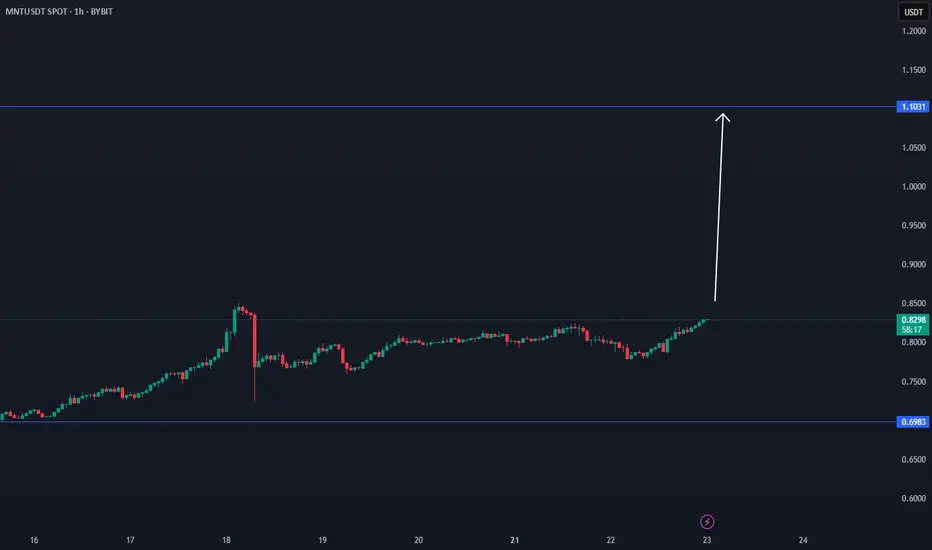
MNT TIME FRAME BREAKMNT has a good chance to break in the coming hours, depending last data.
$1.10 is an important target. 32% increase possibility.
Coin has acctive volume.
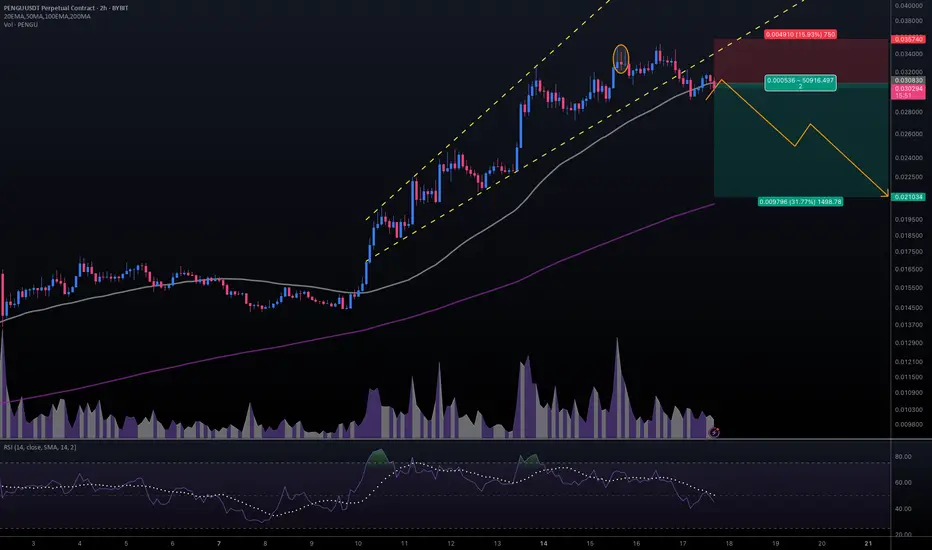
#PENGUUSDT #2h (ByBit) Broadening wedge breakdownPudgy Penguins printed an evening star then lost 50MA, seems to be heading towards 200MA support next.
⚡️⚡️ #PENGU/USDT ⚡️⚡️
Exchanges: ByBit USDT
Signal Type: Regular (Short)
Leverage: Isolated (2.5X)
Amount: 5.0%
Entry Targets:
1) 0.030830
Take-Profit Targets:
1) 0.021034
Stop Targets:
1) 0.035740
Published By: @Zblaba
CSECY:PENGU BYBIT:PENGUUSDT.P #4h #PludgyPenguins #Meme pudgypenguins.com
Risk/Reward= 1:2.0
Expected Profit= +79.4%
Possible Loss= -39.8%
PEPE WILL WE GO TO .000035 ? Evening
so if we can break this orange level here ie this top in price action then a nice run up to .000035 makes send.
stay tuned this is wild one
what do you think Pepe will do ?
Kris/ Mindbloome Exchange

OFFICIAL TRUMP Last Barrier · $30 or $100 Next · MixedThe last barrier is on now. The last barrier as in the last and final resistance level TRUMPUSDT (OFFICIAL TRUMP) needs to conquer before a major rise. Will this rise reach $30 or $100 or higher? Continue reading below.
Make sure to boost this publication and follow to show your support.
Hah! Resistance is confirmed as EMA89, what a drag. This is the blue dotted line on the chart but notice something else. Look at the magenta line, EMA55. TRUMPUSDT is trading above EMA55 but below EMA89. Bullish and bearish. Bearish and bullish. Mixed?
There is nothing mixed.
The main low happened 7-April. A higher low in 22-June. Can you see?
This is not mixed, this is bullish confirmed.
If the market were to move lower, then in 22-June we would have either a test of the 7-April low or a lower low. The fact that the drop stopped higher means that buyers were present. People were actually expecting for prices to drop and once they dropped they bought everything that was being sold. Prices couldn't move any lower because people were buying up. These are smart trader, smart money; experience for sure.
They managed to buy some tokens at a lower price within the "opportunity buy zone." This zone is available no more and now we have the mix of resistance and support; EMA89 and EMA55. What happens next?
Based on the previous signal I just showed you and marketwide action, Bitcoin super strong, we know that TRUMPUSDT will follow and break-up. Yes! Massive growth.
Both targets are good and will hit. Short-term, we will see a challenge of $30 and long-term we will see $100 and beyond.
Thanks a lot for your continued support.
Namaste.

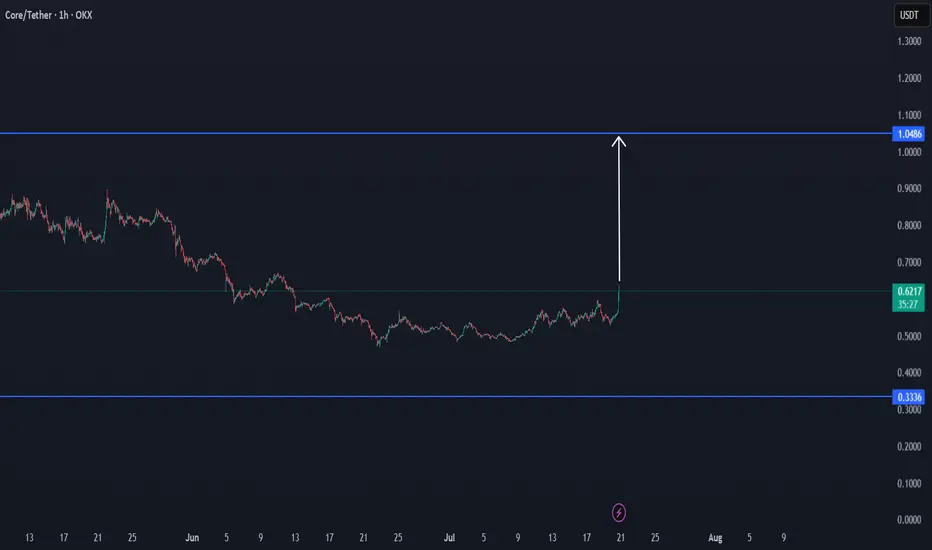
CORE/USDT NEW CYCLE STARTING TO $1CORE looks to enter a new cycle trend, which can confirm an important area, and can be also the reason to enter a new target to $1 with time.
Following this coin, with the upcoming confirmations.
More data?
Check this update for new confirmations.
$SHIB Ready to Move?CRYPTOCAP:SHIB has printed confirmed weekly bullish divergence in RSI and is now attempting to overcome the weekly 200EMA resistance.
A High Volume Node lies just above but a close above this will signal a bullish trend ready to move the initial target of the weekly pivot point followed by the 0.0003579 High Volume Node.
Price completed its retracement to the 'alt-coin' golden pocket 0.786 Fibonacci retracement.
Bearish divergence is currently growing on the weekly RSI but will be diverted with a thrust high!
Is it MEME season? CRYPTOCAP:DOGE also looks ready to go!
Safe trading

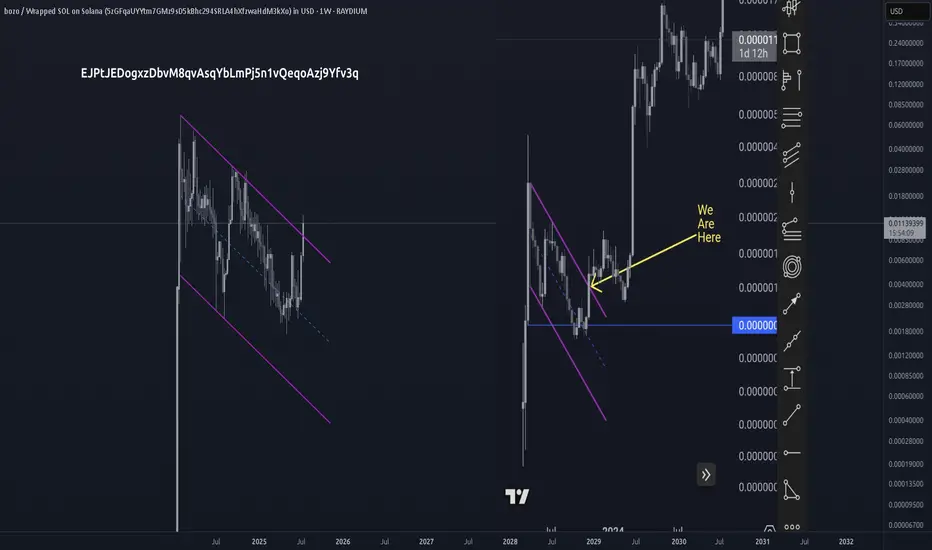
that bozo pepe fractal is wildthe bozobenk chart has built the exact same fractal from pepe before its big pump into 2023:
steep initial climb (pole)
flag formation pullback
swept the pivot
double bottom at mid
breaking out!
pepe ran a 45x from here, supply:ratio suggests bozo will run more
WILL POPCAT HAVE A NEW WHALE VOLUME?POPCAT seems interesting then never before, even with the last correction, are we going to see a new increase round by POPCAT? The time will show, the interest is here.
If this coin is able to make new confirmations, the updates will be below.

BONKUSDT 1D Chart Analysis | Bullish Momentum is coming...BONKUSDT 1D Chart Analysis | Bullish Momentum Builds After 0.236 Fibo Pullback
🔍 Let’s break down the BONK/USDT daily chart, focusing on the latest price action, strategic moving averages, RSI convergence, and volume dynamics for a complete bullish scenario setup.
⏳ Daily Overview
BONK is showing strong upward momentum, printing consecutive higher highs (HH) in both candles and RSI—a clear bullish trend indicator. After an explosive move, price is currently staging a healthy pullback to the key 0.236 Fibonacci retracement level (0.00003142), which commonly acts as a support platform during aggressive uptrends.
📈 Technical Convergence and Trend Structure
- 3SMA Support: The 7, 25, and 99 SMAs are all trending upward and stacked correctly, with price sitting comfortably above them. The 7SMA acts as immediate dynamic support, reflecting trend strength and buyer interest at every dip.
- RSI Dynamics: RSI just bounced from the 69–70 zone, confirming convergence with price action. The indicator made its own higher high in tandem with the candles, and now, as price pulls back, RSI is reentering the overbought territory—which often precedes renewed momentum.
- Volume Confirmation: Notably, volume surged as the trend accelerated, and is now tapering off during this corrective phase. This is a classic bullish volume signature, showing profit-taking by early longs but no major selling pressure, suggesting trend continuation likely after consolidation.
🔺 Bullish Setup & Targets
- First target: 0.00005376 — retest of the last all-time high (ATH).
- Next resistance to watch: 0.00003920, followed by the ATH region.
- Long-term target: 0.00009710 — an upside of 170–180% from current levels, mapped by technical extension and price discovery zones.
📊 Key Highlights
- Price holding the 0.236 Fibo retracement signals a shallow, healthy correction.
- 3SMA alignment confirms long-term bullish bias—actively supporting every dip.
- RSI and price are convergent, reaffirming uptrend strength; RSI’s move back into overbought could ignite the next price surge.
- Volume decreasing on corrections and rising during rallies—bullish confirmation.
🚨 Conclusion
BONK/USDT remains technically poised for further upside. The blend of higher highs, support at the 0.236 Fibonacci retracement, positive 3SMA structure, and RSI convergence all point to bullish continuation. Watch for renewed momentum as RSI reenters overbought territory and volume confirms the next breakout. Next targets: 0.00005376 (ATH), with a long-term projection toward 0.00009710.

MELANIA: Divergence, Signal, BaseThis is MELANIA on the 1-day chart.
First, I want to emphasize the bullish divergence on the RSI, which started on April 21, while price continued to drop, RSI held or even moved higher.
Second, although we’re still below the 50MA and the chart doesn’t yet have a 200MA, both systems are long:
• PSAR is bullish
• MLR > SMA > BB Center
Third, it appears a base has been forming since June 27.
All these factors combined led me to open a long position, but of course, this is just my view, not financial advice.
Always take profits and manage risk.
Interaction is welcome.

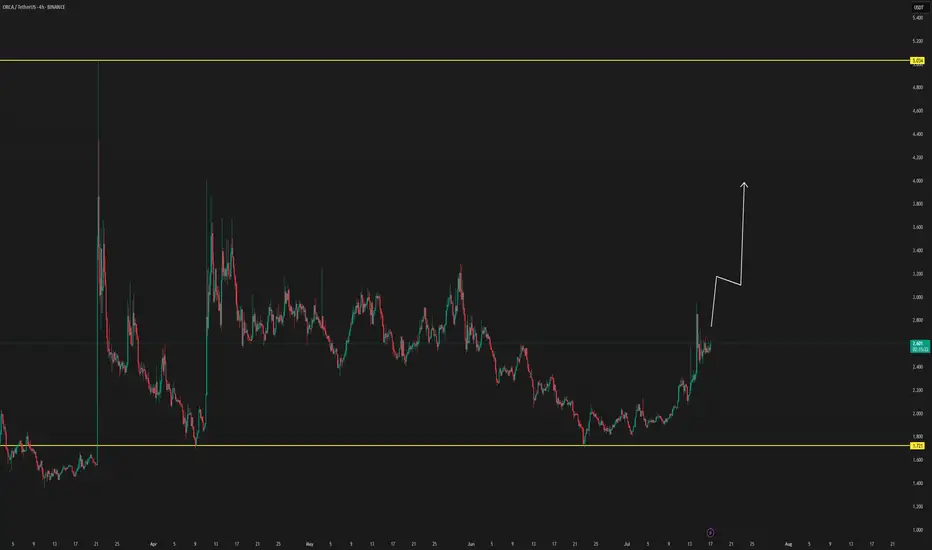
ORCA/USDT NEW VOLUME ENTERYORCA shows for the first time in long time ago a new volume uptrend, which can get confirmed in the next hours to a new volume.
When there are new confirmations or updates, they will be listed here below.
If there is new confirmations coming, we could see this coin soon to targets
$3.17
$4.20
Best target $5
The trend study shows there is new interest in ORCA