You were warned. Now it’s runningThis was the second test into the FVG + 4H OB confluence. High volume candle. Wicking liquidity. And structure still intact.
Why I stayed calm:
Price didn't just drop — it delivered into a known rebalance zone. That 0.176–0.178 box was a magnet, not a mystery.
The reaction came right on cue:
Volume confirmed interest
Structure stayed intact
And the engine kicked in right after the sweep
Now? The play isn’t about guessing the top. It’s about knowing where price is drawn — and why.
Play-by-play logic:
4H OB provided the base
FVG gave the imbalance
Reaction zone created a clean entry
TP target? +18% mapped to 0.21
I didn’t enter on emotion. I positioned based on structure. That’s why it’s already moving while others still think it needs “confirmation.”
Final words:
“You don’t need hindsight when your foresight is built on logic.”
MEME

Pepe Support Confirmed, Bullish Continuation Next (Trade & Win)Support is now confirmed with four green days after EMA55 and EMA89 hold as support. PEPEUSDT is bullish now and set to grow.
The peak happened 24-May. The low 5-June.
This retrace lasted 13 days with a total drop of 36%. For future reference.
After each bullish wave, there is always a retrace or correction. In this case only a retrace because the bullish cycle is just getting started, the previous wave of growth was very small.
The next advance will be very, very strong so we can expect a correction after it. The difference between the retrace and a correction is about size. The correction lasts longer and goes deeper, that's all there is.
Expect maximum growth now but this won't be the end. It will grow super strong in the coming weeks and months, then we get a correction and then even more growth. But the fifth wave is the last one, after this we get a bear market so pay attention.
Pepe's support has been confirmed. This bullish continuation will turn the market full green.
Follow me to trade with me and win.
Namaste.

MEMEUSDT 1D AnalysisMEME ~ 1D Analysis
#MEME Buy back gradually from here if you still have confidence in this coin with a short term target of at least 15%+ from here.

NAIIVE. Pullback before the next leg up.CTO Token in an up trend now and it seems community pretty strong and bullish. Binance Smart Chain is experiencing a surge in liquidity. Regarding TA, the price may Pullback to the moving average before trend continuation.

WEN INTO IMPORTANT ZONE FOR INCREASEWEN INTO IMPORTANT ZONE FOR INCREASE
There is some daily volume interest which can confirm with the coming time frame for na ew increase

W$J Meme Index – Live Market Cap Tracker for DegensThe W$J Meme Index is a market-cap–weighted chart of the top 14 meme coins in circulation. Built by degenerates, for degenerates. This is your daily source of truth when the timeline is pure hopium.
No fluff. No TA wizardry. Just raw, unfiltered meme market data for the financially unwell.
Coins included: DOGE, SHIB, PEPE, WIF, BONK, FLOKI, BOME, MEME, MYRO, TOSHI, SPX6900, MOG, GIGA, POPCAT.
Tag it. Trade it. Cry with it.

TECHNICAL ANALYSIS – KASPA/USDT (Daily Chart) + TRADE PLANTECHNICAL ANALYSIS – KASPA/USDT (Daily Chart)
Chart Pattern & Price Action:
Descending Channel (Falling Wedge): KASPA has been trading within a falling wedge pattern, typically a bullish reversal setup.
Breakout Zone Approaching: Price is currently testing the upper resistance of the wedge (~$0.086–$0.088). A breakout from this level may indicate trend reversal.
Key Resistance Zone:
$0.105 – $0.127: Significant supply area (marked in red). Previously rejected, it is the next target if price breaks out upward.
Support Zone:
$0.073 – $0.082: Demand zone. Coincides with the Bollinger Band lower range and historical support.
Indicators Overview:
Bollinger Bands:
Price is trading at or near the middle band, showing a neutral-to-slightly bearish bias.
A breakout above the upper band (~$0.0895) could trigger bullish momentum.
MACD (VMC Cipher_B_Divergences):
Strong bearish momentum continues, but we can observe potential bullish divergence forming.
Green dot signal at the bottom may indicate a possible local bottom.
RSI (Relative Strength Index):
Currently at 37.06, near oversold territory.
Could signal a bounce if RSI climbs above 40 and confirms strength.
Money Flow Index (Art’ Money Flow):
MFI is deep in negative; however, these levels often precede trend reversals.
Watch for a crossover into positive territory as confirmation.
Stochastic RSI:
Bullish crossover around 14.53 / 15.67 in the oversold zone.
Early sign of potential short-term bounce.
TRADING PLAN
Entry Points:
Zone Type Price Range Reason
Buy Spot 1 Conservative $0.073 – $0.082 Strong historical support & bottom of wedge
Buy Spot 2 Aggressive ~$0.086 – $0.089 Breakout of descending wedge
Buy Spot 3 Momentum Break above $0.105 Bullish confirmation + breakout of major resistance
Take Profit Zones:
TP Level Price Notes
TP1 $0.105 First resistance / psychological level
TP2 $0.127 Strong resistance – expect rejection here
TP3 $0.15–0.16 Major extension target if strong momentum
Stop-Loss Strategy:
Strategy Type Placement
Conservative Below $0.073
Aggressive Below $0.080
Risk Management:
Use position sizing relative to account size (e.g., 1–3% risk per trade).
Adjust stop-loss dynamically if entering at breakout.
Combine with on-chain metrics or volume spikes for higher conviction.
SCENARIOS:
🔼 Bullish Scenario (Blue Up Arrow):
Breakout above wedge → retest → rally toward $0.105+
Break $0.105 confirms macro uptrend continuation
🔽 Bearish Scenario (Blue Down Arrow):
Rejection at wedge top → breakdown of $0.082 → revisit $0.073 support
Below $0.073 would invalidate short-term bullish structure

ZEC CAN GO TO $100 TARGET Zec is able to get a confirmation in the coming time frames and to break to $100
Will this be the next break level as omisego did?
We will follow the trend.

SUI NEW VOLUME UPCOMINGSUI shows on a low time frame new upcoming volume, which can allow SUI to break soon.

is WLD READY FOR NEW CYCLE to $4Worldcoin looks to have new data, which could mean a new cycle is on processing.
Low time frame focus target $1,70

Kava : Day trade volumeKava can show new volume on day trade volume. We will follow this coin in the coming time frames for the uptrend.

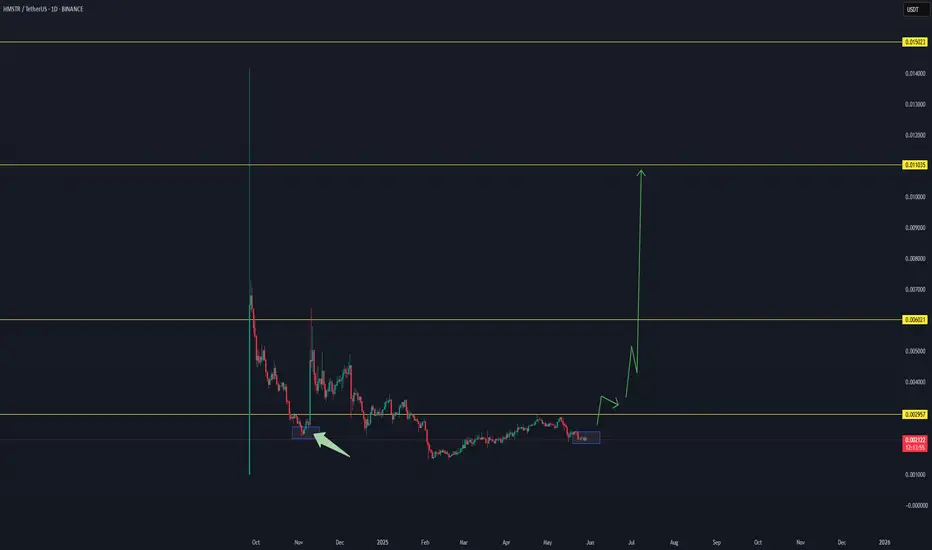
HAMSTER CAN EXPLODE TO THE MOON AS NEVER BEFORE..Depending on our study and trends, we expect with high chance that hamster is going to see a new volume in the upcoming time, which will allow this coin to increase to new levels.
These are our expected targets.
$0,0.0024
$0,006
$0,011
$0,015
This coin is at this moment in a stable time frame, and can build unexpectedly in the coming time a new break followed by a whale's increase in volume.
Time will tell if this coin will act as we expect.
There are some important reasons based on data that let us expect this coin is going to break, at last its a market, which has never 100% guarantee.
Beginners Guide To Winning Memecoin Trades! Moo DengMeme coins have taken the cryptocurrency world by storm, often starting as jokes but evolving into high-volatility assets that attract crypto traders seeking quick gains. From Dogecoin to Shiba Inu and now Moo Deng, these so-called useless meme coins can offer trading opportunities—if you know where to look.
In this updated crypto analysis, I will build on our previous analysis where I identified a strong monthly supply zone for Moo Deng meme coin at $0.26. If you're wondering how to trade meme coins like Moo Deng, even with little experience, this supply and demand analysis breaks it down using simple supply and demand concepts on larger timeframes.
The sell-off is trying to happen.

APE is showing early signs of accumulation after prolonged conso"APE is showing early signs of accumulation after prolonged consolidation. With improving sentiment in the altcoin market and potential catalysts on the horizon, this could be one to watch. Patience and proper risk management remain key. 🦍📈 #APE #Altcoins #CryptoTrading"

CHESS.USDT NEW INCREASE ROUNDEAs a trader, it's important to follow the market and the unexpected trends.
CHESS/USDT shows a possibility for a new increase in the coming time frames, after the long-term breakdown.
Let's follow the data and see if this coin is able to increase as the chart shows.
interesting to follow for the coming time frames for new confirmations.
$0,10 is an important target that this coin could hit in the coming time.
If the cycle gets confirmed, this coin could go to $0,25 as a high target and $0,35 as a best target.
In trading, never expect instant results; the market goes as it needs to go.
Risk management is the key.

$PHNIX Trading Idea: Breakout and Retest Signals Moon Potential $PHNIX has broken out of a descending trendline, retested it as support, and is showing bullish momentum as of May 22, 2025. The price is above key EMAs, and the setup suggests a potential move to $0.0000850000.

PEPE key levelsBINANCE:PEPEUSDT
The chart shows partial zones for buying this asset.
Further on there will be a good profit to risk ratio.

Go go BOME!!📢Price action is quite good. now standing on the yellow support line. potential to go to the white line resistance target, supported by divergence and small double bottom. I think this is a good time to take a long position📈.
⚠️Be careful if the price breakdowns the yellow line support because the market will reverse 📉and selling pressure is high.

MEMEUSDT 1D AnalysisMEME ~ 1D Analysis
#MEME Buy on retest of this support block with short term target of at least 15%+ from here.

Neiro: Your Altcoins Choice (S5)I am very curious as to why dogs became so famous within the Cryptocurrency market... It is very interesting. What is the relationship of dogs and this technology? Why dogs and not turtles or dragons? We know the cats went to videos but Crypto gets to enjoy man's best friend.
Neiro is good my dear friend very good just as you. Thanks a lot for your support.
I appreciate the time took out to comment and make this analysis request, I hope you are happy with the results.
NEIROUSDT is good, this is a solid chart.
This analysis is 100% based on the chart, technical analysis—TA.
The RSI looks pretty good on the bullish zone (above 50).
There is a bottom pattern in the form of a rounded bottom coming after a major downtrend. The action recovered above the 11-March low and the ensuing retrace was minimum which is a signal of strength.
The chart candles, the volume and indicators are telling me that an advance will happen next. The main move will be an up-move. Higher prices for sure. You can find targets mapped on the chart, it will be easy, it is high probability and it will be great.
Strategy? Buy and hold. But make sure to sell when prices are up do not become greedy. Enjoy the profits and move on. Opportunities are endless. You are good because you have good timing. Having good timing means that you are balanced in your life because you are looking at the market just at the right time. To be able to be here at the right time means that you are looking to win. Those that are looking to play will join when it is too late.
Timing is very important when trading because it removes all the complexities that come with joining a move when it is already underway. Buy and hold easy. NEIRO is set to grow in the coming weeks and months.
Thank you for reading.
Namaste.

(LOFI) new to krakenAdded today to kraken, (LOFI) "live." Brand new. Been established since Nov 2024. It looks like a wooly blue frog thing meme based on the pepe frog meme. Icelandic version of Pepe? I don't like how Kraken does not offer 100% of the time a description about new coins. The same is true for Coinbase. Sometimes there is a description but sometimes there is no description. How can they offer a business model but not offer the complete up front package of short form information about a company. Seems like laziness to have all the documentation to list a coin but not take the amount of time is takes to copy and paste a quick description of the coin onto the user website.

Nacho the Kat Bullish Falling Wedge Pattern Signals PotentialChart Overview
The chart shows a falling wedge pattern forming on a 4-hour timeframe for "Nacho the Kat" (NACHO/USD). This is a bullish pattern often indicating a potential price breakout to the upside, particularly after a period of consolidation within the wedge.
Price Action Analysis
Current Price: The price is approaching a potential breakout point, with the trend following the pattern outlined in the chart.
Falling Wedge:
The pattern suggests the price has been consolidating within lower highs and higher lows, creating a narrowing range. Historically, the breakout from a falling wedge tends to be upward, especially when volume and momentum indicators align with the trend.
Volume and Momentum Indicators
VMC (Volume Momentum Cipher): Shows divergence (highlighted by green and red dots). The momentum is slowing but still supports the possibility of an upward move once the price breaks above the resistance level.
RSI (Relative Strength Index): RSI is at 55.03, indicating neutral market conditions. There is room for upward momentum before reaching overbought conditions, which further supports the possibility of an upside breakout.
ArtY Money Flow Index: It is currently above 40, showing positive money flow, indicating that buying pressure is still relatively strong.
Stochastic Oscillator: The Stochastic is at 47.29, which is within a neutral range. However, it could suggest potential upward movement, especially if the oscillator crosses above 50.
Support and Resistance Levels
Support: The support level is represented by the strong low section of the falling wedge. A breakdown below this level could invalidate the pattern.
Resistance: The resistance lies at the upper edge of the falling wedge. Once the price breaks this level, it could indicate the start of a bullish move.
Trading Plan
Entry Point:
Wait for a confirmed breakout above the upper resistance of the wedge. A break above this level will provide a clearer confirmation of upward movement.
Consider entering the position at or above 0.0000057 USD.
Stop-Loss:
Place the stop-loss below the lower trendline of the wedge to limit potential losses in case the breakout fails. A reasonable stop-loss could be around 0.0000045 USD.
Take-Profit Targets:
Short-Term Target: After a breakout, aim for a conservative target around the next resistance at 0.0000065 USD.
Long-Term Target: If momentum continues to build, the next potential resistance levels may be around 0.0000075 USD.
Risk Management:
As with any trade, ensure to use proper risk management by not risking more than 1-2% of your total capital per trade.
Keep an eye on the volume and momentum indicators. If they show signs of weakening before the breakout, consider reducing position size or waiting for more confirmation.
Final Thoughts
The falling wedge pattern suggests that "Nacho the Kat" cryptocurrency may be preparing for a bullish breakout, but it's essential to monitor price action carefully. A strong breakout with increasing volume will likely signal further gains, while a failure to break the wedge resistance could lead to further consolidation or downside risks.

DEGEN Testing Red Resistance – Breakout Potential!🚀 DEGEN Testing Red Resistance – Breakout Potential! 📈
DEGEN has formed a red resistance zone, where we’re seeing some sellers stepping in. If the price breaks through, the trend could continue with the first target at the green line level! 📊
Let’s watch for that breakout together! 💼💸
