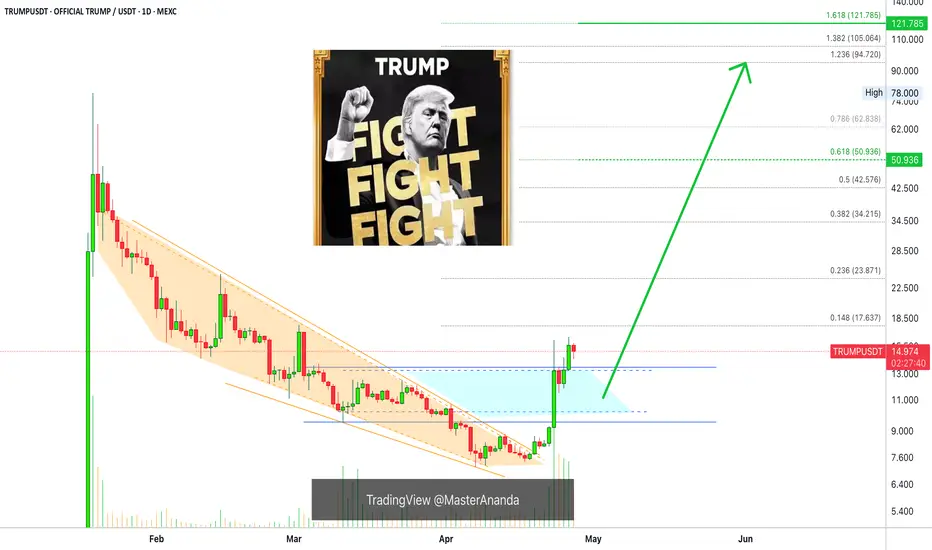
OFFICIAL TRUMP Targets: $50—264%, $121—764%, $192—1,271% &..."Patience is key" has been a valuable and valid tool in the past few weeks. TRUMPUSDT has been consolidating above support and nothing more is needed other than patience to win.
Today we are going to be looking at multiple targets, long-term and short-term. All the targets that are likely to hit in this upcoming bullish cycle.
$TRUMP is growing and will continue to grow. It is normal to see some consolidation before a major move. In fact, the consolidation phase (sideways) is what makes a strong bullish impulse possible. The first wave is in.
A bullish impulse consist of 5 waves. Three waves forward, advances, and two waves backward, corrections. The third wave tends to be the biggest wave based on size and volume but it can happen that the fifth wave ends up being the biggest one.
TRUMPUSDT is about to enter its third wave based on Elliott Wave Theory. The third wave would easily cut through $34 as a resistance level and continue higher to reach $51. This $51 target gives a nice 264% but this is easy. Additional growth can happen within months and TRUMPUSDT can hit $121 for a total of 764%.
The fourth wave is a correction. Seeing that the second wave was very small and short, the fourth wave can be long in size and duration. After this wave comes the final wave which is the speculative wave. In this wave, Wave 5, anything goes.
TRUMPUSDT can continue growing through late 2025 and reach major new All-Time Highs. A $148 target can be easy if $121 is reached within the third wave. A strong peak price for the fifth wave would be $192 for a huge 1,271%. With a strong blow-off top, a $263 target can close the cycle with an astonishing 1,778%. Of course, it can go higher on a wick based on the weekly or monthly timeframes. Surely, this is a new trading pair with no historical data, growth can definitely go beyond the chart.
These targets are based on Elliott Wave Theory and Fibonacci proportions, they can work as a map to help us navigate future price action as the bull market develops.
Thanks a lot for your continued support.
Namaste.
MEME

#MEME #MEMEUSDT #MEMECOIN #LONG #SWING #Eddy#MEME #MEMEUSDT #MEMECOIN #LONG #SWING #Eddy
MEMEUSDT.P SWING Long Setup
Important areas of the upper time frame for swing are identified and named.
This setup is based on a combination of different styles, including the volume style with the ict style.
Based on your strategy and style, get the necessary confirmations for this Swing Setup to enter the trade.
Don't forget risk and capital management.
The entry point, take profit point, and stop loss point are indicated on the chart along with their amounts.
The responsibility for the transaction is yours and I have no responsibility for not observing your risk and capital management.
By scratching the price and time bar, you can see the big picture of targets.
Buy Position "LONG" Spot & Future Details :
Entry : 0.002662
Stop : 0.002616 (( 1.73% ))
Target 1 : 50% Spot
Target 2 : 100% Spot
Target 3 : 500% Spot
Target 4 : 1000% Spot
Target 5 : 1500% Spot
Target 6 : 2000% Spot
Be successful and profitable.

Wen: Your Altcoin ChoiceWen had a bull market in 2024. A 1,300% bullish wave that peaked in March. After this wave, the market went down and finally sideways.
The bullish signal here comes from the volume indicator. The highest volume ever happened in late March 2025, just two weeks ago.
This much buying at bottom prices can easily indicate that whales are starting to load on this coin. Whales buying is something to always consider because whales are in the know. They know when the top is in and when the bottom is in. When they start buying, the market is soon to change. When they start selling, it is the end of a bullish phase.
Here we can see no volatility, no swings, no momentum and no volume until the market enters new All-Time Low territory. Once this new low levels are activated, there is a huge increase in trading activity, buying and selling. So participants had no interest in this pair, as soon as prices became low, we see a strong accumulation phase.
This signal is quite revealing, it tells that whatever is happening now is about to change.
WENUSDT went from going down to sideways and from sideways lower to a new All-Time Low. After this sideways and ATL period, we will experience a new wave of growth. That's based on market cycle, marketwide action, experience and the volume indicator. Prepare for massive growth.
Imagine a bullish wave that starts to build up now and peaks after 3 months. 1-2 months with momentum building up and the last month a major wave of growth. After this wave, the classic correction. But this correction won't lead to a new low and consolidation phase. Instead, this will be a quick correction that will lead to a new session of growth, the last and final; the bull market bull-run phase.
Thank you for reading.
Namaste.

PEPEUSDT - Now waiting for another 100% move.It already made a 100% move from the zone we mentioned earlier, breaking the downtrend line with a massive bullish candle on the 3-day timeframe.
It’s now on its way to forming a new all-time high (ATH).
Best regards Ceciliones 🎯

Waiting for a Perfect Entry! 🚀 SEED_WANDERIN_JIMZIP900:WIF in Uptrend – Waiting for a Perfect Entry! 📈
SEED_WANDERIN_JIMZIP900:WIF is currently in an uptrend! If you missed the entry, you can wait for a correction. Once the price comes back to the green zone, keep an eye out for confirmation to enter long! 🔥
Let’s catch the next opportunity together! 💼💸

MEMEUSDT:- Pennant Breakout coming up.BINANCE:MEMEUSDT - Breakout to the upside coming up in meme once it reaches the edge of the triangle. Expecting a huge upside. Keep watching the edge of the triangle in the days to come. Thank You!

DOGE - 1$ NextDoge is getting ready for the next wave. Based on the previous trend we are looking at the next target around 1.1$.
Doge can break 1$ easily based on the current trend and overall interested in DOGE.
Entry: 0.1766
TP1: 0.22086
TP2: 0.30439
TP3: 0.40104
TP4: 0.53436
TP5: 1.13587
Stop Loss: 0.1143
Follow us for more such ideas.
Cheers
GreenCrypto

Memecoin: A Modest $60 Trade in Mumu on SolanaMemecoin: A Modest $60 Trade in Mumu on Solana
➖ Bitcoin is growing slowly for now, and today I noticed that altcoins and memecoins have become more active.
➖ I decided to try investing a modest $60 in the memecoin Mumu, which has the potential for a +120% move.
➖ I'm not expecting massive gains; the lows have closed higher, similar to October 2024, with a move toward 161.8% on the Fibonacci retracement. I opened a trade on Solana.

MEME Main trend -97% Channel. Reversal or scam zone.Logarithm. Time frame 3 days (less is not needed).
🟡 The price has reached a decline from the highs (not a listing squeeze) -97%. These are practically the maximums of declines after the hype for cryptocurrencies of such liquidity (96-98), after which there is only a complete scam. At the moment, there is a reaction from this zone (the lower zone of the main trend channel) (impulse buyback), and a rollback after it, which forms the canvas of a potential ascending flag. If there is a breakthrough, then locally - the implementation of the ascending flag.
⚠️🔼 These are high-risk cryptocurrencies of such liquidity (that's why such declines are big), but the percentage of price growth in them, for the same reasons (liquidity/volatility) is an order of magnitude greater in the case of their implementation. When working with such assets, observe money management.
🟣 Implementation of the flag's goals (essentially to the channel median) +80-100%
🟡 To the resistance of the descending channel of the main trend +325%
🔵 To potential highs (one of the previous consolidations) +1000-1300%.

KASPER - THE GHOAST OF KASPA (TA + TRADE PLAN) BY BLAŽ FABJANTechnical Analysis for KASPER (KASPER/USDT) by Blaž Fabjan
Trend Analysis:
The chart indicates a rising wedge pattern on the horizon, a bearish reversal signal, which suggests a potential downward price movement after the completion of the pattern.
The price is currently in a consolidation phase, with a series of lower highs and higher lows within the wedge structure.
Support and Resistance Levels:
Resistance: The price has approached a resistance zone around the Wick High level, which indicates selling pressure in this area. A breakout above this resistance level could lead to a continuation of the upward trend.
Support: The Strong Low zone is acting as the lower support for the current price action, with buyers attempting to defend this level.
Indicators:
RSI (Relative Strength Index): Currently at 82.43, which is in the overbought territory, indicating that the asset may be overextended and susceptible to a pullback or correction.
MFI (Money Flow Index): The current MFI reading suggests an inflow of capital into the asset, indicating that the buying pressure is strong. However, if the price hits the overbought region, it could signal a reversal.
Stochastic: The stochastic oscillator is at 96.19, indicating that the price is in an overbought condition and might be due for a pullback or consolidation in the short term.
VMC Cipher B Divergences: The indicator is showing bullish divergence at the recent lows, suggesting that buying pressure could continue, but it needs to be validated by a breakout above resistance.
Volume:
The volume is gradually increasing, which is a positive sign for the continuation of the trend. However, volume spikes during a breakout are crucial to confirm the trend's strength.
Trading Plan for KASPER (KASPER/USDT)
Key Entry Levels:
Breakout Entry: If the price breaks above the resistance zone near 0.00001000, consider entering a long position. Set the take profit target at around 0.00001500 (strong bullish continuation level) for a potential 50% price increase.
Reversal Entry: If the price fails to break the resistance and starts falling towards the Strong Low support level near 0.00000500, consider entering a short position. A move below the Strong Low could signal a reversal of the current uptrend.
Stop-Loss and Risk Management:
Long Position Stop-Loss: Set a stop-loss just below the Strong Low (around 0.00000450) to protect from a sudden price drop. The stop should be tight as this asset is volatile.
Short Position Stop-Loss: If entering a short position, place the stop-loss above the resistance level at 0.00001050 to minimize losses in case of a breakout.
Target Levels:
Short-Term Target (Bullish): If the breakout occurs, consider targeting a price of 0.00001500 based on the rising wedge pattern's projected price target.
Short-Term Target (Bearish): If the asset fails to hold above the support zone and breaks lower, target the 0.00000350 level as the next potential support area.
Trading Psychology:
Patience: This is a volatile asset, and it's important to wait for clear confirmation of a breakout or breakdown before entering the trade.
Risk-Reward Ratio: Aim for a 1:3 risk-reward ratio, which ensures you are risking less compared to the potential reward on each trade.
Monitor Indicators: Regularly monitor the RSI, Stochastic, and MFI for overbought or oversold signals. Additionally, follow volume patterns closely to gauge market momentum.
Exit Strategy:
Exit the position once price targets are reached or if indicators show signs of an exhaustion or trend reversal (e.g., RSI turning downward from overbought levels, stochastic crossing down).
Given the current chart formation and technical indicators, KASPER could be poised for a breakout to the upside, but there is a high risk of a correction given the overbought conditions.
Caution is recommended: monitor price action closely and adjust your strategy accordingly to avoid entering too early in a rising wedge or an overbought market.

KASPY COULD BE THE NEXT BIG THING (TA+TRADE PLAN)Technical Analysis of KASPY (KASPY/USD) BY BLAŽ FABJAN
1. Price Action & Trend Structure:
Falling Wedge (Red Zone): The chart shows a classic falling wedge pattern, a bullish reversal formation. This indicates that the downtrend has slowed down, and a breakout could be imminent.
Descending Triangle (Top Right Zone): This descending triangle formation suggests consolidation near resistance. If KASPY breaks out above the horizontal line of the triangle, a move towards higher targets can be expected.
2. Key Support and Resistance Levels:
Bottom 1 (Green Box): A significant support zone that previously bounced the price upwards. This zone should hold if the price tests it again.
Bottom 2 (Green Box): Another crucial support level showing a potential buying area. This could act as a safety net in case the market dips.
Resistance Levels (Red and Blue Targets): The upper red zone represents significant resistance, where the price might face selling pressure. The chart shows targets aligned with these resistance zones.
3. Technical Indicators:
VMC Clipser (B Divergences): The indicator shows mixed signals with a divergence in the upward movement, suggesting potential reversal or continuation. The positive divergence is noted with green arrows indicating buying opportunities.
RSI (Relative Strength Index): RSI is at 50.97, indicating neutral market conditions. It is not overbought or oversold, which suggests that there is room for price action in either direction.
Money Flow Index (MFI): The MFI value is 54.13, which confirms that there is moderate buying interest. MFI values above 50 suggest positive money flow, supporting potential upside movement.
Stochastic Oscillator: The stochastic oscillator shows a level of 21.93, indicating an oversold condition. This could signal an upward bounce as the market may be ready to reverse.
4. Market Sentiment & Time to Bounce:
The chart annotation “Time to Bounce” suggests a potential upward price movement after consolidating within the rectangle and descending triangle formation. The market sentiment appears to favor a bullish breakout.
Trading Plan
Entry Points:
Primary Entry: If KASPY breaks above the upper boundary of the descending triangle, targeting the breakout point at around 0.0000020 (upper resistance zone), this could be the ideal entry point for a bullish trade.
Secondary Entry (Bounce Play): If the price approaches the support areas (Bottom 1 or Bottom 2), consider entering long positions as the price bounces upward off these zones. The oversold conditions in the stochastic oscillator provide confidence for a potential bounce.
Target Levels:
Target 1: Around the upper red zone resistance (0.0000020), which has already been marked as a target in the chart.
Target 2: The second resistance zone at 0.0000025, aligning with the overall market conditions.
Long-term Target: A breakout could send the price higher to 0.0000035 (or higher), depending on the strength of the breakout.
Stop Loss & Risk Management:
Stop Loss: Place stop loss orders below the support level (around 0.0000015) to minimize losses if the price fails to hold at support. A tighter stop loss could be placed just below the bottom of the falling wedge.
Risk-to-Reward Ratio: Aim for at least a 3:1 risk-to-reward ratio for this trade, ensuring that the potential profit justifies the risk taken.
The KASPY chart shows a favorable setup for a potential bullish move, with a falling wedge pattern and a descending triangle indicating a possible breakout. Key indicators support this outlook, with neutral RSI and a favorable stochastic reading. The trading plan includes strategic entry points, realistic target levels, and prudent risk management.

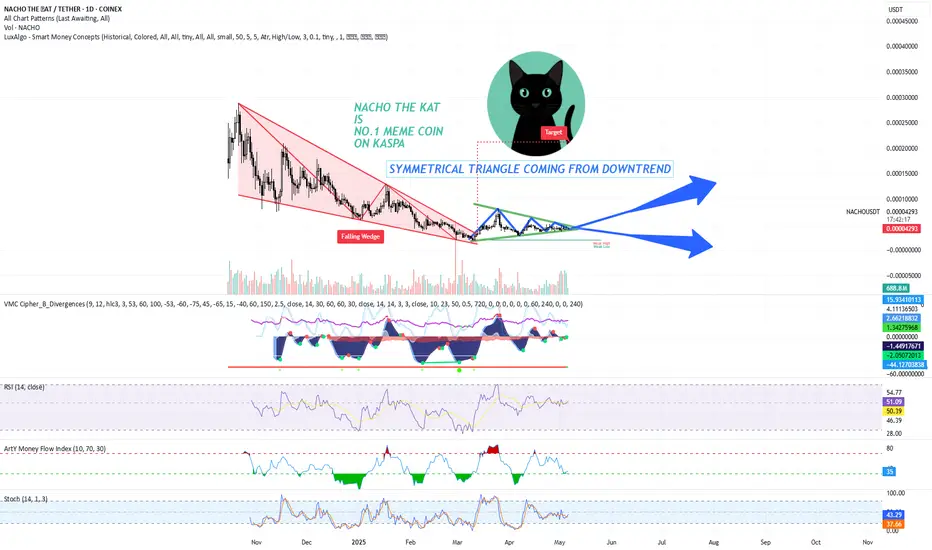
NO.1 MEME COIN ON KASPA IS NACHO THE KAT - DYORThe chart shows a symmetrical triangle pattern forming after a falling wedge. A falling wedge is typically seen as a bullish reversal pattern, indicating that the price may break out to the upside after the convergence of the trendlines. The symmetrical triangle, which is forming after the falling wedge, suggests consolidation before the breakout, likely pointing towards higher price action.
Key Points
Price Action and Trend:
NACHO has been in a downtrend, creating a falling wedge. The falling wedge has converging trendlines, which is a common setup for a bullish breakout.
Currently, the price is consolidating within a symmetrical triangle pattern, with lower highs and higher lows, indicating indecision in the market. The breakout from this triangle is likely to be significant, either continuing the previous downtrend or initiating a bullish reversal.
Volume Analysis:
The volume profile at the bottom shows an increase in volume as the price approaches the apex of the symmetrical triangle, suggesting potential strength behind the breakout.
It's important to monitor if volume increases further upon breakout to confirm the strength of the move.
Key Indicators:
RSI (Relative Strength Index): The RSI is currently around 50.39, suggesting a neutral market sentiment. The RSI has been ranging between oversold and overbought territories, which indicates that NACHO has not yet entered a strong trend but may be preparing for one.
Stochastic RSI: The Stochastic RSI is hovering around 37.57, showing a neutral stance, but it is closer to the oversold region, which could indicate that NACHO is near a potential reversal.
Money Flow Index (MFI): The MFI is at 35, indicating that the market is not yet in a strong buying or selling pressure zone. This shows that there is room for price movement based on volume.
VMC Cipher B Divergences: Positive divergence could suggest bullish momentum emerging, even if the price remains in consolidation.
Target and Resistance Levels:
If NACHO breaks out to the upside from the symmetrical triangle, the target is likely near the upper trendline of the wedge, which aligns with previous highs, possibly reaching the 0.00004500-0.00005000 USDT range.
Immediate resistance is near the 0.00004300 price level.
Support levels to watch are 0.00003000 and 0.00002000, which are key levels from previous price action.
Trading Plan
Entry Strategy:
Breakout Strategy: A strong breakout above the upper trendline of the symmetrical triangle would be a potential buy signal. If the price breaks and closes above 0.00004200, consider entering a long position with a target at 0.00004500-0.00005000.
Volume Confirmation: Ensure that the breakout is accompanied by an increase in volume. A low-volume breakout could be a false signal.
Stop-Loss Strategy:
Initial Stop-Loss: Place a stop-loss just below the symmetrical triangle's lower trendline or 0.00003000. This provides a reasonable distance to avoid being stopped out on small fluctuations.
Trailing Stop: As the price moves up towards your target, consider adjusting your stop-loss to lock in profits, especially if the price exceeds the 0.00004300 resistance level.
Take-Profit Strategy:
First Profit Target: Set a take-profit order around 0.00004500, the first resistance level. This is a key point based on the historical price action and previous swing highs.
Secondary Target: If the price breaks past 0.00004500, adjust the target to 0.00005000, which is the next logical resistance zone.
Risk Management:
Position Sizing: Risk no more than 1-2% of your total capital on this trade. For example, if your trading account is $5,000, you should risk no more than $100-$150 per trade.
Risk-Reward Ratio: Aim for a minimum 2:1 risk-to-reward ratio. For example, if you risk $150 on a trade, aim for a potential reward of $300 or more.
Additional Considerations:
Market Sentiment: As NACHO is a meme coin, market sentiment plays a huge role. Watch for social media trends and any news related to meme coins or Kaspa-based coins that could drive the price action.
Macro Conditions: Stay updated on the general market conditions for cryptocurrencies, as a broader downtrend in the market could limit the upside potential, even if technicals suggest a breakout.
NACHO THE KAT presents a technical setup with the potential for an upward move following a breakout from the symmetrical triangle. A close watch on volume and key price levels will be critical for confirming the breakout and determining the right moment for entry.
MEME/USDT: BREAKOUT ALERT!!🚀 MEME Breakout Alert – 40%+ Potential Incoming?! 👀🔥
Hey Traders! If you're all about high-conviction plays and real alpha, smash that 👍 and tap Follow for more setups that actually deliver! 💹💯
🚀 AMEX:MEME / USDT Long Setup – Breakout Watch! 🚀
AMEX:MEME is squeezing inside a symmetrical triangle on the 1H chart and is now testing breakout levels! Get ready for a potential explosive move! 📈⚡
📊 Trade Setup:
✅ Entry: CMP and add more in dip
✅ Targets:
• Target 1 → $0.00260
• Target 2 → $0.00290
• Target 3 → $0.00302+
🛡 Stop Loss (SL): $0.00207 (below triangle support)
📌 Why this setup?
Tight consolidation near apex
Strong EMA support
Previous breakout gave ~40% move!
⚠️ Risk management is key! Wait for confirmation, and always stick to your SL.
💬 Share your thoughts below — bullish or cautious on MEME? Let’s discuss! 👇👇

OFFICIAL TRUMP Update —Your Guide Through Light & DarkIt gets better and better. Yesterday TRUMPUSDT produced the highest session close since 3-March. Think about it... The bottom is fully in and confirmed and now almost two months of bearish action have been completed obliterated. The action is happening now the same as if it were early February 2025.
Another interesting fact is that almost two months of bearish action has been deleted but the chart is only a little over 3 months old. The bears are no more we are in the bullish zone.
This is important and a strong confirmation.
TRUMPUSDT started trading when the market was bearish and moving within a strong corrective phase. The correction for the last major 2024 bullish wave.
Corrections are tough I agree and the market bleeds but they end and once they end the action turns the other way and that's what you are seeing today.
There is no doubt here, nothing to fear, the rise won't stop it is only getting started. Make no mistakes.
How far up TRUMPUSDT will grow is only speculation but you can expect a new All-Time High for sure. And that's easy for a Cryptocurrency project and one with so much buyers, holders, attention and market support.
This is a simple update mentioning the highest close in months, the bottom is in and bullish continuation confirmed. Keep holding and you win. Keep buying, double-win. Only sell when the market reaches new All-Time High and is full green.
Right now is the time to buy and hold, when prices are low. Only when prices are high we take the profits and move on.
Trading is meant to make money. To make money, you have to let go of your position once the market grows.
Prepare now. Plan ahead of time.
You will do great. You have my support.
Thanks a lot for your continued support.
I will be your guidance through the light and through the dark.
Namaste.
MEME price analysis⁉️ Maybe #MEME is trying to start the memecoin 2.0 season?)
Before the strong resistance from above, the growth potential is 400%, but even this will not be much consolation for those who bought OKX:MEMEUSDT a year ago.
But again, in accordance with the assumption that was written a few posts earlier: coins with market caps in the range of $50-100 million are starting to “pumping”.
💰 In general, if the CRYPTOCAP:BTC price in April is kept above $79-80k (9 days left), then May may turn out to be quite generous.
_____________________
Did you like our analysis? Leave a comment, like, and follow to get more

#MEME/USDT#MEME
The price is moving within a descending channel on the 1-hour frame, adhering well to it, and is on its way to breaking it strongly upwards and retesting it.
We are seeing a bounce from the lower boundary of the descending channel. This support is at 0.001424.
We have a downtrend on the RSI indicator that is about to break and retest, which supports the upward trend.
We are looking for stability above the 100 moving average.
Entry price: 0.001452
First target: 0.001496
Second target: 0.001537
Third target: 0.001586

Trading opportunity for DOGEUSDTBased on technical factors there is a Sell position in :
📊 DOGEUSDT
🔴 Sell Now
🪫Stop loss 0.18300
🔋Target 0.12000
📏 R/R 1,5
💸RISK : 1%
We hope it is profitable for you ❤️
Please support our activity with your likes👍 and comments📝

Meme - Pump?I know a person who is has drowdown position in a 98 percent
Do you think there will be a Pump?

(DOGE) dogecoin "fantasy"is the fantasy over for Dogecoin? The future version versus the present tense, versus the past, is something to speculate over and theorize on whether what people say about what happened in the past versus the past few months, is worth taking a look at. All the time in music people compress music and think the music is better afterwards. By applying the same logic to this Dogecoin chart I am sure all of you would say that you would prefer the uncompressed version.

TURBO long-term outlookAfter completing its first cycle TURBO seems to stabilize around the 0.0010-0.0020$ region which marks the last ATH from 2023. What's interesting here is that TURBO follows the DOGE coin pattern levels almost to a T, in speedrun mode. It is absolutely not the same structure but it respects the same trading ranges and shows a lot of similarities, which is quite remarkable.
Watch out for this yearly trendline in the TURBO chart and expect some volatility for the next months. Breaking under 0.0010$ could potentially confirm a longer downtrend if we don't see a big impulsive bounce to the upside in the near future.

$14 to $229 in 2 days! $NMAXThis stock $14 yesterday, $229 today 😱 No this is not April 1st joke, stock name NYSE:NMAX

#PONKE #PONKEUSDT #PONKECOIN #MEMECOIN #MEME #Analysis #Eddy#PONKE #PONKEUSDT #PONKECOIN #MEMECOIN #MEME #Analysis #Eddy
PONKEUSDT.P Higher Time Frame Analysis
⚠️ (( "WARNING" : This is an Requested Analysis & I do not recommend investing large amounts of money in it because it is a meme coin.)) ⚠️
Important areas of the higher time frame are identified and labled.
Everything is clear and I have clearly drawn the important areas in the chart and the labels and names of the areas are included. Depending on your analytical style, you can get the necessary confirmations and see the reduction from the marked areas to the specified targets.
This Analysis is based on a combination of different styles, including the volume style with the ict style.
Based on your strategy and style, get the necessary confirmations for this analysis to buy entery the trade.
Don't forget risk and capital management.
The responsibility for the transaction is yours and I have no responsibility for not observing your risk and capital management.
💬 Note : The price can go much higher than the first target, and there is a possibility of a 200% pump on this currency. By observing risk and capital management, obtaining the necessary approvals, and saving profits in the target, you can keep it for the pump.
Be successful and profitable.

KANGO TO THE MOON! TECHNICAL ANALYSIS🔸 Chart Pattern: Falling Wedge Formation
KANGO has been trading inside a well-defined falling wedge, a classic bullish reversal pattern that often signals a potential breakout after sustained downtrend pressure. The price is nearing the apex and has started to show signs of bullish momentum, testing the upper resistance of the wedge.
🔸 Key Technical Highlights:
Support Zone: 0.00001200 – 0.00001800 USDT
Resistance Zone: 0.00010000 – 0.00018000 USDT
Breakout Trigger: A confirmed breakout above 0.00002000 USDT with volume confirmation
🔸 Indicators:
VMC Cipher B: Bullish divergence detected, momentum turning green, indicating hidden buyer strength
RSI (14): 45.43 and climbing – neutral territory, leaving room for a strong upward move
MFI (Money Flow Index): Currently at 56, suggesting renewed accumulation and capital inflow
Stochastic RSI: Oversold (~20), pointing to an imminent bullish crossover
🔸 Volume Analysis:
A visible volume squeeze is occurring; a spike in volume could catalyze a breakout and rapid price appreciation.
🚀 KANGO TO THE MOON 🔥
🎯 Falling wedge pattern? Check. Bullish divergence? Check. Meme coin magic? DOUBLE CHECK.
KANGO is locked, loaded, and ready to blast off! After months of consolidation, it's tightening the coil inside a textbook falling wedge, and the breakout zone is just a breath away. With bullish momentum building and the community revving up, all eyes are on KANGO to flip resistance into launch fuel. 🌕🚀
From stealth mode to beast mode – the KANGO ROCKET is warming up.
📈 Eyes on the 0.00002000 zone – a clean break here and it’s liftoff time!
🔥 If you're not strapped in yet, this might be your final boarding call.
👉 KANGO isn't just a meme. It's a MOVEMENT.
