PEPEUSDT - bottomed out!Pepe has dropped by more than 80% in the past period, making it one of the most heavily declining coins.
The coin is now sitting on a very strong key support level, so we expect a strong rebound in the coming days.
MEME

(DOGE) dogecoin "oversold indications"The price of Dogecoin is considered oversold based on an Elliott Wave custom pattern by DGT that I sometimes use to look for overbought and oversold signals. The four diamonds is similar to Jasmycoin's oversold signals.

BTCUSD Daily Updated Outlook and V-Shape Recovery
🏆 BTC Market Update
📊 Technical Outlook
🔸Mid-term: BEARISH OUTLOOK
🔸Status: 40% correction in progress
🔸Potential V-shape recovery
🔸Similar fractal to 2021
🔸105 000 - 68 000 40% correction
🔸68 000 - 118 000 - 80% gains
🔸Price Target Bears: 68 000 USD
🔸Price Target BULLS: 118 000 USD
📉 Market Dynamics:
💰 BTC Pulls Back – Bitcoin corrects 🔻22% from its all-time high, but analysts see a potential rebound ahead. 📊📈
🏦 Institutional Power Play – MicroStrategy holds nearly 500K BTC at an average price of $66K, planning to buy more with a $21B stock issuance. 📉💎
🌎 Global Bitcoin Developments:
🇧🇹 Bhutan's Secret Stash – The country holds $750M in BTC, making up 28% of GDP, powered by hydro-mining. ⚡⛏️
⚖️ U.S. Crypto Regulations – Stricter rules under President Trump aim to integrate crypto into traditional finance. 📜🏦
🕵️♂️ Satoshi Mystery Continues – New theories emerge about Bitcoin's anonymous creator. 🤯🔍

Dogecoin will reach 2$Chart Analysis:
1. Timeframe and Price Context
Timeframe: Daily chart (each candlestick represents 1 day of trading).
Price Levels:
The current price is $0.1798, as indicated on the chart.
The price range on the chart spans from approximately $0.0800 (early 2024) to a peak near $0.3000 (late 2024), followed by a correction to the current level.
Trend Overview:
Early 2024: Dogecoin starts around $0.0800 and experiences a gradual uptrend with volatility, eventually rallying sharply.
Late 2024: The price peaks near $0.3000 before correcting downward into a consolidation phase.
Early 2025: The price is consolidating within a symmetrical triangle, with the current price at $0.1798.
2. Key Patterns and Annotations
Symmetrical Triangle:
The chart shows a symmetrical triangle pattern, which is a neutral consolidation pattern that typically signals a continuation of the prior trend (in this case, an uptrend).
Upper Trendline: A descending trendline starting from the $0.3000 peak, acting as resistance.
Lower Trendline: An ascending trendline starting from the $0.0800 low, acting as support.
The price is near the apex of the triangle, indicating an impending breakout (upward or downward).
Breakout Prediction:
An upward arrow with the annotation "TG 1 $5" suggests a bullish breakout targeting $5.00—a highly ambitious target representing a ~2,680% increase from the current price of $0.1798.
"FATE LOVES IRONY":
The image and text "FATE LOVES IRONY" (featuring a Doge meme with a spiral sun and flames) likely reflect a playful or ironic sentiment often associated with Dogecoin’s community. It may imply that despite Dogecoin’s origins as a meme coin, it could defy expectations with a massive rally—an ironic twist.
3. Support and Resistance Levels
Support:
The lower trendline of the symmetrical triangle (around $0.1400-$0.1600) has acted as support during the consolidation phase.
If this support breaks, the next significant level could be around $0.0800-$0.1000 (a prior support zone from early 2024).
Resistance:
The upper trendline of the triangle (around $0.2000-$0.2200) is the immediate resistance.
Beyond that, $0.3000 (the recent high) is a major resistance level.
The $5.00 target is a long-term, speculative goal far beyond current levels.
4. Volume and Momentum (Not Visible but Inferred)
Volume bars are not clearly visible, but typical behavior suggests:
Volume likely increased during the rally to $0.3000 and decreased during the consolidation phase within the triangle.
A breakout would require a volume spike to confirm, especially if the price breaks above the upper trendline (around $0.2000-$0.2200).
Momentum indicators (e.g., RSI or MACD) could indicate whether Dogecoin is oversold or showing bullish divergence, supporting a breakout.
5. Potential Scenarios
Bullish Breakout:
If Dogecoin breaks above the upper trendline (around $0.2000-$0.2200) with strong volume, it could confirm a bullish breakout.
The first target would likely be the prior high of $0.3000 (a ~67% move from $0.1798). The $5.00 target, while ambitious, would require extraordinary momentum, likely driven by significant market catalysts (e.g., meme coin hype, endorsements, or broader market rallies).
Bearish Breakdown:
If the price fails to break the upper trendline and instead drops below the lower trendline (around $0.1400-$0.1600), it could signal a bearish breakdown.
The next support at $0.0800-$0.1000 could be tested, potentially leading to further downside.
Consolidation:
If the price remains within the triangle (between $0.1600 and $0.2200), it might continue to consolidate until a catalyst triggers a breakout.
6. Market Context
Meme Coin Dynamics: Dogecoin is heavily influenced by retail sentiment, social media hype, and endorsements (e.g., from figures like Elon Musk). The "FATE LOVES IRONY" annotation captures the speculative and ironic nature of Dogecoin’s potential for massive gains despite its meme origins.
Broader Market Trends: Dogecoin often correlates with Bitcoin and Ethereum (as seen in your previous charts). If BTC and ETH break out (e.g., BTC to $120,000, ETH to $4,000), it could create a bullish environment for altcoins and meme coins like DOGE.
Timing: The chart’s position near the triangle’s apex suggests a breakout could occur within days to weeks on a daily timeframe.

ELON - Bullish White SwanThis chart speaks for itself: A bullish White Swan pattern has formed on the ELON USD chart, which is very bullish.
This is not a financial advice. DYOR

(ETH) ethereum "nft land"I was recently looking into NFTs on Opensea and while doing so I noticed there are far more NFTs from people based on the Ethereum blockchain compared to the other offerings on Opensea. Even though Solana (SOL) is on the forefront of popularity with Meme projects Opensea does not offer an exclusive Solana chain to provide NFT ideas. Hence, there is not an easy way to compare to amount of Solana projects to Ethereum projects being built, developed and/or offered. It would be interesting to see the comparison of NFTs on Solana versus Ethereum. Ethereum reduced their transactions with a transition to Proof-Of-Stake and since then the number of Ethereum NFTs must be growing. While the news is on a constant watch for new meme projects, tokens, the Opensea network for many other blockchains is not growing as nearly rapidly as Ethereum.

(TOTAL) total crypto mcap "candles on record [history"worst red candles on record in the past four years and various progresses of positive growth measured from lowest in between points.

(DOGE) dogecoinfor dogecoin holders in the world to see a bit of pay per view imagery to make their mouth water. The colors, the picture, the imagery; ooh la la.

#MEME/USDT#MEME
The price is moving in a descending channel on the 1-hour frame and is adhering to it well and is heading to break it strongly upwards and retest it
We have a bounce from the lower limit of the descending channel, this support is at a price of 0.00284
We have a downtrend on the RSI indicator that is about to break and retest, which supports the rise
We have a trend to stabilize above the moving average 100
Entry price 0.00309
First target 0.00334
Second target 0.00355
Third target 0.00381

Supply and Demand Zones Trading in Forex: A Detailed OverviewSupply and demand zones are a core concept in price action trading, helping you spot areas of strong buying or selling interest. Mastering these zones can help you predict reversals, breakouts, and continuations with high accuracy. Let’s dive in! 🚀
🧠 What are Supply and Demand Zones?
📉 Supply Zone (Bearish): An area of high selling pressure where price tends to drop. It forms when sellers overwhelm buyers.
📈 Demand Zone (Bullish): An area of high buying pressure where price tends to rise. It forms when buyers overpower sellers.
These zones act like magnets for price — when price returns to these levels, you often see strong reactions.
🗂️ Characteristics of Strong Zones
✅ Sharp Price Movement: Strong supply and demand zones create fast and aggressive price moves away from the area. 💥
✅ Multiple Rejections: The more times a zone holds and rejects price, the stronger it is. 🛑
✅ Freshness: The first retest of a fresh zone often yields the strongest reaction. 🆕
✅ Volume Spike: Higher volumes show genuine interest from large players. 📊
🎯 How to Identify Supply and Demand Zones
1️⃣ Find Strong Moves: Look for big bullish or bearish candles after a consolidation or small pullback.
2️⃣ Mark the Base: Draw a rectangle from the start of the strong move to the end of the consolidation.
3️⃣ Adjust for Wick/Body: Include the entire wick for aggressive zones or just the body for conservative zones.
📈 Bullish Supply and Demand Zone Strategies
1️⃣ Demand Zone Bounce (Buy Setup)
🛑 Identify: A clear demand zone with a strong bullish move away.
📉 Wait: For price to return to the zone.
🕯️ Confirm: With a bullish candlestick pattern (like Hammer, Engulfing).
🎯 Enter: A buy order at the zone’s edge.
🛡️ Stop Loss: Below the zone’s low.
🏁 Target: Nearest supply zone or strong resistance.
💡 Example: Price rallies from 1.2000, pulls back to the same zone, then forms a bullish engulfing — you buy.
2️⃣ Demand Zone Breakout (Continuation Setup)
🛑 Identify: A demand zone forming a higher low in an uptrend.
💥 Breakout: Wait for price to break the supply zone above.
📉 Retest: When price retests the broken supply (now demand), enter long.
💡 Example: Price breaks 1.2500 resistance, retests it, and bounces higher — you enter.
📉 Bearish Supply and Demand Zone Strategies
3️⃣ Supply Zone Rejection (Sell Setup)
🛑 Identify: A clear supply zone with a strong bearish move away.
📈 Wait: For price to return to the zone.
🕯️ Confirm: With a bearish candlestick pattern (like Shooting Star, Engulfing).
🔻 Enter: A sell order at the zone’s edge.
🛡️ Stop Loss: Above the zone’s high.
🏁 Target: Nearest demand zone or strong support.
💡 Example: Price spikes up to 1.3000, then drops sharply — on a retest, you short.
4️⃣ Supply Zone Breakout (Continuation Setup)
🛑 Identify: A supply zone forming a lower high in a downtrend.
💥 Breakout: Wait for price to break the demand zone below.
📈 Retest: When price retests the broken demand (now supply), enter short.
💡 Example: Price breaks 1.1800 support, retests it, and drops further — you enter short.
🛠️ Tools to Enhance Supply and Demand Trading
🧰 Support & Resistance Levels – Combine zones with horizontal levels for added confluence.
📐 Fibonacci Retracements – Zones aligning with Fibo levels are extra strong.
📉 Trendlines – A zone break + trendline retest makes a powerful entry signal.
📊 Volume Analysis – High volume confirms genuine buying or selling pressure.
⏳ Timeframes & Zone Strength
⏱️ Higher Timeframes (4H, Daily, Weekly):
Stronger & more reliable zones.
Great for swing trading.
⏱️ Lower Timeframes (5M, 15M, 1H):
More frequent but weaker zones.
Ideal for day trading or scalping.
⚠️ Common Mistakes to Avoid
❌ Forcing trades: Not every zone gives a valid signal — be patient.
❌ Ignoring context: Always follow the trend unless there’s clear reversal evidence.
❌ Skipping confirmation: Wait for candlestick patterns and rejections.
❌ Poor risk management: Always set a stop loss and manage position size.

THE CLV WHALES BREAK..THE CLV WHALES BREAK..
CLV interesting for new voluume
Always manage the risk since it has shown an increased trend of 60% to risky to enter directly with no plan.
There is high chance this coin can break up $0,10 coming time

DOGE - LONGI think Doge will rise soon. It has support around 0.155, and I don't think it will break. The star meme coin is ready to bounce back after a 50% drop. The Fear & Greed Index is at 10, which hasn't happened since 2022. It's the right time to buy, at least on SPOT, as it will make big moves.

AGi/USDT IT"S TIME FOR THIS CYLCE COIN TO MOON NO 1 - Moon coinAGi/USDT IT"S TIME FOR THIS CYCLE COIN TO MOON NO 1 - Moon coin
can show interesting targets.
There is silent whale building on this coin since the breakdown

Market Update: Caution on $PEPEMarket Update: Caution on CRYPTOCAP:PEPE
There was hope. The consolidation looked exhausted, and a daily pump was forming.
Then Bybit got hacked , Bitcoin dumped, and now everything seems canceled.
⚠️ Warning: CRYPTOCAP:PEPE , despite being a solid and well-managed meme coin, is still a meme. Institutions appear to be selling off anything that looks like an animal in crypto.
What to Do Now?
✅ Wait for market stabilization— CRYPTOCAP:PEPE is at an attractive price, but it can drop much lower.
✅ Refill your bag at the bottom of the correction, not during dead cat bounces —unless you're a pro at trading bearish markets.
The Reversal Will Be EPIC! 🚀
This is temporary. Once the market bottoms out, the bounce could be massive. CRYPTOCAP:PEPE can do x2 or x3 in a month when sentiment improves!
🔍 DYOR

TRISIG/UDST NEW INCREASE VOLUMETRISIG/UDST NEW INCREASE VOLUME
Data shows that this coin can get a new increase volume coming time.

AVAAI/USDT NEW INCRAESE VOLUMEAVAAI/USDT NEW INCREASE VOLUME
Can have a new uptrend in the coming time depending on the last data.

a/b/c/d/e/g BTC price fractal buy low tp 107 000 usd🔸Hello traders, today let's review 4hour price chart for BTCUSD . we are still
stuck in range since december, range highs at/near 108k, range lows at 90k.
🔸speculative a/b/c/d/e/g price fractal in progress. expecting breakdown of the
recent trading range with a subsequent throwback inside range and re-test of range highs.
🔸a/b/c/d/e/g fractal point a/c 92k, point b/d/g 107k, point e 83/84k.
similar fractal observed in march 2024 a/c 62k. b/d/g 72k, point e 57k.
🔸Recommended strategy: BUY LOW near liquidity OBs 83/84k usd, TP bulls is fresh overhead liquidity at/near 106/108K. expecting decent bounce in this market after pullback.
🎁Please hit the like button and
🎁Leave a comment to support our team!
RISK DISCLAIMER:
Trading Futures , Forex, CFDs and Stocks involves a risk of loss.
Please consider carefully if such trading is appropriate for you.
Past performance is not indicative of future results.
Always limit your leverage and use tight stop loss.

GOAT - LONGRisky but high profit entry. Be very careful. If it breaks that support it will go very low.
TP 1: 0.75
TP 2: 0.92

TRUMP - LONGRisky trade on TRUMP, it should bounce in these areas. I don't recommend using too much capital. Protect the trade soon.

300% gains BONK Best Level to BUY/HOLD swing trade setup🔸Hello guys, today let's review daily price chart for BONK. Outlook remains bullish currently pullback in progress, however buying low still is a perfect trade setup.
🔸BONK is one of the top rated solana meme coins. currently undergoing correction and still not complete, however risk/reward is shifting in bulls favor right now. we are close to the floor / reload zone for the bulls.
🔸Recommended strategy bulls: Price action contained within bullish channel. get ready to buy low near 11000/13000, TP is 33000/36000 +300% gain. BUY/HOLD setup for patient traders. keep in mind that BONK already got a heavy valuation, so do not expect miracle overnight gains.
🎁Please hit the like button and
🎁Leave a comment to support our team!
RISK DISCLAIMER:
Trading Futures , Forex, CFDs and Stocks involves a risk of loss.
Please consider carefully if such trading is appropriate for you.
Past performance is not indicative of future results.
Always limit your leverage and use tight stop loss.

Tokenomics: How to avoid scams and fake projects?I've decided to write about the scams, Ponzi schemes, and fake projects in the crypto industry.
I'm a developer with 30+ years of experience in Web2, gaming (Unity, Unreal), and Web3. With this background, I can quickly spot fake projects riding a hot narrative that will never deliver or that mislead investors about their business model.
Meme Coins vs. Big Projects – Who's the Real Scam?
The common belief is that meme coins are scams. While some are, others have better tokenomics and fundamentals than major Layer 1 projects. On the other hand, big funded projects aren’t necessarily more honest—their scams are just more sophisticated, preying on investors' lack of technical knowledge.
Most Common Crypto Scams & Red Flags
1️⃣ Coins promising cheaper services using their own token 🚩
Many projects claim that using their token will make their services cheaper (e.g., Filecoin, Render). Why is this a scam?
If the coin succeeds and its price rises, then the service becomes more expensive—making it worse than the competition.
This contradicts their entire business model, proving it's unsustainable.
2️⃣ DeFi protocols without 1:1 backing 💰💀
Many bridges and lending protocols use their own token as collateral—this is a disaster waiting to happen (e.g., Thorchain, Thorswap).
As long as the token holds value, the system works.
But if FUD spreads, a bank run will wipe out liquidity and make the protocol insolvent—there’s no safety net.
3️⃣ Gaming projects claiming to use AI agents 🎮🤖 (It’s a lie!)
It is technically impossible to have AI-powered NPCs in a game at scale (e.g., Astra Nova).
AI agents require 12GB+ of VRAM per instance—you cannot have hundreds running in a game.
Many GameFi projects slap "AI" on their marketing because investors don’t know better.
🔍 How to spot a fake GameFi project:
No shadows on characters (e.g., BigTime, Valhalla) = outdated pre-2000s tech
"Arcade games" = nobody cares about them
League of Legends clones = LoL is 15+ years old!
Claims of 80+ devs = At EUROTLX:4K + per dev, that’s $380K/month in salaries—do the math!
Legit Meme Coins Can Be Better Than "Big Projects"
Example: CRYPTOCAP:PEPE 🐸
Despite being a meme, CRYPTOCAP:PEPE has better tokenomics than most of the top 200 projects.
✔️ No staking = No inflation (fixed supply, no endless token dilution).
✔️ No central ownership = No rug pulls (tokens distributed to the community).
✔️ Strong market makers (e.g., Wintermute).
✔️ No fake narrative—it’s just a meme, no BS.
✔️ Huge liquidity & low slippage on major exchanges.
Final Thoughts
🚫 Don’t judge a project by its marketing—check its fundamentals!
✅ Avoid inflationary projects
✅ Avoid projects with too many insiders
✅ Avoid narrative-based scams that sell you fairy tales
💡 Hope you found this post insightful!
DYOR! 🧐

Bull Meme: Golden BreakthroughThe first meme coin draws a bull flag! You know, it's like finding an undervalued stock in a pile of garbage - rare, but it happens. In the medium term, I expect the growth to 1.618 Fibonacci levels - the golden ratio, friends, nature is not wrong. Plus, a small bullish divergence is coming.
Horban Brothers.

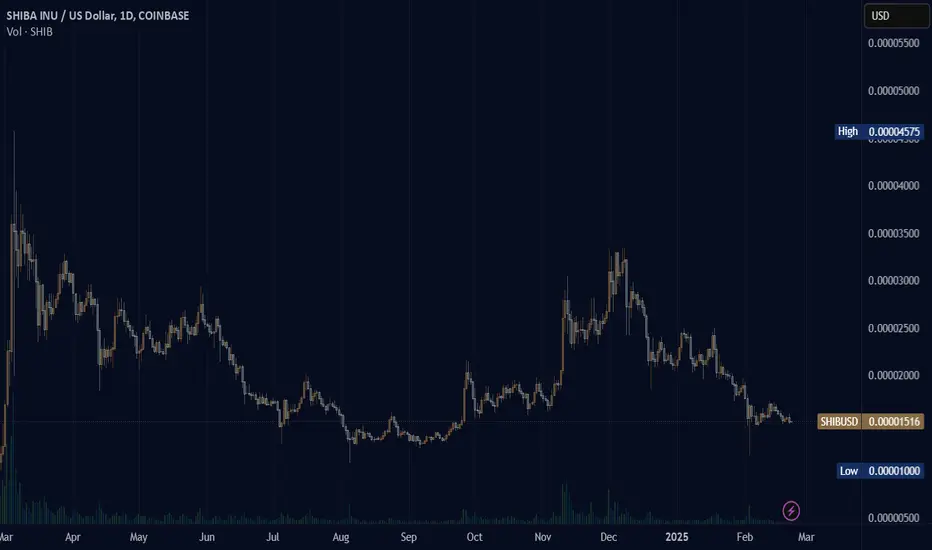
(SHIB) shiba inuThere is no cup and handle coming. The activity online by community programmer Kusama and other people seem to have led to a disgracing of the SHIB token and all that has happened is losing. Too much talk, not enough action. Silence is golden inu. There is still hope for Shiba Inu on the likes the acceptance of Shiba came far before many other meme tokens. Right now the Solana craze is being phased out in favor of Base chain memes. Base seems to be countering the popularity of Ethereum. Shiba Inu on Ethereum is not seen as trending the same way Solana memes and now Base memes are trending.