Bitcoin Total Market Cap Update – Strategic Scenarios AheadAs of May 8, 2025, the total cryptocurrency market capitalization stands at approximately \$3.012 trillion, reflecting a 2.17% increase from the previous day . Bitcoin's market cap is around \$1.962 trillion, with a current price of \$98,798.11 .
Given these figures, we are considering the following potential scenarios for the crypto market:
---
1. Break Above \$3T and Hold ✅ (30% Probability)
* The market breaks through the \$3 trillion level.
* Retests it as support.
* Continues the bullish momentum from there.
---
2. Rejection and Consolidation 🔁 (50% Probability)
* Price gets rejected at \$3T.
* Moves sideways between \$2.8T and \$3T.
* Eventually breaks out and retests \$3T as support before resuming upward.
---
3. Bearish Turn Below \$2.8T 🔻 (20% Probability)
* Rejection at \$3T.
* Market loses \$2.8T support.
* Retests \$2.8T as resistance, followed by further downside pressure.
---
Key Levels to Watch
* \$2.8T and \$3T are critical zones. Movements between these levels indicate uncertainty and should be approached with caution.
---
Our Perspective
A retest of \$3T as support could present the strongest buying opportunity of this cycle. We urge everyone to stay alert, analyze carefully, and prepare accordingly.
Golden Cross is looming — remain focused and disciplined.
---
Stay updated and connected:
With best regards,
Team ProCryptoEdge
Educate. Empower. Elevate.
Memecoin

PEPE BUY ...Hello friends
Due to the price drop, good conditions have been created to buy with risk and capital management and move towards the specified goals...
If you are risk-averse, this signal is for you...
*Trade safely with us*

FARTCOIN Breakout and Potential RetraceHey Traders, in today's trading session we are monitoring FARTCOIN for a selling opportunity around 1.1650 zone, FARTCOIN was trading in an uptrend and successfully managed to break it out. Currently is in a correction phase in which it is approaching the retrace area at 1.1650 support and resistance zone.
Trade safe, Joe.

PENGUUSDTA risky analysis of a popular meme coin..
Based on this analysis, we are in wave 4 and it is expected to end soon and enter wave 5..
Around 0.091 to 0.085, if the price reaches it, it will be suitable for a short swing to the target of 0.0163 and 0.0175..
Ideal time zones are also marked with low tolerance..
This analysis can be easily filled..

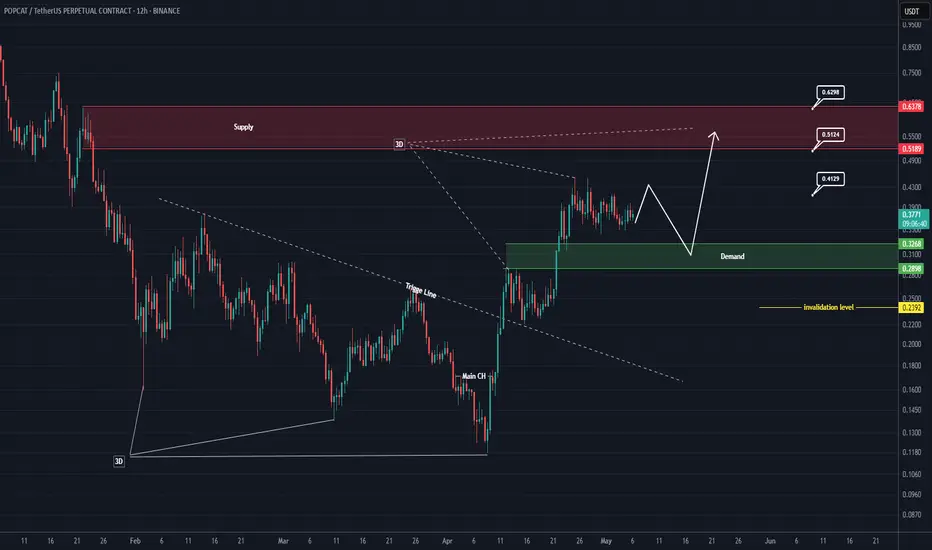
POPCAT Looks Bullish (12H)At the bottom, a 3D pattern can be seen, which indicates that the downtrend had ended.
Now, after a strong break of the trigger line, it seems that the price is aiming to form a bullish 3D pattern.
The green zone is the area from which the price may initiate the third drive.
The targets are marked on the chart.
A daily candle closing below the invalidation level will invalidate this analysis.
For risk management, please don't forget stop loss and capital management
When we reach the first target, save some profit and then change the stop to entry
Comment if you have any questions
Thank You
KASPER - THE GHOAST OF KASPA (TA + TRADE PLAN) BY BLAŽ FABJANTechnical Analysis for KASPER (KASPER/USDT) by Blaž Fabjan
Trend Analysis:
The chart indicates a rising wedge pattern on the horizon, a bearish reversal signal, which suggests a potential downward price movement after the completion of the pattern.
The price is currently in a consolidation phase, with a series of lower highs and higher lows within the wedge structure.
Support and Resistance Levels:
Resistance: The price has approached a resistance zone around the Wick High level, which indicates selling pressure in this area. A breakout above this resistance level could lead to a continuation of the upward trend.
Support: The Strong Low zone is acting as the lower support for the current price action, with buyers attempting to defend this level.
Indicators:
RSI (Relative Strength Index): Currently at 82.43, which is in the overbought territory, indicating that the asset may be overextended and susceptible to a pullback or correction.
MFI (Money Flow Index): The current MFI reading suggests an inflow of capital into the asset, indicating that the buying pressure is strong. However, if the price hits the overbought region, it could signal a reversal.
Stochastic: The stochastic oscillator is at 96.19, indicating that the price is in an overbought condition and might be due for a pullback or consolidation in the short term.
VMC Cipher B Divergences: The indicator is showing bullish divergence at the recent lows, suggesting that buying pressure could continue, but it needs to be validated by a breakout above resistance.
Volume:
The volume is gradually increasing, which is a positive sign for the continuation of the trend. However, volume spikes during a breakout are crucial to confirm the trend's strength.
Trading Plan for KASPER (KASPER/USDT)
Key Entry Levels:
Breakout Entry: If the price breaks above the resistance zone near 0.00001000, consider entering a long position. Set the take profit target at around 0.00001500 (strong bullish continuation level) for a potential 50% price increase.
Reversal Entry: If the price fails to break the resistance and starts falling towards the Strong Low support level near 0.00000500, consider entering a short position. A move below the Strong Low could signal a reversal of the current uptrend.
Stop-Loss and Risk Management:
Long Position Stop-Loss: Set a stop-loss just below the Strong Low (around 0.00000450) to protect from a sudden price drop. The stop should be tight as this asset is volatile.
Short Position Stop-Loss: If entering a short position, place the stop-loss above the resistance level at 0.00001050 to minimize losses in case of a breakout.
Target Levels:
Short-Term Target (Bullish): If the breakout occurs, consider targeting a price of 0.00001500 based on the rising wedge pattern's projected price target.
Short-Term Target (Bearish): If the asset fails to hold above the support zone and breaks lower, target the 0.00000350 level as the next potential support area.
Trading Psychology:
Patience: This is a volatile asset, and it's important to wait for clear confirmation of a breakout or breakdown before entering the trade.
Risk-Reward Ratio: Aim for a 1:3 risk-reward ratio, which ensures you are risking less compared to the potential reward on each trade.
Monitor Indicators: Regularly monitor the RSI, Stochastic, and MFI for overbought or oversold signals. Additionally, follow volume patterns closely to gauge market momentum.
Exit Strategy:
Exit the position once price targets are reached or if indicators show signs of an exhaustion or trend reversal (e.g., RSI turning downward from overbought levels, stochastic crossing down).
Given the current chart formation and technical indicators, KASPER could be poised for a breakout to the upside, but there is a high risk of a correction given the overbought conditions.
Caution is recommended: monitor price action closely and adjust your strategy accordingly to avoid entering too early in a rising wedge or an overbought market.

KASPY COULD BE THE NEXT BIG THING (TA+TRADE PLAN)Technical Analysis of KASPY (KASPY/USD) BY BLAŽ FABJAN
1. Price Action & Trend Structure:
Falling Wedge (Red Zone): The chart shows a classic falling wedge pattern, a bullish reversal formation. This indicates that the downtrend has slowed down, and a breakout could be imminent.
Descending Triangle (Top Right Zone): This descending triangle formation suggests consolidation near resistance. If KASPY breaks out above the horizontal line of the triangle, a move towards higher targets can be expected.
2. Key Support and Resistance Levels:
Bottom 1 (Green Box): A significant support zone that previously bounced the price upwards. This zone should hold if the price tests it again.
Bottom 2 (Green Box): Another crucial support level showing a potential buying area. This could act as a safety net in case the market dips.
Resistance Levels (Red and Blue Targets): The upper red zone represents significant resistance, where the price might face selling pressure. The chart shows targets aligned with these resistance zones.
3. Technical Indicators:
VMC Clipser (B Divergences): The indicator shows mixed signals with a divergence in the upward movement, suggesting potential reversal or continuation. The positive divergence is noted with green arrows indicating buying opportunities.
RSI (Relative Strength Index): RSI is at 50.97, indicating neutral market conditions. It is not overbought or oversold, which suggests that there is room for price action in either direction.
Money Flow Index (MFI): The MFI value is 54.13, which confirms that there is moderate buying interest. MFI values above 50 suggest positive money flow, supporting potential upside movement.
Stochastic Oscillator: The stochastic oscillator shows a level of 21.93, indicating an oversold condition. This could signal an upward bounce as the market may be ready to reverse.
4. Market Sentiment & Time to Bounce:
The chart annotation “Time to Bounce” suggests a potential upward price movement after consolidating within the rectangle and descending triangle formation. The market sentiment appears to favor a bullish breakout.
Trading Plan
Entry Points:
Primary Entry: If KASPY breaks above the upper boundary of the descending triangle, targeting the breakout point at around 0.0000020 (upper resistance zone), this could be the ideal entry point for a bullish trade.
Secondary Entry (Bounce Play): If the price approaches the support areas (Bottom 1 or Bottom 2), consider entering long positions as the price bounces upward off these zones. The oversold conditions in the stochastic oscillator provide confidence for a potential bounce.
Target Levels:
Target 1: Around the upper red zone resistance (0.0000020), which has already been marked as a target in the chart.
Target 2: The second resistance zone at 0.0000025, aligning with the overall market conditions.
Long-term Target: A breakout could send the price higher to 0.0000035 (or higher), depending on the strength of the breakout.
Stop Loss & Risk Management:
Stop Loss: Place stop loss orders below the support level (around 0.0000015) to minimize losses if the price fails to hold at support. A tighter stop loss could be placed just below the bottom of the falling wedge.
Risk-to-Reward Ratio: Aim for at least a 3:1 risk-to-reward ratio for this trade, ensuring that the potential profit justifies the risk taken.
The KASPY chart shows a favorable setup for a potential bullish move, with a falling wedge pattern and a descending triangle indicating a possible breakout. Key indicators support this outlook, with neutral RSI and a favorable stochastic reading. The trading plan includes strategic entry points, realistic target levels, and prudent risk management.

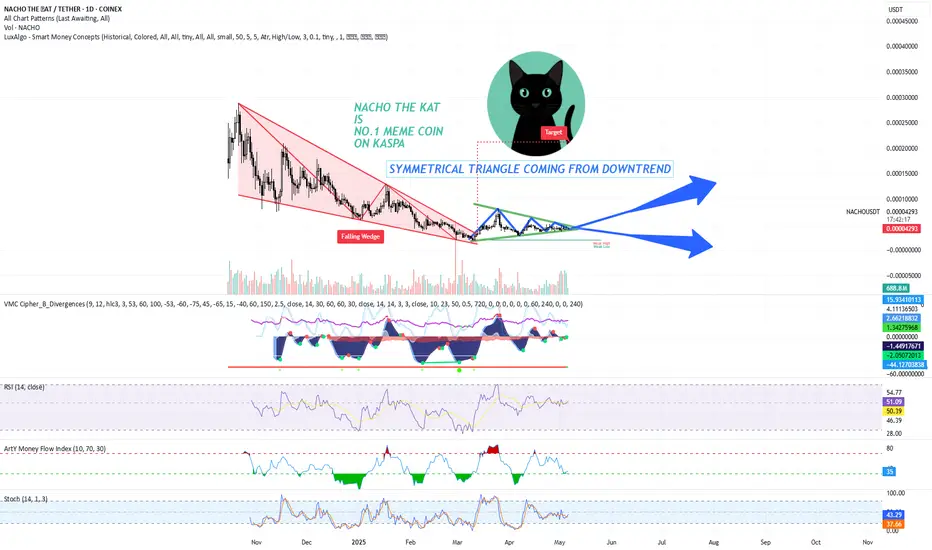
NO.1 MEME COIN ON KASPA IS NACHO THE KAT - DYORThe chart shows a symmetrical triangle pattern forming after a falling wedge. A falling wedge is typically seen as a bullish reversal pattern, indicating that the price may break out to the upside after the convergence of the trendlines. The symmetrical triangle, which is forming after the falling wedge, suggests consolidation before the breakout, likely pointing towards higher price action.
Key Points
Price Action and Trend:
NACHO has been in a downtrend, creating a falling wedge. The falling wedge has converging trendlines, which is a common setup for a bullish breakout.
Currently, the price is consolidating within a symmetrical triangle pattern, with lower highs and higher lows, indicating indecision in the market. The breakout from this triangle is likely to be significant, either continuing the previous downtrend or initiating a bullish reversal.
Volume Analysis:
The volume profile at the bottom shows an increase in volume as the price approaches the apex of the symmetrical triangle, suggesting potential strength behind the breakout.
It's important to monitor if volume increases further upon breakout to confirm the strength of the move.
Key Indicators:
RSI (Relative Strength Index): The RSI is currently around 50.39, suggesting a neutral market sentiment. The RSI has been ranging between oversold and overbought territories, which indicates that NACHO has not yet entered a strong trend but may be preparing for one.
Stochastic RSI: The Stochastic RSI is hovering around 37.57, showing a neutral stance, but it is closer to the oversold region, which could indicate that NACHO is near a potential reversal.
Money Flow Index (MFI): The MFI is at 35, indicating that the market is not yet in a strong buying or selling pressure zone. This shows that there is room for price movement based on volume.
VMC Cipher B Divergences: Positive divergence could suggest bullish momentum emerging, even if the price remains in consolidation.
Target and Resistance Levels:
If NACHO breaks out to the upside from the symmetrical triangle, the target is likely near the upper trendline of the wedge, which aligns with previous highs, possibly reaching the 0.00004500-0.00005000 USDT range.
Immediate resistance is near the 0.00004300 price level.
Support levels to watch are 0.00003000 and 0.00002000, which are key levels from previous price action.
Trading Plan
Entry Strategy:
Breakout Strategy: A strong breakout above the upper trendline of the symmetrical triangle would be a potential buy signal. If the price breaks and closes above 0.00004200, consider entering a long position with a target at 0.00004500-0.00005000.
Volume Confirmation: Ensure that the breakout is accompanied by an increase in volume. A low-volume breakout could be a false signal.
Stop-Loss Strategy:
Initial Stop-Loss: Place a stop-loss just below the symmetrical triangle's lower trendline or 0.00003000. This provides a reasonable distance to avoid being stopped out on small fluctuations.
Trailing Stop: As the price moves up towards your target, consider adjusting your stop-loss to lock in profits, especially if the price exceeds the 0.00004300 resistance level.
Take-Profit Strategy:
First Profit Target: Set a take-profit order around 0.00004500, the first resistance level. This is a key point based on the historical price action and previous swing highs.
Secondary Target: If the price breaks past 0.00004500, adjust the target to 0.00005000, which is the next logical resistance zone.
Risk Management:
Position Sizing: Risk no more than 1-2% of your total capital on this trade. For example, if your trading account is $5,000, you should risk no more than $100-$150 per trade.
Risk-Reward Ratio: Aim for a minimum 2:1 risk-to-reward ratio. For example, if you risk $150 on a trade, aim for a potential reward of $300 or more.
Additional Considerations:
Market Sentiment: As NACHO is a meme coin, market sentiment plays a huge role. Watch for social media trends and any news related to meme coins or Kaspa-based coins that could drive the price action.
Macro Conditions: Stay updated on the general market conditions for cryptocurrencies, as a broader downtrend in the market could limit the upside potential, even if technicals suggest a breakout.
NACHO THE KAT presents a technical setup with the potential for an upward move following a breakout from the symmetrical triangle. A close watch on volume and key price levels will be critical for confirming the breakout and determining the right moment for entry.
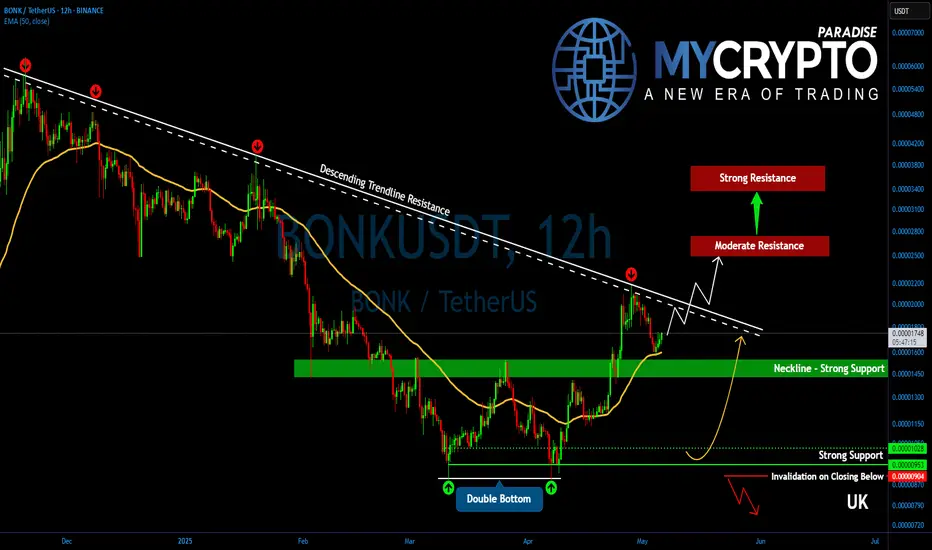
BONKUSDT Up for a Major Breakout! Key Levels to Watch!Yello, Paradisers! Is #BONK about to explode higher after weeks of consolidation? A powerful shift is underway—and the bulls might just be waking up at the perfect time.
💎#BONKUSDT is beginning to show a notable short-term trend reversal, with a double bottom pattern now confirmed. This structure signals a potential end to the recent bearish control, and price action is now pressing against the descending trendline resistance. A successful breakout here could completely flip market dynamics in favor of the bulls.
💎Following a minor round of profit-taking at the descending resistance, BONK pulled back toward the previous breakout support. That retracement brought the price right back into the key supportive range between 0.00001550 and 0.00001425, where it's now starting to bounce again. Notably, the EMA-50 has aligned perfectly with this support zone, adding strength to the reaction from this area.
💎BONKUSDT's next challenge lies at 0.00002000 to 0.00002100—a major descending resistance level that has capped upside since December 2024. Breaking above this structure would be a critical bullish breakout, potentially unleashing the next wave of upside momentum.
💎If bulls push through this barrier, BONK is expected to move toward the next moderate resistance at 0.00002500 to 0.00002750. This area aligns with the measured target of the double bottom formation. However, if bullish strength continues to build, BONK may even extend toward the strong resistance between 0.00003400 and 0.00003700, where the 50% Fibonacci retracement also resides—a historically significant level for potential trend reversals.
💎Adding to the bullish case, the 12-hour EMA-50 and EMA-200 are now converging toward a possible Golden Cross. If this cross confirms, it could serve as a major technical catalyst for a broader trend reversal and further upside continuation.
Paradisers, strive for consistency, not quick profits. Treat the market as a businessman, not as a gambler.
MyCryptoParadise
iFeel the success🌴
DOGECOIN BUY LIMIT...Hello friends✌
Given the good price growth and the arrival of buyers, now that the price is correcting, it is the best time to buy.
🙏If you like it, support it with a ✔like✔ and ✔comment✔.
*Trade safely with us*

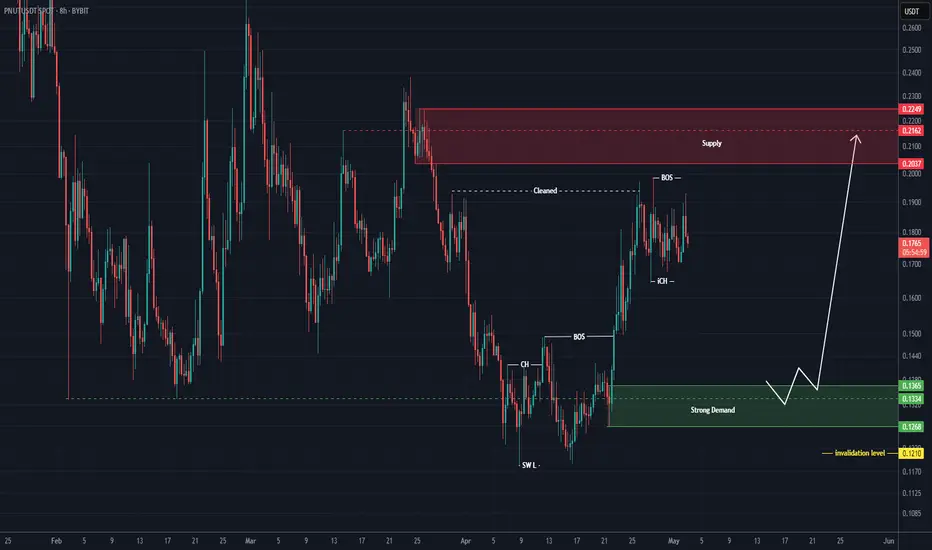
Strong rebuy setup for PNUT (8H)Note: This is not a sell/short setup | it is a buy/long setup.
After clearing resistance order blocks and a strong bullish move, buyers seem to have exhausted their momentum and may need a retracement for price to return to their base.
We are looking for a rebuy within the green zone. The price is likely to move from this area toward the red box.
A daily candle closing below the invalidation level will invalidate this analysis.
For risk management, please don't forget stop loss and capital management
Comment if you have any questions
Thank You
HIGHUSDT Analysis D1HIGHUSDT Already Broken Descending Broadening and started Recovery in D1 Chart
Continuity of momentum can see 80-120% Bullish Rally in Short-term .

PNUTUSDT Analysis D1PNUTUSDT Building Up For Solid Breakout, Test Descending Trendline & On Verge Of Solid Breakout, usually This Type Consolidation Under Resistance Lead Massive Breakout, Expecting 2x After Breakout.

CHILLGUY Looks Super Bullish (1D)Note: This is a highly volatile meme coin. Risk management and capital management should not be forgotten.
It appears that a large-scale corrective wave has ended, and the price has entered a bullish wave of the same degree.
Recently, we observed a bullish CH (Change of Character) and a clean break above a resistance zone on the chart. Currently, the price is approaching a supply zone, and a significant amount of sell orders have entered CHILLGUY. A short-term correction is expected, after which the bullish move is likely to continue.
If the price reaches our marked entry points, we will enter a buy position in spot.
Targets are indicated on the chart.
The closure of a daily candle below the invalidation level will negate this outlook.
For risk management, please don't forget stop loss and capital management
When we reach the first target, save some profit and then change the stop to entry
Comment if you have any questions
Thank You

DOGE/USDT – 3D Long Signal Active📅 April 29, 2025
The system triggered a long entry at the last 3D bar close.
Currently, the price remains around the same levels.
✅ System conditions for a long are fully met:
MLR > SMA > BB Center > PSAR
Price is trading above the 200 MA on the 3D timeframe.
⚠️ Caution:
On the 1D timeframe, price is still below the 200 MA, which suggests some lingering weakness. Proceed carefully.
📍 Strategy Plan:
Consider entering long at today’s daily close or at the next 3D bar close.
Suggested stop-loss: below the latest PSAR dot for system integrity.
🔔 Keep an eye on updates and thank you for reading! 📈📊

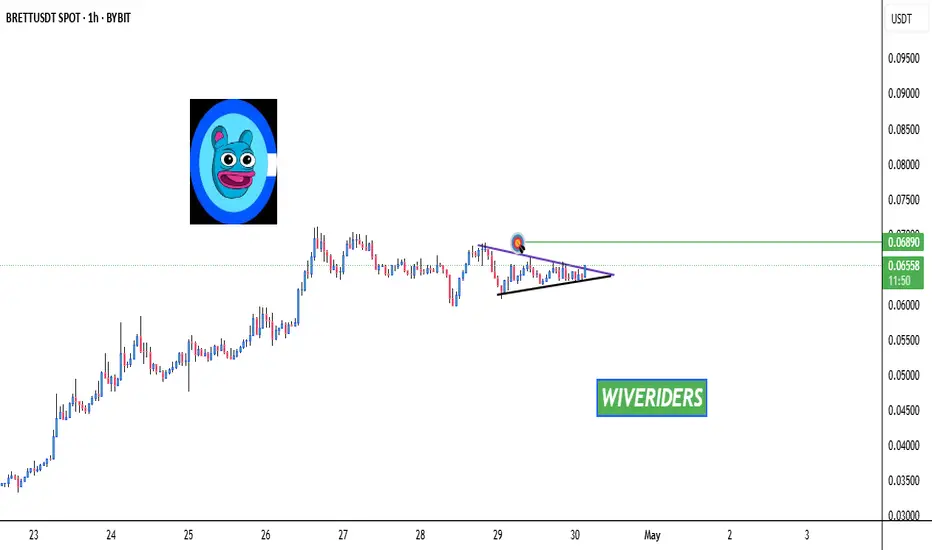
BRETT Forming Bullish Pattern🚨 $BRETT
Forming Bullish Pattern 🚨
$BRETT
is forming a bullish pattern. If the price breaks out above the current resistance level, the first target will be the green line level.
📈 Technical Overview:
Pattern: Bullish
Resistance Zone: Current level being tested.
🎯 Breakout Target: Green line level
HolderStat | Tracking a smart trader🎭 Crowd gets emotional while geniuses buy altcoins ahead of the next rise.
💡 Latest trader purchases:
SHIRO - 2 days ago
KEKIUS - 1 month ago
NPC - 2 months ago

HolderStat | What second top ETH holder do?He HOLD his position 7.02 ETH ~ 12 790 USD.
He know how to hold ETH/USDT for profit 😎
🧠This dude makes money by buying near a bottom and waiting for signs of a decline.
Statistic:
📥Invested($): 649
📈Profit ($): 41 820
💹Profit (%): 6448

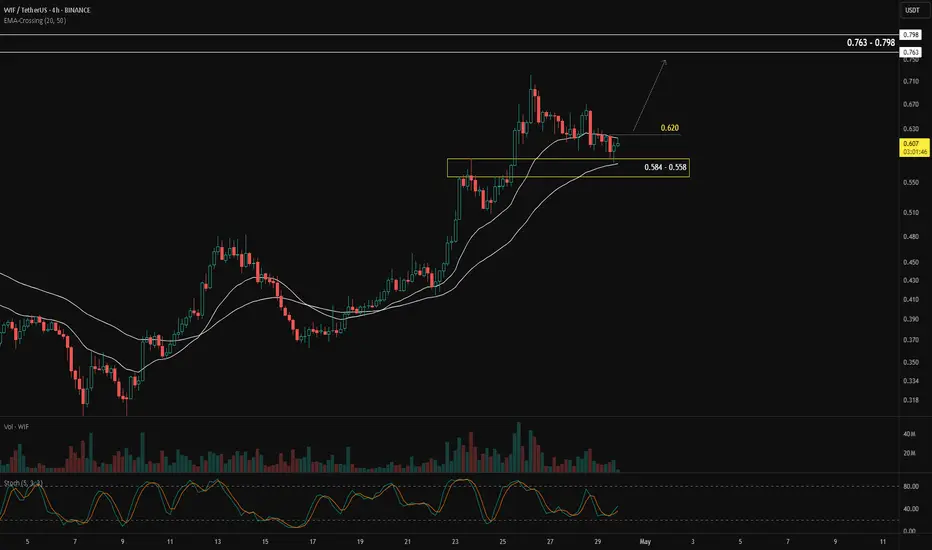
When Moving Averages Meet the Demand ZoneOne of the simplest ways to identify the market trend is by using the moving average (MA) indicator.
When price moves above the MA, it's generally considered an uptrend.
When price moves below the MA, it's seen as a downtrend.
Aside from showing the trend, moving averages can also act as dynamic support and resistance:
In an uptrend, the MA acts as support — meaning if price retraces into the MA, it often bounces back and continues upward.
In a downtrend, the MA acts as resistance — price tends to reject the MA and move lower.
In BINANCE:WIFUSDT , the moving average is currently acting as support, and price is pulling back into a confluence zone between 0.584 – 0.558, where the MA meets a demand zone. This setup increases the probability of the pullback ending and the uptrend continuing.
The confirmation for a bullish continuation would be a break and close above 0.620.
If that happens, the next target zone is between 0.763 – 0.789.
Keep a close eye when price approaches the previous high. The ideal scenario is a strong impulsive breakout. The worst-case scenario would be a rejection or false breakout from that level.
Alright, what's your take on BINANCE:WIFUSDT ?
$MOTHER Gearing for 450% Surge Amid Breaking This Fib LevelsThe price of SET:MOTHER a memecoin with no intrinsic value built on the Solana ecosystem is set to go parabolic with an anticipated 450% surge if it should breakout from this key Fibonacci levels.
For the past 24 hours, the SET:MOTHER coin on Solana has surged 25% already gearing to break the 78.6% Fibonacci retracement point, with each level bridged, the SET:MOTHER token is poised to gain momentum milestone per milestone overcome with the 65% Fib waiting as the preceding level to be broken to pull the 450% breakout.
The SET:MOTHER token has already being listed on key CEX like Gateio, BingX, HTX, Bitget, and CoinEx, etc. and with a growing community of 26.5k on Twitter, the SET:MOTHER coin might just pull out the 450% surge breakout
Mother Iggy Price Data
The Mother Iggy price today is $0.020537 USD with a 24-hour trading volume of $2,966,793 USD. Mother Iggy is up 25.75% in the last 24 hours, with a market cap of $20,252,618 USD. It has a circulating supply of 986,143,154 MOTHER coins and the max. supply is not available.

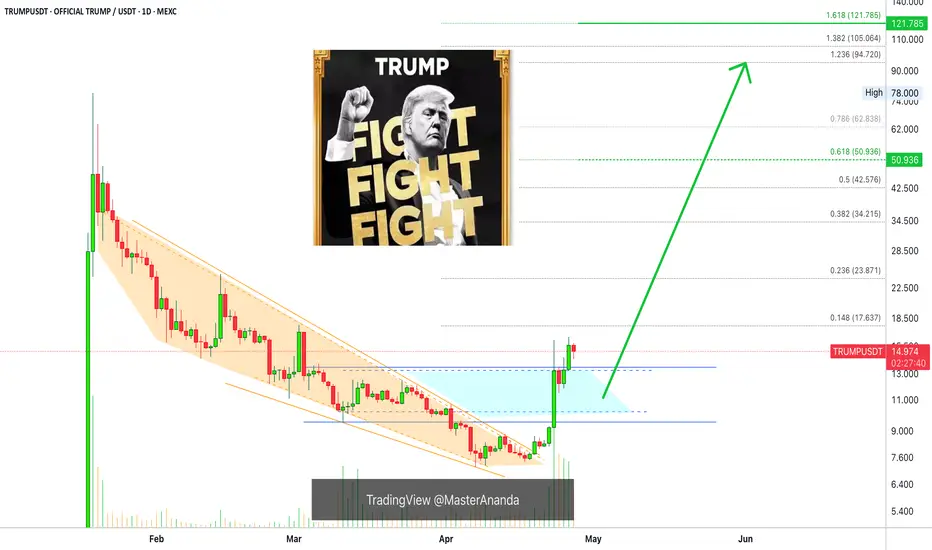
OFFICIAL TRUMP Update —Your Guide Through Light & DarkIt gets better and better. Yesterday TRUMPUSDT produced the highest session close since 3-March. Think about it... The bottom is fully in and confirmed and now almost two months of bearish action have been completed obliterated. The action is happening now the same as if it were early February 2025.
Another interesting fact is that almost two months of bearish action has been deleted but the chart is only a little over 3 months old. The bears are no more we are in the bullish zone.
This is important and a strong confirmation.
TRUMPUSDT started trading when the market was bearish and moving within a strong corrective phase. The correction for the last major 2024 bullish wave.
Corrections are tough I agree and the market bleeds but they end and once they end the action turns the other way and that's what you are seeing today.
There is no doubt here, nothing to fear, the rise won't stop it is only getting started. Make no mistakes.
How far up TRUMPUSDT will grow is only speculation but you can expect a new All-Time High for sure. And that's easy for a Cryptocurrency project and one with so much buyers, holders, attention and market support.
This is a simple update mentioning the highest close in months, the bottom is in and bullish continuation confirmed. Keep holding and you win. Keep buying, double-win. Only sell when the market reaches new All-Time High and is full green.
Right now is the time to buy and hold, when prices are low. Only when prices are high we take the profits and move on.
Trading is meant to make money. To make money, you have to let go of your position once the market grows.
Prepare now. Plan ahead of time.
You will do great. You have my support.
Thanks a lot for your continued support.
I will be your guidance through the light and through the dark.
Namaste.
Testing Red Resistance Zone🚨 CSECY:PENGU Testing Red Resistance Zone 🚨
CSECY:PENGU is currently testing a significant red resistance zone. A breakout above this level could signal a bullish move, with the first target at the green line level.
📈 Technical Overview:
Resistance Zone: Red area currently being tested.
🎯 Breakout Target: Green line level upon confirmation.

PEPECOINHello friends
Considering the price growth we had, you can see that the upward channel has been broken by the price correction and now you can enter the price correction.
The purchase and target points have also been determined...
Follow capital management.
*Trade safely with us*
