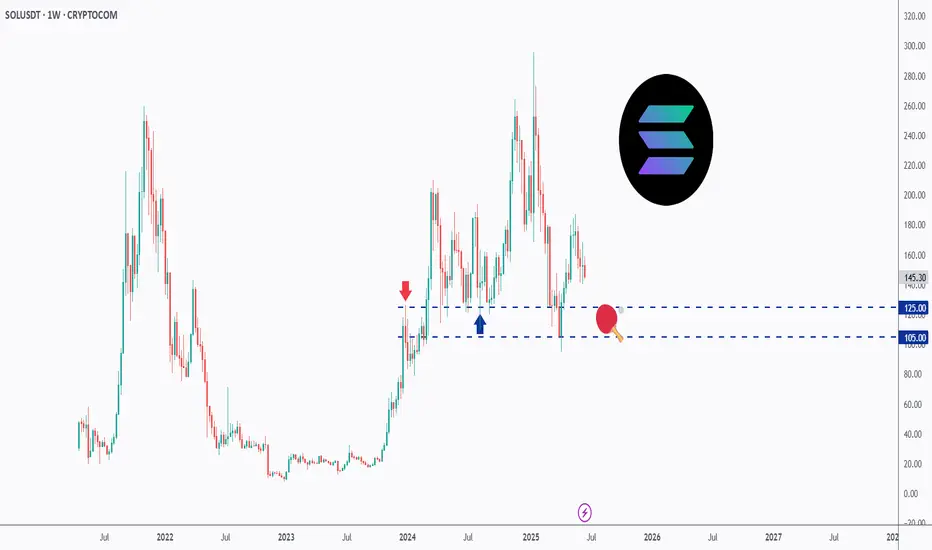
SOL - Playing Ping Pong!Hello TradingView Family / Fellow Traders. This is Richard, also known as theSignalyst.
📈SOL has been trading within a range between $100 and $200 round number.
And it is currently retesting the lower bound of the range which has been acting as a magnet lately.
As SOL approaches the $105 - $125 support zone, and as long as the $105 support holds, we will be looking for longs targeting the $200 round number.
📚 Always follow your trading plan regarding entry, risk management, and trade management.
Good luck!
All Strategies Are Good; If Managed Properly!
~Rich
Memecoins
SPX6900: From base building to history making.Price is fractal, right? RIGHT?!
Before the recent run, SPX6900 printed almost the same setup.
See it yourself....
Now it’s playing that over-under dance near ATH (#2). Classic. Build the base, shake the tourists.
Then comes the move... THE move.
First stop: $10.
After that, a quick push into the $50-70 zone.
Once the weak hands get flushed, $100 becomes the next base.
Long term? Way higher.
If the community keeps growing.
If people stay tired of the same rigged game.
This could and probably will make history....
Like Murad says: stop trading. Believe in something.
We’re still SO early.
This is just a "Classical charting style fractal analysis..." but the reality is that... there is no Chart. ...

FLOKI Correction Complete & Ready to Rally!📊 CRYPTO:FLOKIUSD found strong buying interest in the blue box area at $0.000083 - $0.000074, setting the stage for a trend continuation to the upside.
🚀 Will momentum push it toward new highs?

SPX6900 - Time to Get Aggressive and Flip SPX🔥 CRYPTO:SPX6USD With a new ATH on the horizon, wave (3) is eyeing $2.4 - $3.1 as the next target. But this is just the start, momentum is building and summer volatility could push prices even higher!

FARTCOIN is primed for a 3X move!🚀 CRYPTO:FARTCOINUSD April rally cooled off, buyers stepped in at the $1 - $0.75 extreme zone, and now wave (3) is gearing up for liftoff.
🎯Targeting $2.3 - $3.2—momentum is building fast!
Are you strapped in for the ride, or still watching from the sidelines?

Doge Meme Coin daily demand level is playing out wellThe strong daily demand imbalance mentioned in a previous update is still in control and trying to play out as expected. Any long positions on this meme coin should be managed.

MEMEUSDT 1D AnalysisMEME ~ 1D Analysis
#MEME Buy back gradually from here if you still have confidence in this coin with a short term target of at least 15%+ from here.

Is Fartcoin Meme Coin About to Crash Hard?In the ever-evolving world of crypto investment, memecoins continue to attract waves of speculative interest, even as their real-world use remains effectively nonexistent. One such meme coin token that’s recently caught the attention of traders and meme enthusiasts alike is Fartcoin—a cryptocurrency as ridiculous as its name implies. While Fartcoin may not be suitable for serious applications, it presents a fascinating case study in how to trade memecoins based purely on supply and demand imbalances.
The Origins of Fartcoin
Fartcoin emerged, predictably, as a joke. Like most memecoins, it was born not out of innovation but out of internet culture. Designed with no technical edge, no roadmap, and no ecosystem, its primary function is virality—riding the waves of social media hype and influencer shills. Fartcoin’s creators never intended it to disrupt finance or decentralize the web; they just wanted to make people laugh (and perhaps get rich in the process).
Yet, despite the lack of fundamentals, Fartcoin gained traction, thanks to Twitter and X memes, Reddit threads, and YouTube influencers who thrive on ironic tokens with humorous names. This is the bizarre paradox of memecoins and crypto investment: irrational exuberance often beats utility.
Why Fartcoin (Like All Memecoins) Can’t Be Used in Real Life
Let’s be clear—memecoins like Fartcoin offer no practical use. Unlike Bitcoin (store of value) or Ethereum (smart contract infrastructure), Fartcoin can’t pay for goods or services, nor does it solve any technological or economic problem. It exists solely for speculation.
Most real-world businesses won’t touch it. It lacks a stable price mechanism, a credible development team, and a long-term value proposition. In other words, Fartcoin is entirely unfit for real-life utility, making it a textbook example of a speculative asset detached from fundamentals.
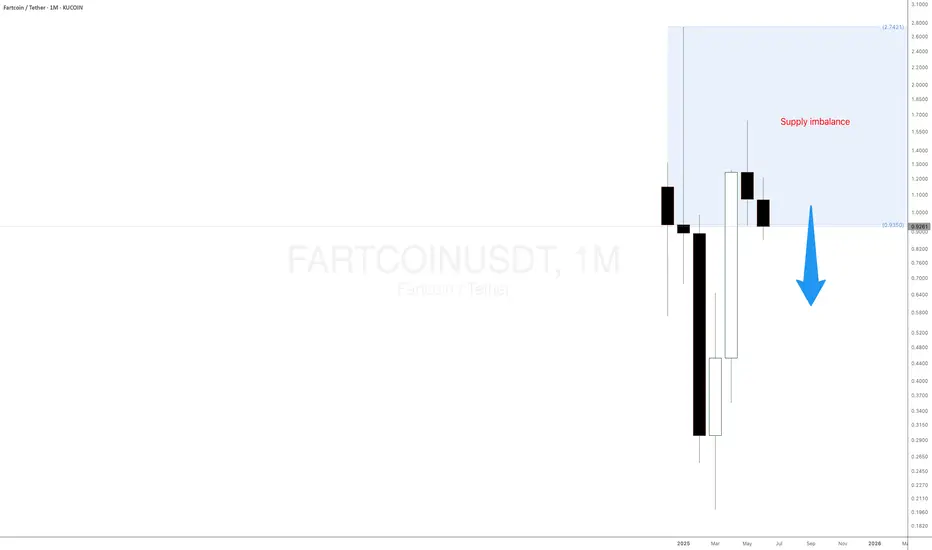
Technical Analysis: Supply Level Suggests a Dump Is Imminent
While Fartcoin may lack intrinsic value, it offers opportunities for active traders who understand market psychology and how to trade cryptos. Currently, the price action reveals a notable supply imbalance around the $0.8982 level—a monthly supply zone that has acted as a key area of institutional selling pressure.
This level is currently “in control,” meaning buyers have consistently failed to push through this resistance. Price is now hovering close to this supply level, suggesting a high probability of rejection. For traders familiar with trading memecoins, this presents a prime opportunity to take short positions using futures contracts available on select cryptocurrency exchanges, such as Kucoin, Binance, and ByBit.
PEPE at Key Reversal Zone — Support Test Coming Soon?Today I want to look at the PEPE token ( BINANCE:PEPEUSDT ), which is part of the memecoin category, and provide you with a short-term analysis on the 1-hour timeframe .
PEPE token is trading in Potential Reversal Zone(PRZ) .
In terms of Elliott wave theory , the PEPE token appears to be completing the microwave 5 of the main wave C . The structure is a Zigzag Correction(ABC/5-3-5) .
Also, we can see the Regular Divergence(RD-) between Consecutive Peaks .
I expect the PEPE token to attack the Support zone($0.0000120-$0.0000108) after completing the main wave C .
Note: Stop Loss = $0.0000362
Please respect each other's ideas and express them politely if you agree or disagree.
Pepe Analyze (PEPEUSDT), 1-hour time frame.
Be sure to follow the updated ideas.
Do not forget to put a Stop loss for your positions (For every position you want to open).
Please follow your strategy and updates; this is just my Idea, and I will gladly see your ideas in this post.
Please do not forget the ✅' like '✅ button 🙏😊 & Share it with your friends; thanks, and Trade safe.

Beginners Guide To Winning Memecoin Trades! Moo DengMeme coins have taken the cryptocurrency world by storm, often starting as jokes but evolving into high-volatility assets that attract crypto traders seeking quick gains. From Dogecoin to Shiba Inu and now Moo Deng, these so-called useless meme coins can offer trading opportunities—if you know where to look.
In this updated crypto analysis, I will build on our previous analysis where I identified a strong monthly supply zone for Moo Deng meme coin at $0.26. If you're wondering how to trade meme coins like Moo Deng, even with little experience, this supply and demand analysis breaks it down using simple supply and demand concepts on larger timeframes.
The sell-off is trying to happen.

PNUT projects to a Dollar.TWO Clear patterns
Double bottom
and a Bull Flag.
Two respective Log Projections for you to consider.
This suggest strong Solana performance is incoming and another round of #Memecoin frenzy.

DOGE can be worth many DOLLAR'SGrok, the AI supercomputer interface on Elon Musk’s X platform, predicts that Dogecoin might hit $10 between 2029 and 2040.
While I remain hopeful, I believe that a more realistic target could be around 3-5 dollars by the end of this decade. This could potentially trigger a significant blowoff top, leading to an extended bear market for cryptocurrencies.
When you examine this chart, it’s hard not to appreciate its beauty, comparable to Bitcoin, as it showcases a well-defined uptrend and follows cyclical rises and falls. This has resulted in Dogecoin creating numerous millionaires. The pressing question is whether those investors who currently hold 250,000 coins will become the next wave of millionaires in just a few years?

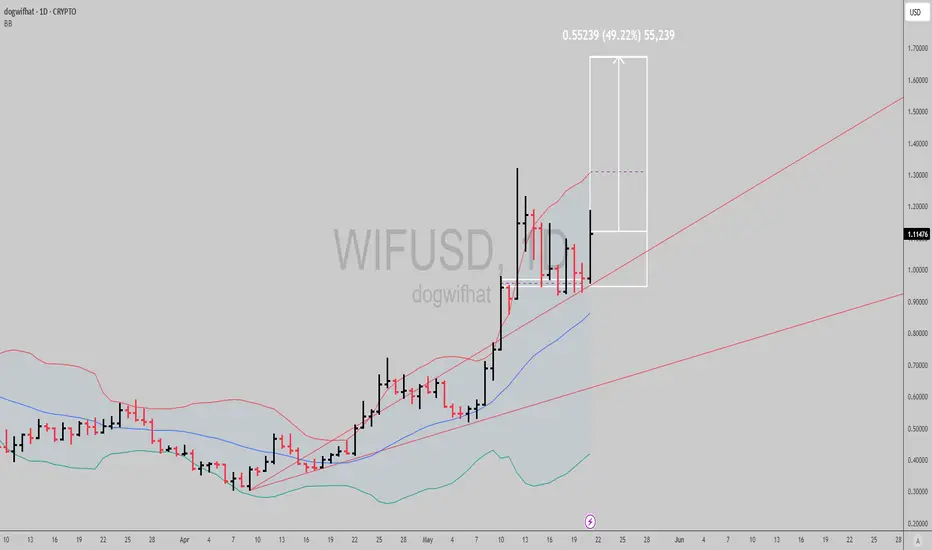
$WIF: Uptrend signal activeNice signal in SEED_WANDERIN_JIMZIP900:WIF here, the trend in the daily timeframe has been bullish since April 18th, and has been giving us multiple continuation signals to trade in and out, or scale in with low risk as we move the stop higher if playing it longer term.
If prices hold above recent lows, we can see a close to 50% run from here within a week give or take.
Best of luck!
Cheers,
Ivan Labrie.
Shiba Inu Crypto: A Useless Coin That Can Still Make You RichHey everyone, welcome back to a new supply and demand crypto analysis. Today, I will analyse one of the most unexpected — but potentially lucrative — investment opportunities in the crypto space right now: Shiba Inu Metaverse crypto.
Yeah, I know what you’re thinking… “Isn’t Shiba Inu just another meme coin?”
And yes, fundamentally, it’s not trying to solve world hunger or revolutionise finance. But guess what? You don’t need a coin to be helpful to make money from it.
All you need is to understand price action and supply and demand. That’s it.
What is Shiba Inu?
So let’s break it down. Shiba Inu started as a meme — a direct competitor to Dogecoin. It’s an ERC-20 token on the Ethereum network with a massive circulating supply and a huge following. Over time, it has evolved and launched its own ecosystem — including Shibarium, SHIB: The Metaverse, and other utilities.
But let’s be real: Shiba Inu is not about real-world utility. It’s about speculation, community hype, and timing the market right based on simple but powerful trading concepts.
Daily Timeframe is Trending UP
Right now, things are shifting in our favour on the daily timeframe. We’ve just entered an uptrend — a key change in market structure — and more importantly, we’ve got a new imbalance forming around $0.00001320. This is the next key level where we’re waiting to re-enter the market.
Why wait? Because smart investors don’t chase candles. They wait for the price to return, where demand will likely kick in again. That level is $0.00001320. Once price returns there and confirms demand, we buy — and we ride the next wave.

MEMEUSDT 1D AnalysisMEME ~ 1D Analysis
#MEME Buy on retest of this support block with short term target of at least 15%+ from here.

Could PEPE reach a staggering 3000X and hit a market cap of 69B...this year?
YES 69 BILLION Dollars for a Frog coin!
To assess the potential growth of a cryptocurrency, we first need to identify its all-time low price.
Coinpedia reports that PEPE's all-time low was $0.00000005514 on ETH via Uniswap on April 18, 2023, marking the lowest price recorded on a decentralized exchange.
For PEPE to achieve a 3000X increase, it would need to rise to $0.00016542 by December 31st.
Given its current price of $0.000014238, this represents an 11.5X increase from its present value.
With a total supply of 420.69 trillion tokens, reaching the target price would result in a market cap of $69.58 billion.
While this may seem ambitious for a memecoin lacking utility, the idea of hitting such a whimsical market cap is tempting.
I estimate the likelihood of this happening at around 2.5%.
(This scenario also suggests a reasonable portfolio allocation for those primarily holding #BTC and #ETH and I highly suggest rebalancing above 5%)

Nacho the Kat Bullish Falling Wedge Pattern Signals PotentialChart Overview
The chart shows a falling wedge pattern forming on a 4-hour timeframe for "Nacho the Kat" (NACHO/USD). This is a bullish pattern often indicating a potential price breakout to the upside, particularly after a period of consolidation within the wedge.
Price Action Analysis
Current Price: The price is approaching a potential breakout point, with the trend following the pattern outlined in the chart.
Falling Wedge:
The pattern suggests the price has been consolidating within lower highs and higher lows, creating a narrowing range. Historically, the breakout from a falling wedge tends to be upward, especially when volume and momentum indicators align with the trend.
Volume and Momentum Indicators
VMC (Volume Momentum Cipher): Shows divergence (highlighted by green and red dots). The momentum is slowing but still supports the possibility of an upward move once the price breaks above the resistance level.
RSI (Relative Strength Index): RSI is at 55.03, indicating neutral market conditions. There is room for upward momentum before reaching overbought conditions, which further supports the possibility of an upside breakout.
ArtY Money Flow Index: It is currently above 40, showing positive money flow, indicating that buying pressure is still relatively strong.
Stochastic Oscillator: The Stochastic is at 47.29, which is within a neutral range. However, it could suggest potential upward movement, especially if the oscillator crosses above 50.
Support and Resistance Levels
Support: The support level is represented by the strong low section of the falling wedge. A breakdown below this level could invalidate the pattern.
Resistance: The resistance lies at the upper edge of the falling wedge. Once the price breaks this level, it could indicate the start of a bullish move.
Trading Plan
Entry Point:
Wait for a confirmed breakout above the upper resistance of the wedge. A break above this level will provide a clearer confirmation of upward movement.
Consider entering the position at or above 0.0000057 USD.
Stop-Loss:
Place the stop-loss below the lower trendline of the wedge to limit potential losses in case the breakout fails. A reasonable stop-loss could be around 0.0000045 USD.
Take-Profit Targets:
Short-Term Target: After a breakout, aim for a conservative target around the next resistance at 0.0000065 USD.
Long-Term Target: If momentum continues to build, the next potential resistance levels may be around 0.0000075 USD.
Risk Management:
As with any trade, ensure to use proper risk management by not risking more than 1-2% of your total capital per trade.
Keep an eye on the volume and momentum indicators. If they show signs of weakening before the breakout, consider reducing position size or waiting for more confirmation.
Final Thoughts
The falling wedge pattern suggests that "Nacho the Kat" cryptocurrency may be preparing for a bullish breakout, but it's essential to monitor price action carefully. A strong breakout with increasing volume will likely signal further gains, while a failure to break the wedge resistance could lead to further consolidation or downside risks.


BEAMX Looks Bullish (8H)Two higher lows have been formed at the bottom of the chart, and the price has already created a bullish CH.
A trigger line has been formed, and it is expected to break after a few touches.
With the trading range maintained, the price is expected to move towards the targets, which are marked on the chart.
Closing a daily candle below the invalidation level will invalidate this analysis.
For risk management, please don't forget stop loss and capital management
When we reach the first target, save some profit and then change the stop to entry
Comment if you have any questions
Thank You

Memecoin: A Modest $60 Trade in Mumu on SolanaMemecoin: A Modest $60 Trade in Mumu on Solana
➖ Bitcoin is growing slowly for now, and today I noticed that altcoins and memecoins have become more active.
➖ I decided to try investing a modest $60 in the memecoin Mumu, which has the potential for a +120% move.
➖ I'm not expecting massive gains; the lows have closed higher, similar to October 2024, with a move toward 161.8% on the Fibonacci retracement. I opened a trade on Solana.

OFFICIAL TRUMP Exact Levels Predicted, Next Target (Explained)The higher low is in and this will lead to a higher high.
As TRUMPUSDT moves up, there will be no resistance until the action reaches $25.35. This is the exact number for the next stop.
After a target is reached, there is always a retrace. Just as it happened after 26-April. The retrace ends in a higher low and the higher low ends by producing a continuation of the bullish move and trend.
After $25.35 and a small retrace, TRUMPUSDT will continue growing to reach $34.61. The market never moves straight up nor straight down, it fluctuates, patience is key.
There is no need to buy and sell at each target, the best and easiest way to earn big money is to buy at support and hold long-term. When prices are high enough, one can easily sell and collect profits.
On a bigger and broader perspective, the three targets on the chart will be taken out as part of the 3rd wave of the current bullish impulse. This will lead to a retrace, wave 4, and this will then lead to additional growth and higher prices, wave 5.
Wave 5 will lead to a strong correction and this strong correction to a higher low based on the broader structure. This higher low will resume to produce an advance that will end up in a bull run phase and a new All-Time High.
After the All-Time High comes the long-term correction also known as bear market. The next bear market won't be as bad as the previous one. Compared to the 2022 bear market and the transition period, it will be fast and small. We are set for an entire decade of mostly growth. Still, allow for the usual fluctuations and variations. If you hold focusing on the long-term, you can't go wrong. Right now, you should be buying like it is the end of the world. The world won't end, but low prices won't be available for too long.
When strong bullish action starts we wonder, "Why didn't I buy when prices were low?"
Just recently, between 7 and 22 April, TRUMPUSDT was trading very, very low. While the initial bullish breakout is in, it is still early.
Thanks a lot for your continued support.
Namaste.

MOG Coin Testing Key Resistance – Breakout Ahead?🚀 TSXV:MOG Coin Testing Key Resistance – Breakout Ahead? 📈
TSXV:MOG Coin is currently testing the black resistance line. If the price breaks through, the first target could be the green line level. A clean breakout here could signal strong upward momentum. 📊
Let’s capitalize on this potential move! 💼💸

KASPER - THE GHOAST OF KASPA (TA + TRADE PLAN) BY BLAŽ FABJANTechnical Analysis for KASPER (KASPER/USDT) by Blaž Fabjan
Trend Analysis:
The chart indicates a rising wedge pattern on the horizon, a bearish reversal signal, which suggests a potential downward price movement after the completion of the pattern.
The price is currently in a consolidation phase, with a series of lower highs and higher lows within the wedge structure.
Support and Resistance Levels:
Resistance: The price has approached a resistance zone around the Wick High level, which indicates selling pressure in this area. A breakout above this resistance level could lead to a continuation of the upward trend.
Support: The Strong Low zone is acting as the lower support for the current price action, with buyers attempting to defend this level.
Indicators:
RSI (Relative Strength Index): Currently at 82.43, which is in the overbought territory, indicating that the asset may be overextended and susceptible to a pullback or correction.
MFI (Money Flow Index): The current MFI reading suggests an inflow of capital into the asset, indicating that the buying pressure is strong. However, if the price hits the overbought region, it could signal a reversal.
Stochastic: The stochastic oscillator is at 96.19, indicating that the price is in an overbought condition and might be due for a pullback or consolidation in the short term.
VMC Cipher B Divergences: The indicator is showing bullish divergence at the recent lows, suggesting that buying pressure could continue, but it needs to be validated by a breakout above resistance.
Volume:
The volume is gradually increasing, which is a positive sign for the continuation of the trend. However, volume spikes during a breakout are crucial to confirm the trend's strength.
Trading Plan for KASPER (KASPER/USDT)
Key Entry Levels:
Breakout Entry: If the price breaks above the resistance zone near 0.00001000, consider entering a long position. Set the take profit target at around 0.00001500 (strong bullish continuation level) for a potential 50% price increase.
Reversal Entry: If the price fails to break the resistance and starts falling towards the Strong Low support level near 0.00000500, consider entering a short position. A move below the Strong Low could signal a reversal of the current uptrend.
Stop-Loss and Risk Management:
Long Position Stop-Loss: Set a stop-loss just below the Strong Low (around 0.00000450) to protect from a sudden price drop. The stop should be tight as this asset is volatile.
Short Position Stop-Loss: If entering a short position, place the stop-loss above the resistance level at 0.00001050 to minimize losses in case of a breakout.
Target Levels:
Short-Term Target (Bullish): If the breakout occurs, consider targeting a price of 0.00001500 based on the rising wedge pattern's projected price target.
Short-Term Target (Bearish): If the asset fails to hold above the support zone and breaks lower, target the 0.00000350 level as the next potential support area.
Trading Psychology:
Patience: This is a volatile asset, and it's important to wait for clear confirmation of a breakout or breakdown before entering the trade.
Risk-Reward Ratio: Aim for a 1:3 risk-reward ratio, which ensures you are risking less compared to the potential reward on each trade.
Monitor Indicators: Regularly monitor the RSI, Stochastic, and MFI for overbought or oversold signals. Additionally, follow volume patterns closely to gauge market momentum.
Exit Strategy:
Exit the position once price targets are reached or if indicators show signs of an exhaustion or trend reversal (e.g., RSI turning downward from overbought levels, stochastic crossing down).
Given the current chart formation and technical indicators, KASPER could be poised for a breakout to the upside, but there is a high risk of a correction given the overbought conditions.
Caution is recommended: monitor price action closely and adjust your strategy accordingly to avoid entering too early in a rising wedge or an overbought market.
