MEME price analysis⁉️ Maybe #MEME is trying to start the memecoin 2.0 season?)
Before the strong resistance from above, the growth potential is 400%, but even this will not be much consolation for those who bought OKX:MEMEUSDT a year ago.
But again, in accordance with the assumption that was written a few posts earlier: coins with market caps in the range of $50-100 million are starting to “pumping”.
💰 In general, if the CRYPTOCAP:BTC price in April is kept above $79-80k (9 days left), then May may turn out to be quite generous.
_____________________
Did you like our analysis? Leave a comment, like, and follow to get more
Memecoins

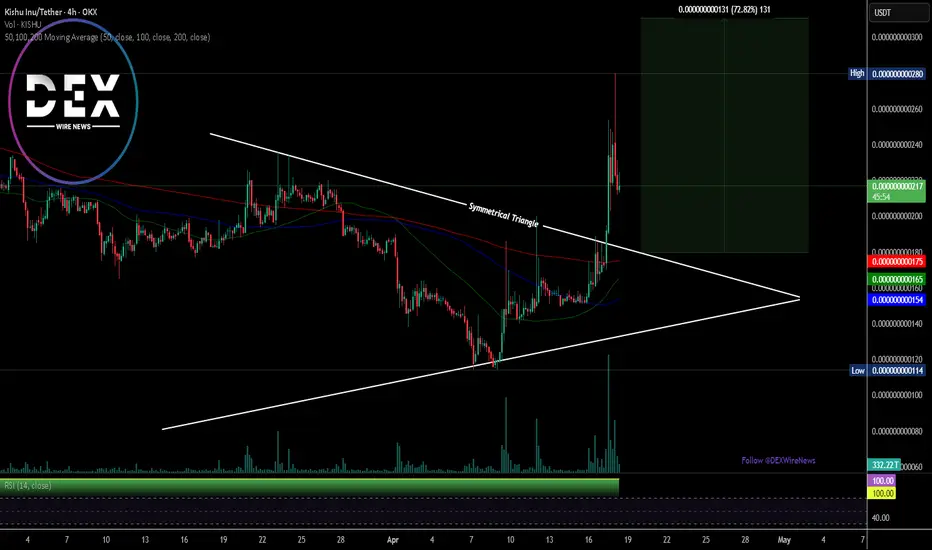
$KISHU Set for 70% Breakout Amidst Bullish Symmetrical Triangle The price of Kishu Inu ($KISHU) has recently broke out of a bullish symmetrical triangle pattern delivering a 53% gain for traders and investors alike. The memecoin is gearing for another legged-up with a 70% surge in sight.
For $KISHU to pull up this move, it has to break pass the $0.000000000235 resistant pivot a break above that level will be the catalyst $KISHU needs for a bullish renaissance.
Similarly, failure to break above that level could resort to a break below the ceiling of the symmetrical triangle leading to a selling spree.
What Is Kishu Inu (KISHU)?
Kishu Inu (KISHU) is a dog-based meme cryptocurrency that has selected the ‘Kishu’ dog breed as its mascot for its brand. The creators of KISHU do not hide that they were inspired by Dogecoin (DOGE), which was launched in 2013 and has since gained worldwide success and popularity.
Kishu Inu Price Data
The Kishu Inu price today is $2.19e-10 USD with a 24-hour trading volume of $5,106,038 USD. Kishu Inu is up 18.42% in the last 24 hours. The current CoinMarketCap ranking is #749, with a market cap of $20,391,110 USD. It has a circulating supply of 93,136,097,121,133,940 KISHU coins and the max. supply is not available.
$WELSH | Bottom Structure Forming Across All Timeframes📉 After a brutal 98% drawdown, $WELSH is beginning to flash signs of structural accumulation. While most ignore it, the chart is quietly preparing something bigger. From weekly to 4H, the setup is maturing — here’s the full breakdown:
🔹 1️⃣ Weekly Chart – Macro Base Forming
Price is coiling beneath the 50W MA
RSI at 34 → deeply oversold
Multi-month base developing
Bollinger Bands are compressing
Volume has dried up
Long lower wicks = quiet demand absorption
📌 Textbook pre-pump structure.
🔹 2️⃣ 3D Chart – Squeeze loading
Range-bound between 0.00027–0.00037 since February
Post-capitulation triangle forming
BBs at their tightest in 12+ months
RSI & MACD flatlined = maximum pressure build-up
📌 This isn’t chop — it’s setup.
🚀 Break 0.00037 → 0.00058+
🔹 3️⃣ 1D Chart – Momentum Is Loading
Bullish divergence: price flat, RSI rising
MACD coiling near zero
Volume returning on dips
Demand holding at 0.00030
Trendline breakout retested and respected
📌 Structure clean. Pressure rising.
🔹 4️⃣ 4H Chart – Trigger Zone
Range: 0.000326–0.000373
RSI recovering
MACD flipping green
BBs narrowing again
Price pressing resistance
🚨 Breakout trigger = volume >750K
Not the move — yet. But it’s ripening.
🔹 5️⃣ Seen this before?
Before SEED_DONKEYDAN_MARKET_CAP:BONK exploded +27,000%, it showed:
A –96% drawdown
RSI flatlined
BBs compressed
Volume gone
Now $WELSH is echoing that structure.
Different ticker. Same rhythm.
Most won’t see it. Some will front-run it.
⚔️ My View:
Accumulation is visible. Structure is clean. No breakout yet — but if/when it triggers, the asymmetry becomes extreme. This isn’t a chart you chase. It’s one you position for.
📌 Disclaimer: Not financial advice.

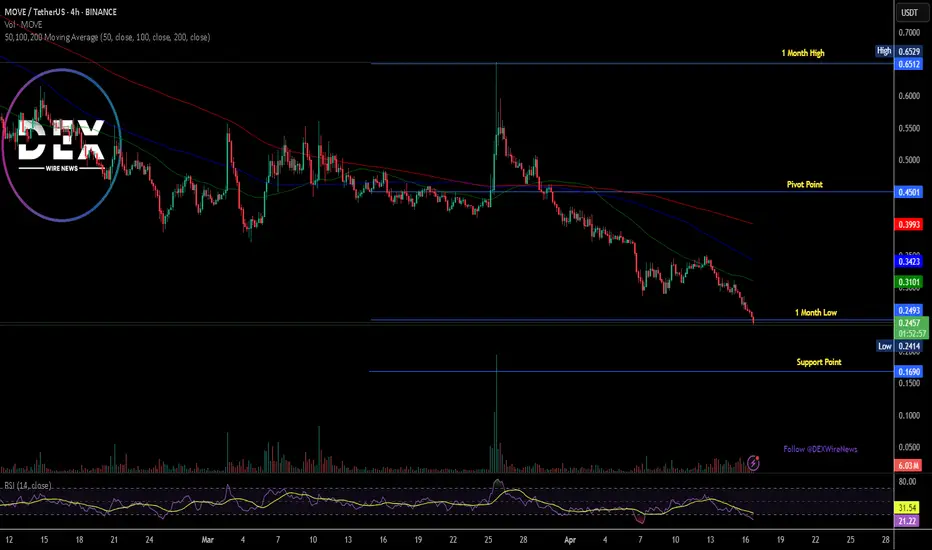
Breaking: Movement Token ($MOVE) Dips 12% TodayThe price of Movement coin ( TVC:MOVE ) nosedived 12% today, leading to a bearish pennant.
The ecosystem of Modular Move-Based Blockchains that enables developers to build secure, performant, and interoperable blockchain applications, bridging the gap between Move and EVM ecosystems has experience immense selling pressure today albeit the general crypto industry was also in a state of turmoil with CRYPTOCAP:BTC losing its $85k grip now down to $83k.
The first Move-EVM L2 for Ethereum has not being exempted, as hinted by the RSI at 20.64, TVC:MOVE has long being oversold with the asset moving around the 1-month low axis and a break below that axis could be dire for TVC:MOVE token.
Similarly, a break above the 50% Fibonacci retracement point could resort to a bullish reversal for Movement token ( TVC:MOVE ).
Movement Price Data
The Movement price today is $0.251764 USD with a 24-hour trading volume of $104,973,849 USD. Movement is down 10.27% in the last 24 hours. The current CoinMarketCap ranking is #87, with a live market cap of $616,822,310 USD. It has a circulating supply of 2,450,000,000 TVC:MOVE coins and a max. supply of 10,000,000,000 MOVE coins.
Yellow Ket Gearing For A Breakout Amidst Symmetrical Triangleyellow ket coin ($KET) a token created under the Avax ecosystem is set for a breakout move amidst a symmetrical triangle pattern on the 4-hour price chart.
Should the asset break from the Ceiling of the symmetrical triangle, a bullish campaign will be materialise with a 100% surge in sight albeit $KET has to be listed on major exchanges to fuel the hype of the memecoin.
Similarly, on a bearish scenario, a break below the symmetrical triangle could also send $KET to a nosedive- leading to a selling spree.
About yellow ket
YellowCatDAO sets itself apart by integrating cutting-edge AI-driven trading mechanisms with a community-centered governance model. At its core, the project leverages an AI agent capable of executing trades across multiple blockchain networks, making it a pioneer in cross-chain AI trading. Unlike typical trading bots, this AI agent not only focuses on profitability but also strategically reinvests gains into the project’s treasury to ensure sustainable growth and support ongoing initiatives.
yellow ket Metric
The live yellow ket price today is $0.184953 USD with a 24-hour trading volume of $5,874,478 USD. Yellow ket is down 3.78% in the last 24 hours, with a market cap of not available. The circulating supply is not available and the max. supply is not available.

Breaking: Purple Pepe ($PURPE) Is Gearing Up For BreakoutPurple pepe ($PURPE) One of the OG Pepe coins on Solana. Originally created July 2023, the token sat dormant on the blockchain. A year later, liquidity was added and trading went live.
The memecoin is now gearing up for a breakout once it breaks the $0.000046 psychological resistant zone, a 60% price surge is feasible with increasing momentum as hinted by the RSI at 54.72.
The crypto market is still volatile with CRYPTOCAP:BTC swinging in between the $80,000 - $85,000 support points. The memecoin hype is moderate now, most especially the Solana memecoinomy but the price of CRYPTOCAP:SOL has taken a deja vu lately, surprising the crypto market by reclaiming the $130 pivot point.
Should CRYPTOCAP:SOL undergo a bullish continuation pattern, this same momentum might dissipate to the Purple pepe ($PURPE) coin and not only $PURPE coin, but almost all the coins in the Solana ecosystem.
However, On a bearish tone, if $PURPE should fail to pull the bullish stunt, there is a possibility of a break below the $0.000035 support point which will negate the bullish thesis previously given as it will resort to massive selling spree.
Purple Pepe Price Live Data
The live Purple Pepe price today is $0.000041 USD with a 24-hour trading volume of $788,837 USD. Purple Pepe is down 4.21% in the last 24 hours. With a live market cap of $17,071,104 USD. It has a circulating supply of 417,213,801,892 $PURPE coins and a max. supply of 420,690,000,000 $PURPE coins.

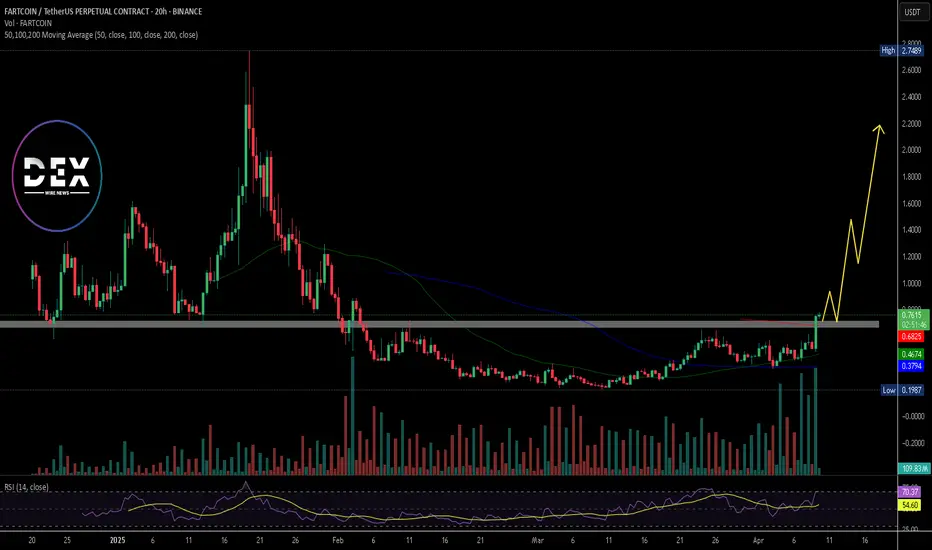
FARTCOIN Surges Over 35% in 24 Hours, Trading Volume Nears $444FARTCOIN, built on the Solana blockchain, has posted a strong daily gain. The token has risen 35.44% in the last 24 hours, 41.99% in the last seven days, and 227.62% in the last 30 days.
The current price stands at $0.7494, with a circulating supply of 999,998,256 tokens out of a total of 1 billion. Its market capitalization has reached $749.48 million while the 24-hour trading volume has spiked to $443.51 million, up 79.72%.
Technical Analysis: SEED_WANDERIN_JIMZIP900:FART Tests Key Resistance. Can It Break Above?
SEED_WANDERIN_JIMZIP900:FART is trading at $0.7494, showing bullish momentum. The price is trying to break through a major resistance level of around $0.7000, which has acted as a key level for prices for months.
The breakout comes with a strong volume, confirming buyer strength. The RSI is near 69.06, which also clarifies the bullish momentum in play. If a successful breakout is seen at the current resistance level, a move toward the previous high at $2,7 could follow.
Looking further at the 50 and 100 moving averages, they back up the bullish momentum as they all are below the current market price, reading at $0.46 and $0.37, respectively.
Breaking: SPX6900 ($SPX) Surged 23% Today Amidst Market TurmoilThe price of SPX6900 ( SP:SPX ) Surged 23% today amidst market volatility. Albeit it wasn't only the crypto industry undergoing correction, the stock market has had its own fair share of the dip with about $1.5 trillion wiped out from US stock market at open today.
As of the time of writing, SP:SPX is up 16.36%, there is still room for price surge as hinted by the RSI at 53. A breakout above the 1-month pivot could cement the path for a move to the $1 pivot.
Similarly, a break below the 50% Fibonacci level could negate the aforementioned bullish thesis leading to a consolidation move to the 1-month low region.
SPX6900 Price Live Data
The live SPX6900 price today is $0.537989 USD with a 24-hour trading volume of $58,478,403 USD. SPX6900 is up 18.38% in the last 24 hours. The current CoinMarketCap ranking is #100, with a live market cap of $500,863,790 USD. It has a circulating supply of 930,993,090 SPX coins and a max. supply of 1,000,000,000 SPX coins.

Mochi on Basewe are still in accumulation zone. last pump on january was for exit liquidity, some whales sold it and forget for the project and on another side come new whale who was DCA that downside pullback. Or just simple shakeout of weak hands who can't wait time)
I can show you any patern such as imbalance or order block / support level but in global we are still on same prices more than one year and i haven't seen any distribution yet.
By the way, Mochi is the oldest meme on Base network after Toshi, received grant from coinbase and named after CEO CB cat

Breaking: $VINE Spike 40% Gearing up for 120% Surge SEED_ALEXDRAYM_BIGMAC:VINE broke out of a falling wedge today, surging nearly 40% and now gearing up for a massive surge with 120% in sight.
VINE, since token listing, saw its value depreciate by over 94% amidst increased volatility and the fade of meme coins on the Solana ecosystem.
Currently up 39%, SEED_ALEXDRAYM_BIGMAC:VINE once surged to as high as almost $500 million in market cap before retracing to $47,745,773.09 million market cap. With about $177,738,447.8 million traded in the past 24 hours representing a 96% surge in trading volume, SEED_ALEXDRAYM_BIGMAC:VINE looks poised for a 120% legged-up with build up momentum as indicated by the RSI at 76.82.
With listings on major exchanges likes Kraken, HTX, Bitget, OKX, GateIO, MEXC, BingX, etc, SEED_ALEXDRAYM_BIGMAC:VINE has already solidified its stay here in the Solana ecosystem and a 120% breakout will ignite the fire once put out by the bears.
About Vine Coin
SEED_ALEXDRAYM_BIGMAC:VINE is a meme coin: January 18, 2025, Elon Musk says he is "looking into" bringing back Vine, and @rus, CEO of Vine, just launched a meme coin. Vine was a once-popular short video sharing platform that allowed users to shoot and upload videos up to 6 seconds long. Launched in 2012, it quickly gained a massive user base, especially among young people. Vine videos usually played in a loop, and users showcased their creativity and humor by producing various types of content. Many videos went viral on social media. In 2017, Twitter (Vine's parent company) announced the platform's shutdown. Although Vine has ceased operations, its impact remains significant, as many creators gained fame on the platform and moved to other sites like YouTube and Instagram.
Vine Coin Price Live Data
The live Vine Coin price today is $0.045998 USD with a 24-hour trading volume of $171,878,116 USD. Vine Coin is up 34.31% in the last 24 hours, with a live market cap of $45,997,451 USD. It has a circulating supply of 999,994,104 VINE coins and the max. supply is not available.

FARTCOIN Long Entry Signal for FARTCOIN / USDT 3Day Time FrameTicker: FARTCOINUSDT
Timeframe: 3D
Analysis:
MLR > SMA: The MLR (blue) is above the SMA (pink), signaling a bullish trend.
MLR > BB Center: MLR exceeds the Bollinger Bands Center Line (orange), showing strong bullish momentum.
PSAR: PSAR dots (black) are below the price, reinforcing the uptrend.
Price > SMA 21: Price is above the 21-period SMA (GREEN), indicating mid to long-term bullish strength for the 3Day time frame.
Trade Idea:
Entry: Consider a long position at this bar close.
Stop Loss: Place SL at the last PSAR level to limit downside risk.
Follow Me: Follow me for exit or profit-taking opportunities.
Outlook: All indicators align for a bullish move. Stay alert for reversal signals or trend shifts.
Risk Warning: Not financial advice, trade at your own risk

KANGO TO THE MOON! TECHNICAL ANALYSIS🔸 Chart Pattern: Falling Wedge Formation
KANGO has been trading inside a well-defined falling wedge, a classic bullish reversal pattern that often signals a potential breakout after sustained downtrend pressure. The price is nearing the apex and has started to show signs of bullish momentum, testing the upper resistance of the wedge.
🔸 Key Technical Highlights:
Support Zone: 0.00001200 – 0.00001800 USDT
Resistance Zone: 0.00010000 – 0.00018000 USDT
Breakout Trigger: A confirmed breakout above 0.00002000 USDT with volume confirmation
🔸 Indicators:
VMC Cipher B: Bullish divergence detected, momentum turning green, indicating hidden buyer strength
RSI (14): 45.43 and climbing – neutral territory, leaving room for a strong upward move
MFI (Money Flow Index): Currently at 56, suggesting renewed accumulation and capital inflow
Stochastic RSI: Oversold (~20), pointing to an imminent bullish crossover
🔸 Volume Analysis:
A visible volume squeeze is occurring; a spike in volume could catalyze a breakout and rapid price appreciation.
🚀 KANGO TO THE MOON 🔥
🎯 Falling wedge pattern? Check. Bullish divergence? Check. Meme coin magic? DOUBLE CHECK.
KANGO is locked, loaded, and ready to blast off! After months of consolidation, it's tightening the coil inside a textbook falling wedge, and the breakout zone is just a breath away. With bullish momentum building and the community revving up, all eyes are on KANGO to flip resistance into launch fuel. 🌕🚀
From stealth mode to beast mode – the KANGO ROCKET is warming up.
📈 Eyes on the 0.00002000 zone – a clean break here and it’s liftoff time!
🔥 If you're not strapped in yet, this might be your final boarding call.
👉 KANGO isn't just a meme. It's a MOVEMENT.

Osaka Protocol ($OSAK) Gears Up for a Surge!$OSAK has broken out of a falling wedge pattern, climbing 5% today, signaling potential upside momentum. The decentralized finance initiative, which emphasizes equal ownership and responsibility, once soared to nearly $300M market cap before retracing to its current $44M valuation.
With growing momentum and rising hype, RSI at 65 hints at further bullish movement. Since late February 2025, $OSAK has been in a falling wedge, mirroring the broader market downturn, shedding 71% of its value—but this breakout could mark a turning point.
Osaka Protocol Price Live Data
The live Osaka Protocol price today is $0.00000006.04 USD with a 24-hour trading volume of $73,505.72 USD. Osaka Protocol is up 5.79% in the last 24 hours, with a live market cap of $45,315,303 USD. It has a circulating supply of 750,869,738,630,302 OSAK coins and a max. supply of 1,000,000,000,000,000 OSAK coins.

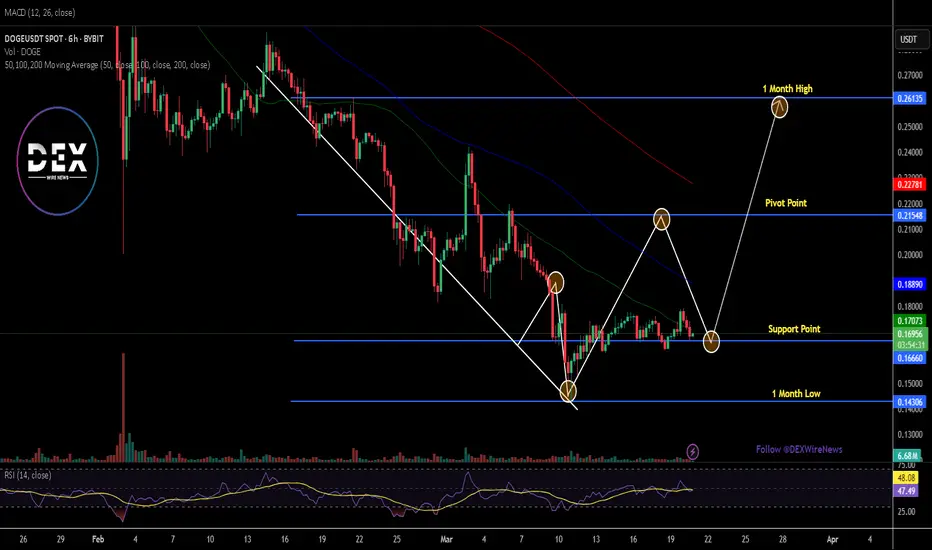
JUST IN: Elon Musk's DOGE Blocks $52 Mln Payment to WEFThe Department Of Government Efficiency (D.O.G.E) a mechanism set up by the President Donald Trump headed by Elon Musk in a shocking news has block $52 million payments intended to be given to the World Economic Forum (WEF). This and many more blockage and unnecessary spendings was tracked and blocked by the DOGE team.
Now, knowing Elon Musk's unwavering support to the altcoin Dogecoin ( CRYPTOCAP:DOGE ) a token that is based on the popular "doge" Internet meme and features a Shiba Inu on its logo, CRYPTOCAP:DOGE coin price is fundamentally tied to The Department Of Government Efficiency (D.O.G.E).
Somehow this mechanism set up by Donald Trump might be the catalyst needed by CRYPTOCAP:DOGE coin to break the psychological $1 resistant with traders eyeing a $1 move this year. As more frivolous spendings and wasting of government funds are unravel, CRYPTOCAP:DOGE coin might be on the verge of a breakout amidst a falling wedge pattern formed since the 2nd week of February, 2025.
Dogecoin Price Live Data
The live Dogecoin price today is $0.169289 USD with a 24-hour trading volume of $1,053,328,921 USD. Dogecoin is down 2.66% in the last 24 hours, with a live market cap of $25,141,281,592 USD. It has a circulating supply of 148,510,656,384 DOGE coins and the max. supply is not available.
$TUT Token Set for 100% Leap Amidst Symmetrical Triangle PatternTutorial Token ($TUT) an AI-powered educational tool designed to help people learn about blockchain, cryptocurrency, and specifically the BNB chain ecosystem is set for a 100% surge amidst a bullish symmetrical triangle pattern depicted on the chart.
The first product "Tutorial Agent" is a smart tutor that uses artificial intelligence to break down complex topics—like setting up a crypto wallet, trading on decentralized exchanges (DEXs), or even writing smart contracts—into bite-sized, easy-to-understand lessons. The $Tut token is used to reward users, unlock features, and govern the platform.
With the Token's RSI at 51 this gives $TUT more room to capitalize on the lack of buying pressure to pick momentum up and spark a bullish renaissance. A breakout above the ceiling of the symmetrical triangle will be the catalyst $TUT need for a turnaround.
Tutorial Price Live Data
The live Tutorial price today is $0.023490 USD with a 24-hour trading volume of $40,688,559 USD. Tutorial is down 19.19% in the last 24 hours, with a live market cap of $22,315,621 USD. It has a circulating supply of 949,999,986 TUT coins and a max. supply of 1,000,000,000 TUT coins.

Just In: $TRUMP Dips 5% Down to $10.86 Pivot Trump token a coin created in the start of the year 2025 that saw a noteworthy uptick surging from a low of $3 to almost $80 dips 5% today retracing to the $10.888 support point amidst general crypto landscape.
The 78.6% Fibonacci retracement point is acting as support point for $TRUMP a break below that level could lead to the 1-month low axis as the RSI is weak presently at 37.
Similarly, a break above the 38.2% Fibonacci retracement point could spark a bullish reversal move or a temporary reprieve albeit the crypto market is volatile at the moment.
OFFICIAL TRUMP Price Live Data
The live OFFICIAL TRUMP price today is $10.84 USD with a 24-hour trading volume of $476,149,181 USD. OFFICIAL TRUMP is down 5.55% in the last 24 hours, with a live market cap of $2,167,125,027 USD. It has a circulating supply of 199,999,527 TRUMP coins and a max. supply of 999,999,993 TRUMP coins.

Dejitaru Tsuka ($TSUKA) Needs to Break This Level For a ComebackDejitaru Tsuka ($TSUKA) a memecoin based on the Japanese legend of a special kind of dragon called Dejitaru Tsuka Dragon that is believed to bring good fortune to the one who holds it is set to break the 38.2% Fibonacci retracement level to make a comeback.
It is an ERC-20 token on the Ethereum blockchain that was launched in 2022 as a taxless token. The project aims to be accessible to everyone so that the memecoin’s popularity rises.
Having Rise in the month of November, 2024, $TSUKA saw a nosedive and has since consolidate in price for the past 4 months and a break above the 38.2% Fibonacci retracement point will catalyse a bullish reversal move with an envision 200% surge in the long term.
Dejitaru Tsuka Price Live Data
The live Dejitaru Tsuka price today is $0.002885 USD with a 24-hour trading volume of $58,996.00 USD. Dejitaru Tsuka is up 2.42% in the last 24 hours, with a live market cap of $2,885,109 USD. It has a circulating supply of 1,000,000,000 TSUKA coins and the max. supply is not available.

Potential Path of the Altcoin Market?Trading Family,
To say that our altcoin market has been disappointing would be the understatement of the year. While there definitely have been some winners (I have held Solana through the $8 low), the majority have been a large disappointment. In fact, the last I read, only 42 altcoins have outperformed Bitcoin since the bear market bottom was put in. This is an incredible stat to think about and very telling. Altcoin traders have a difficult task in beating the BTC hodl'ers for sure.
However, recently there have been some hidden indications that our altcoin market will soon increase our odds of success.
First of all, Bitcoin's low fees. Low fees on the Bitcoin blockchain is often a hidden health indicator for the coin signaling weak demand. People often see low fees as a positive thing. But what's actually happening here is that there is low demand for transacting on the chain, therefore, in order to increase the demand, transaction fees are forced down.
Weaker demand does seem to correlate with what the BTC dominance chart is showing us.
You can see from the chart that we have a large sell side liquidity block that has formed, indicating large sell side volume in dominance. Additionally, my indicator has flashed a red dot, signaling that it is time for dominance to drop. We also have our RSI and Macd, crossing down. And if we break from that channel, dominance drop momentum should accelerate.
This brings me to our TOTAL3 chart which is all altcoins excluding Ethereum. The chart is showing us that we have reached an extremely critical support trendline. Price is currently bouncing from it. Additionally, there are large volumes of buyers at this point. You can observe this by the VRVP candles and the liquidity blocks indicator. But contrary to BTC.D in which the RSI and Macd were crossing down, TOTAL3 shows our RSI and Macd crossing up! This is bullish for alts.
Finally, it is a great sign to see that our "M" pattern has looked to have completed right at our point of support.
I have drawn a projected pathway from here. In the first part of our next week, we may see a bit more pump. News of the passing continuing resolution here in the U.S. is still trickling out. Monday, as stock traders jump back in, I would imagine we see more pump as traders feel good about the averted gov't shutdown. This may trickle into Tuesday. But then Wed. is the Fed's day. We are expecting further pause to interest rate. Everyone will be listening to the Fed speak and parsing every syllable that is uttered from J. Pow's tongue. What is says and the bias that is interpreted will be key. I am expecting mostly a non-event here. Which means that bullish bias may wane once again. Crypto, mostly altcoins, really only pump on good news. But negative and even neutral news is a sell to sideways event. Thus, I expect we may hit another local top around Wed. afternoon at which point the altcoin market starts to sell a bit again OR it simply continues sideways again for a few more weeks. Sooner or later though, I believe we are headed towards that 1.3 trillion resistance. It is worthwhile considering to stay in a holding pattern unless we drop below our all-important support. Watch this line closely and draw it on your charts. It will be key!
✌️Stew

WHY Token Set for Breakout Amidst Symmetrical Triangle PatternBuilt on the Binance Blockchain (BNB) WHY is a bipolar Elephant, RAMPAGE after FOMO (In the dream). Dancing and Happi all the daytime.(In real life) $BNB. The token is set for a bullish surge amidst a Bullish symmetrical triangle with about 50% surge in sight.
Chart patterns like the bullish engulfing pattern has been formed waiting for a breakout above the celling of symmetrical triangle. With the Relative Strength Index (RSI) at 65, TSXV:WHY is more than ready for a breakout with build up momentum.
The Binance smart chain (BSC/BNB) is evolving rapidly as data from DefiLama shows about $5.134 Billion has been locked in Total Value Lock (TVL) by DeFi projects showing a level of immense trust levied on BSC chain.
WHY Price Live Data
The live WHY price today is $0.0000000677 USD with a 24-hour trading volume of $5,579,911 USD. WHY is up 5.95% in the last 24 hours, with a live market cap of $28,417,541 USD. It has a circulating supply of 420,000,000,000,000 WHY coins and a max. supply of 420,000,000,000,000 WHY coins.

Dogelon Mars Set For Price Reversal Amidst Steep Falling Wedge Dogelon Mars is a dog-themed meme coin built on the Ethereum and Polygon chain, following the example of other successful dog coins like Dogecoin, Shiba Inu and Floki Inu is set for a price reversal after surging 250% in the Month of January 17th, 2025 before quickly retracing.
Chart pattern shows an impending 400% surge coming up on the horizon. With partnerships from top blockchains like Arbitrum, Orca, Houbi, OKX, Solana, etc. AMEX:ELON coin is set to be on a bullish course with a 400% surge in sight.
Dogelon Mars has had a market cap of $1.25 billion in the year 2021 before retracing to $72.5 Million in market with increasing momentum and an active telegram community AMEX:ELON is very much ready for the next legged-up.
About Dogelon Mars
Dogelon Mars plays on several popular themes in the meme coin space. Its name is a mixture of Dogecoin and Elon Musk, the billionaire entrepreneur who is an outspoken supporter of Doge. It alludes to Mars, a spin on the famous moon meme, implying that Dogelon will experience a massive upward movement. Beyond its tongue-in-cheek name, Dogelon Mars has managed to build a significant community, with more than 494,000 Twitter followers and more than 48,000 followers on Telegram.

ELON - Bullish White SwanThis chart speaks for itself: A bullish White Swan pattern has formed on the ELON USD chart, which is very bullish.
This is not a financial advice. DYOR

BITCOIN $BTCUSD | BTC BEARISH TREND & STRATEGIC BITCOIN RESERVEBITCOIN BITSTAMP:BTCUSD | BTC BEARISH TREND & STRATEGIC BITCOIN RESERVE Mar09'25
Sparros Exchange Trend Table:
BITSTAMP:BTCUSD Weekly: Bullish
BITSTAMP:BTCUSD Daily: Bearish
BITSTAMP:BTCUSD 4H: Bearish
BITSTAMP:BTCUSD 1H: Bearish
Bitcoin Zones:
Bitcoin BUY/LONG ZONE (GREEN): $90,500 - $106,000
Bitcoin DO NOT TRADE/DNT ZONE (WHITE): $84,000 - $90,500
Bitcoin SELL/SHORT ZONE (RED): $69,000 - $84,000
Bitcoin is currently trading at $86,000, reflecting a bearish trend after reaching its all-time high nearly two months ago. The cryptocurrency has experienced substantial volatility, with the price having previously consolidated in higher ranges.
As of recent developments, the U.S. government has announced a "Strategic Bitcoin Reserve," indicating the government’s growing commitment to digital assets. This move is seen as part of a broader strategy to strengthen the U.S.'s position as a leader in the global digital currency space, though no specific amount of Bitcoin has been disclosed for this reserve.
This is what I would personally look at before entering trades, everything is subject to change on a daily basis and as I analyze different timeframes and ideas.
ENTERTAINMENT PURPOSES ONLY, NOT FINANCIAL ADVICE!
trendanalysis, trendtrading, priceaction, priceactiontrading, technical indicators, support and resistance, bitcoin, bitcoin price, bitcoin halving, btcusd, btc,
BTC, BITSTAMP:BTCUSD , bitcointrades, bitcoinlong, btcusdlong, bitcoinshort, btcusdshort, bitcoinanalysis, bitcointrend, bitcoinrange, bitcointriangle, triangle, ascendingtriangle, chartpatterns, trianglechart, ascendingtrianglebreakout, chartpatternbitcoin, bitcointriangle, bitcoinhalvingschedule, bitcoinbreakout, bitcoinrange, bitcoinrangebreakout, triangularpattern, flag, bitcoinpatterns, bitcoinchartpatterns, btcpatterns, btctriangletrade, btctrianble, btctrend, btctrades, btclong, btcshort, btcrange, btcbreakout, btcbreakdown, bitcoinover100000, bitcoin100, bitcoinover100, onehundredthousand, bitcoinascendingtrianglepattern, bitcoinpullbacks, bitcoindrop, bitcoinpricerally

$GIGA GIGACHAD Supernova!!!BME:GIGA GIGACHAD (MARKET CAP $144.77M --> $50Bil MC)
entry PTs 0.0065 - 0.01 - 0.014
Next Target PTs 5.19-12.14 and higherrr
Returns +345X fm $144.77Mil MC-805X
63LfDmNb3MQ8mw9MtZ2To9bEA2M71kZUUGq5tiJxcqj9
