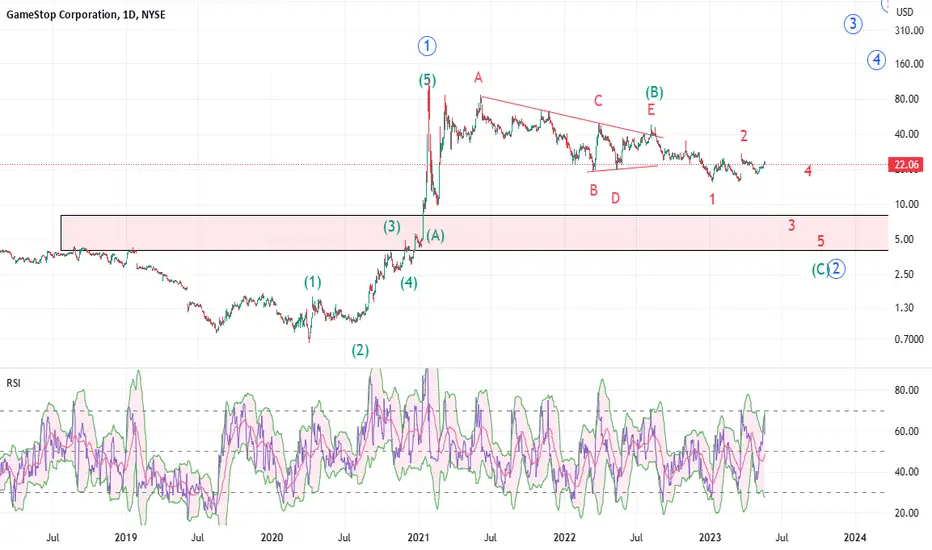
GME: should have more downsideGME the king of meme stock is still on correction mode. On a log scale it doesn't look that bad really; specially if one compares with the lot of crypto charts. Anyhow, at this moment it looks like GME has some ways to go to complete the corrective wave 2. When price goes parabolic, it is quite natural to have a prolonged corrective phase. Price should come down to previous lower degree wave 3 to wave 4 area. Back in 21, I remember gambling 20 bucks into 200 in less than a week and then got stuck on Robinhood with put options when they stopped trading. Insane times... Hopefully, next time around, GME will graduate from a meme stock to something with actual fundamentals behind the company to start a long term uptrend (AKA cycle degree wave 3)...one can hope.
Memestocks
$PEPE is range-boundCrypto prices continue to bleed across my watchlist...frog is trying to establish bottom. Price is in the bottom of the rectangle.
Looks like it will range here for a while or dump further. Needs volume to move imo.
FWB:PEPE is range-bound, poor volume; 1h.
Set fractal alerts,
Bearish breakout: 0.00000177
Bullish breakout: 0.00000214

🔥 PEPE Falling Wedge: Ideal Reversal PointPEPE is one of the hottest tokens at the moment, which makes it a very attractive token to scout for potential entries.
PEPE has hit its first hourly oversold moment since it started trading on Binance. This has often been a great time to step into volatile tokens.
Furthermore, PEPE appears to be trading in some sort of falling wedge pattern, which is a bullish reversal pattern.
If BTC will stop dumping, I'm confident that PEPE will move towards the top resistance of the pattern, potentially even break out through it.

Swatch AG (UHR.vx) bullish scenario:The technical figure Falling Wedge can be found in the daily chart in the Swiss company The Swatch Group Ltd (UHR.vx). The Swatch Group Ltd is a Swiss manufacturer of watches and jewellery. The Swatch Group is the world's largest watch company and employs about 36,000 people in 50 countries. The group owns the Swatch product line and other brands, including Blancpain, Breguet, Certina, ETA, Glashütte Original, Hamilton, Harry Winston, Longines, Mido, Omega, Rado, and Tissot. The Falling Wedge broke through the resistance line on 21/04/2023. If the price holds above this level, you can have a possible bullish price movement with a forecast for the next 9 days towards 312.60 CHF. According to experts, your stop-loss order should be placed at 285.60 CHF if you decide to enter this position.
The Swiss company said it expects record sales in 2023 boosted by the return of demand in China, Hong Kong and Macau, which was hit by the return of COVID-19 cases last year, and as Chinese tourists resume their travels.
"Group Management anticipates strong sales growth in 2023 in all regions and segments," Swatch said, noting that consumption had quickly recovered in Hong Kong and Macau as well as China after pandemic restrictions were lifted.
Risk Disclosure: Trading Foreign Exchange (Forex) and Contracts of Difference (CFD's) carries a high level of risk. By registering and signing up, any client affirms their understanding of their own personal accountability for all transactions performed within their account and recognizes the risks associated with trading on such markets and on such sites. Furthermore, one understands that the company carries zero influence over transactions, markets, and trading signals and cannot be held liable nor guarantee any profits or losses.

Legrand (LR.pa) bullish scenario:The technical figure Channel Down can be found in the daily chart in the French company Legrand (LR.pa). Legrand is a French industrial group.
Legrand is established in 90 countries and its products are distributed in nearly 180. It generates 85% of its sales internationally. The group has expanded its product range in sustainable development and energy saving technologies, and has developed new products for EV charging/electric vehicles, lighting control and datacenters. The Channel Down broke through the resistance line on 19/04/2023. If the price holds above this level, you can have a possible bullish price movement with a forecast for the next 6 days towards 87.50 EUR. According to experts, your stop-loss order should be placed at 78.44 EUR if you decide to enter this position.
Risk Disclosure: Trading Foreign Exchange (Forex) and Contracts of Difference (CFD's) carries a high level of risk. By registering and signing up, any client affirms their understanding of their own personal accountability for all transactions performed within their account and recognizes the risks associated with trading on such markets and on such sites. Furthermore, one understands that the company carries zero influence over transactions, markets, and trading signals and cannot be held liable nor guarantee any profits or losses.

Schneider (SU.pa) bullish scenario:The technical figure Triangle can be found in the daily chart in the French company Schneider Electric (SU.pa). Schneider Electric SE is a French multinational company that specializes in digital automation and energy management. It addresses homes, buildings, data centers, infrastructure and industries, by combining energy technologies, real-time automation, software, and services. The Triangle broke through the resistance line on 19/04/2023. If the price holds above this level, you can have a possible bullish price movement with a forecast for the next 9 days towards 155.86 EUR. According to experts, your stop-loss order should be placed at 141.38 EUR if you decide to enter this position.
Schneider Electric S.E. (SU.PA)’s target to achieve net-zero operational emissions and to reduce Scope 3 emissions by 35% by 2030 (compared to Scope 3 emissions in 2017) was validated by the SBTi in 2019.
Schneider's EcoStruxure solutions assisted customers in reducing carbon emissions by 84 million tonnes in 2021, totaling 347 million tonnes saved or avoided since 2018. Moreover, since launching The Zero Carbon Project in April 2021, Schneider Electric S.E. (SU.PA) has been working closely with 1,000 of its top suppliers to reduce operational carbon emissions by half by 2025.
Risk Disclosure: Trading Foreign Exchange (Forex) and Contracts of Difference (CFD's) carries a high level of risk. By registering and signing up, any client affirms their understanding of their own personal accountability for all transactions performed within their account and recognizes the risks associated with trading on such markets and on such sites. Furthermore, one understands that the company carries zero influence over transactions, markets, and trading signals and cannot be held liable nor guarantee any profits or losses.

Altria Group (MO) bullish scenario:The technical figure Triangle can be found in the daily chart in the US company Altria Group, Inc. (MO). Altria Group, Inc. (previously known as Philip Morris Companies, Inc.) is an American corporation and one of the world's largest producers and marketers of tobacco, cigarettes and related products. Altria is the parent company of Philip Morris USA, John Middleton, Inc., U.S. Smokeless Tobacco Company, Inc., and Philip Morris Capital Corporation. Altria also maintains large minority stakes in Belgium-based brewer AB InBev, the Canadian cannabis company Cronos Group, and the e-cigarette maker Juul. The Triangle broke through the resistance line on 15/04/2023. If the price holds above this level, you can have a possible bullish price movement with a forecast for the next 15 days towards 46.65 USD. According to experts, your stop-loss order should be placed at 44.49 USD if you decide to enter this position.
Altria will be looking to display strength as it nears its next earnings release, which is expected to be April 27, 2023. In that report, analysts expect Altria to post earnings of $1.19 per share. This would mark year-over-year growth of 6.25%. Our most recent consensus estimate is calling for quarterly revenue of $4.98 billion, up 3.29% from the year-ago period.
Investors should also note Altria's current valuation metrics, including its Forward P/E ratio of 8.87. This valuation marks a premium compared to its industry's average Forward P/E of 8.72
Risk Disclosure: Trading Foreign Exchange (Forex) and Contracts of Difference (CFD's) carries a high level of risk. By registering and signing up, any client affirms their understanding of their own personal accountability for all transactions performed within their account and recognizes the risks associated with trading on such markets and on such sites. Furthermore, one understands that the company carries zero influence over transactions, markets, and trading signals and cannot be held liable nor guarantee any profits or losses.

JPMorgan Chase (JPM) bullish scenario:The technical figure Triangle can be found in the daily chart in the US company JPMorgan Chase (JPM). JPMorgan Chase & Co. is an American multinational financial services company. It is the largest bank in the United States and the world's largest bank by market capitalization (as of 2023).The firm operates the largest investment bank in the world by revenue. The Triangle broke through the resistance line on 15/04/2023. If the price holds above this level, you can have a possible bullish price movement with a forecast for the next 9 days towards 145.00 USD. According to experts, your stop-loss order should be placed at 126.85 USD if you decide to enter this position.
JPMorgan Chase (JPM), Wells Fargo (WFC), Citigroup (C) and PNC (PNC) all reported surging revenue and profits in the first quarter even as regulators seized some regional lenders and panic spread across the financial system in March.
JPMorgan’s net interest income jumped +49%, as average loans increased +5% and net-interest margin expanded to 2.63% from 1.67% in the year-earlier period.
Risk Disclosure: Trading Foreign Exchange (Forex) and Contracts of Difference (CFD's) carries a high level of risk. By registering and signing up, any client affirms their understanding of their own personal accountability for all transactions performed within their account and recognizes the risks associated with trading on such markets and on such sites. Furthermore, one understands that the company carries zero influence over transactions, markets, and trading signals and cannot be held liable nor guarantee any profits or losses.

Diageo plc (DGE.l) bullish scenario:The technical figure Triangle can be found in the daily chart in the UK company Diageo plc (DGE.l). Diageo plc is a British multinational alcoholic beverage company. It is a major distributor of Scotch whisky and other spirits. Distilleries owned by Diageo, produce 40% of all Scotch whisky with over 24 brands, such as Johnnie Walker, J&B and Vat 69. Its leading brands include Johnnie Walker, Guinness, Smirnoff, Baileys liqueur, Captain Morgan rum and Tanqueray and Gordon's gin. The Triangle broke through the resistance line on 23/03/2023. If the price holds above this level, you can have a possible bullish price movement with a forecast for the next 15 days towards 3 739.00 GBX. According to experts, your stop-loss order should be placed at 3 438.50 GBX if you decide to enter this position.
If you believe that markets are even vaguely efficient, then over the long term you'd expect a company's share price to follow its earnings per share (EPS) outcomes. That means EPS growth is considered a real positive by most successful long-term investors. Diageo managed to grow EPS by 7.3% per year, over three years. While that sort of growth rate isn't anything to write home about, it does show the business is growing.
Risk Disclosure: Trading Foreign Exchange (Forex) and Contracts of Difference (CFD's) carries a high level of risk. By registering and signing up, any client affirms their understanding of their own personal accountability for all transactions performed within their account and recognizes the risks associated with trading on such markets and on such sites. Furthermore, one understands that the company carries zero influence over transactions, markets, and trading signals and cannot be held liable nor guarantee any profits or losses.

Baxter Inc. (BAX) bullish scenario:The technical figure Falling Wedge can be found in the daily chart in the US company Baxter International Inc. (BAX). Baxter International Inc. is an American multinational healthcare company. The company primarily focuses on products to treat kidney disease, and other chronic and acute medical conditions. The Falling Wedge broke through the resistance line on 22/03/2023. If the price holds above this level, you can have a possible bullish price movement with a forecast for the next 9 days towards 41.98 USD. According to experts, your stop-loss order should be placed at 37.35 USD if you decide to enter this position.
U.S. scientific instruments maker Thermo Fisher Scientific Inc and South Korea's Celltrion Inc are among those competing to acquire the biopharma solutions business of medical device maker Baxter International Inc, according to people familiar with the matter.
The divestment, which the sources said could fetch more than $4 billion, would help Baxter pay down debt following its $10.5 billion acquisition of medical device maker Hill-Rom Holdings in 2021. Baxter, which has a market value of $19 billion, had total debt of $16.6 billion as of the end of December.
Private equity firms, including KKR & Co and Carlyle Group, have also expressed interest in the Baxter business, the sources said. Other bidders could still emerge, they added.
Risk Disclosure: Trading Foreign Exchange (Forex) and Contracts of Difference (CFD's) carries a high level of risk. By registering and signing up, any client affirms their understanding of their own personal accountability for all transactions performed within their account and recognizes the risks associated with trading on such markets and on such sites. Furthermore, one understands that the company carries zero influence over transactions, markets, and trading signals and cannot be held liable nor guarantee any profits or losses.

Bayer AG (BAYN.de) bullish scenario:The technical figure Falling Wedge can be found in the daily chart in the German company Bayer AG (BAYN.de). Bayer AG is a German multinational pharmaceutical and biotechnology company and one of the largest pharmaceutical companies in the world. Headquartered in Leverkusen, Bayer's areas of business include pharmaceuticals; consumer healthcare products, agricultural chemicals, seeds and biotechnology products. The Falling Wedge broke through the resistance line on 22/03/2023. If the price holds above this level, you can have a possible bullish price movement with a forecast for the next 9 days towards 60.750 EUR. According to experts, your stop-loss order should be placed at 54.890 EUR if you decide to enter this position.
Bayer AG plans to spend $1 billion on drug research and development in the U.S. this year as it works to double its sales in the country by the end of the decade, Bayer's top U.S. pharmaceutical executive told Reuters.
Sebastian Guth, president of Bayer's pharmaceuticals business in the Americas, in an interview with Reuters, said the company increased U.S. employees working on marketing for its pharmaceutical business by around 50% over the last three years and plans to expand on that by another 75% by 2030.
Risk Disclosure: Trading Foreign Exchange (Forex) and Contracts of Difference (CFD's) carries a high level of risk. By registering and signing up, any client affirms their understanding of their own personal accountability for all transactions performed within their account and recognizes the risks associated with trading on such markets and on such sites. Furthermore, one understands that the company carries zero influence over transactions, markets, and trading signals and cannot be held liable nor guarantee any profits or losses.

Nike Inc. (NKE) bullish scenario:The technical figure Falling Wedge can be found in the daily chart in the US company Nike Inc. (NKE). Nike Inc. is an American multinational corporation that is engaged in the design, development, manufacturing, and worldwide marketing and sales of footwear, apparel, equipment, accessories, and services It is the world's largest supplier of athletic shoes and apparel and a major manufacturer of sports equipment, with revenue in excess of US$46 billion in its fiscal year 2022. The Falling Wedge broke through the resistance line on 17/03/2023. If the price holds above this level, you can have a possible bullish price movement with a forecast for the next 6 days towards 123.99 USD. According to experts, your stop-loss order should be placed at 115.87 USD if you decide to enter this position.
Nike is expected to report a rise in third-quarter revenue and grow its market share through 2023, helped by major rival Adidas' split with designer and rapper Kanye West which caused the German company to lose about $600 million in quarterly sales.
Nike is also expected to get a boost from higher sales of its Jordan Retros and some newer launches as the world's No. 1 sportswear maker stays ahead of rivals through its innovative product lines.
Risk Disclosure: Trading Foreign Exchange (Forex) and Contracts of Difference (CFD's) carries a high level of risk. By registering and signing up, any client affirms their understanding of their own personal accountability for all transactions performed within their account and recognizes the risks associated with trading on such markets and on such sites. Furthermore, one understands that the company carries zero influence over transactions, markets, and trading signals and cannot be held liable nor guarantee any profits or losses.

CaixaBank (CABK.mc) bearish scenario:The technical figure Channel Up can be found in the daily chart in the Spanish company CaixaBank, S.A. (CABK.mc). CaixaBank, S.A. is a Spanish multinational financial services company. It is Spain's third-largest lender by market value, after Banco Santander and BBVA. CaixaBank has 5,397 branches to serve its 15.8 million customers and has the most extensive branch network in the Spanish market. It is listed in the Bolsa de Madrid and is part of the IBEX 35.
The company consists of the universal banking and insurance activities of the La Caixa group, along with the group's stakes in the oil and gas firm Repsol, the telecommunications company Telefónica and its holdings in several other financial institutions.
Channel Up broke through the support line on 18/03/2023. If the price holds below this level, you can have a possible bearish price movement with a forecast for the next 47 days towards 3.2770 EUR. According to experts, your stop-loss order should be placed at 4.1970 EUR if you decide to enter this position.
Risk Disclosure: Trading Foreign Exchange (Forex) and Contracts of Difference (CFD's) carries a high level of risk. By registering and signing up, any client affirms their understanding of their own personal accountability for all transactions performed within their account and recognizes the risks associated with trading on such markets and on such sites. Furthermore, one understands that the company carries zero influence over transactions, markets, and trading signals, therefore, cannot be held liable nor guarantee any profits or losses.

$GME: Bullish Deep Gartley Trade Idea Remains ValidEarlier, GME hit the Stoploss level of the Previous Chart Idea, but it did not make a new low and has since gone back to the 0.886 PCZ level and is making a Second Level of MACD Bullish Divergence as a result. Due to these factors I think that this Bullish trade Idea is still alive and upon zooming out I can see that this could be a more Macro Double Bottom that could set us up for a Bullish Dragon Breakout in the coming weeks. If we break above the trend line we could see a rally to the 0.618 retracement, which would be a doubling of the current price.

$GME: Perfect Bullish Deep Gartley on the DailyGME may be setting up for a rally towards the $20 area as It's recently broken out of a long term up trending channel but has formed this nice looking Bullish Deep Gartley that could send it up to atleasat backtest the channel or the moving averages as resistance.

Fresenius (FRE.de) bearish scenario:The technical figure Channel Up can be found in the daily chart in the German company Fresenius SE & Co. KGaA (FRE.de). Fresenius SE & Co. KGaA is a European multinational healthcare company. It provides products and services for dialysis in hospitals and inpatient and outpatient medical care. It is involved in hospital management and in engineering and services for medical centers and other healthcare facilities. Channel Up broke through the support line on 24/02/2023. If the price holds below this level, you can have a possible bearish price movement with a forecast for the next 15 days towards 24.00 EUR. According to experts, your stop-loss order should be placed at 29.710 EUR if you decide to enter this position.
Fresenius SE is exploring steps to relinquish control of its dialysis subsidiary as Elliott Investment Management puts pressure on the German healthcare company to simplify its business.
Risk Disclosure: Trading Foreign Exchange (Forex) and Contracts of Difference (CFD's) carries a high level of risk. By registering and signing up, any client affirms their understanding of their own personal accountability for all transactions performed within their account and recognizes the risks associated with trading on such markets and on such sites. Furthermore, one understands that the company carries zero influence over transactions, markets, and trading signals, therefore, cannot be held liable nor guarantee any profits or losses.

Comcast (CMCSA) bearish scenario:The technical figure Channel Up can be found in the daily chart in the US company Comcast Corporation (CMCSA). Comcast Corporation is the largest American multinational telecommunications conglomerate. It is the second-largest broadcasting and cable television company in the world by revenue (behind AT&T), the largest pay-TV company, the largest cable TV company and largest home Internet service provider in the United States, and the nation's third-largest home telephone service provider. It provides services to U.S. residential and commercial customers in 40 states and the District of Columbia. The Channel UP broke through the support line on 22/02/2023. If the price holds below this level, you can have a possible bearish price movement with a forecast for the next 23 days towards 34.83 USD. According to experts, your stop-loss order should be placed at 40.74 USD if you decide to enter this position.
Comcast Corp has cut its stake in BuzzFeed Inc by 8.5% since the end of January, cashing in on a rally in the shares of the digital media company on reports of a plan to partner with OpenAI, the artificial intelligence firm behind ChatGPT.
It has so far sold more than 11 million BuzzFeed shares since Jan. 30, reducing its stake to 15.5% from 24%. The sale fetched Comcast about $28 million, according to a Reuters calculation.
It sold roughly four million shares for an average price of around $2.90 apiece at the end of January, and most recently dumped another 500,000 shares for an average of $2.05 a share, filings by Comcast showed.
NBCUniversal, Comcast's entertainment unit, had invested $200 million in BuzzFeed in 2015 and injected another $200 million in 2016, valuing the company at around $1.7 billion.
Risk Disclosure: Trading Foreign Exchange (Forex) and Contracts of Difference (CFD's) carries a high level of risk. By registering and signing up, any client affirms their understanding of their own personal accountability for all transactions performed within their account and recognizes the risks associated with trading on such markets and on such sites. Furthermore, one understands that the company carries zero influence over transactions, markets, and trading signals, therefore, cannot be held liable nor guarantee any profits or losses.

Prudential (PRU.l) bearish scenario:The technical figure Channel Up can be found in the daily chart in the UK company Prudential plc (PRU.l). Prudential plc is a British multinational insurance company. It was founded in London in May 1848 to provide loans to professional and working people. The Channel UP broke through the support line on 22/02/2023. If the price holds below this level, you can have a possible bearish price movement with a forecast for the next 25 days towards 1 173.20 GBX. According to experts, your stop-loss order should be placed at 1 336.00 GBX if you decide to enter this position.
Prudential's stock increased significantly by 41% over the past three months. But the company's key financial indicators appear to be differing across the board and that makes us question whether or not the company's current share price momentum can be maintained.
While the company does have a high rate of reinvestment, the low ROE means that all that reinvestment is not reaping any benefit to its investors, and moreover, its having a negative impact on the earnings growth.
Prudential's earnings have declined over five years, contributing to shareholders 21% loss.
Risk Disclosure: Trading Foreign Exchange (Forex) and Contracts of Difference (CFD's) carries a high level of risk. By registering and signing up, any client affirms their understanding of their own personal accountability for all transactions performed within their account and recognizes the risks associated with trading on such markets and on such sites. Furthermore, one understands that the company carries zero influence over transactions, markets, and trading signals, therefore, cannot be held liable nor guarantee any profits or losses.

$BBBY Shorts started coveringThese 15 min candles are what show shorts covering. The green disks we can expect a domino effect with the covering here soon. Expect volatility to come and big moves to come.

Meliá (MEL.mc) bearish scenario:The technical figure Triangle can be found in the daily chart in the Spanish company Meliá Hotels International, S.A. (MEL.mc). Meliá Hotels International, S.A. is a Spanish hotel chain. The company is one of Spain's largest domestic operators of holiday resorts and the 17th biggest hotel chain worldwide. Domestically in Spain the company is the market leader in both resort and urban hotels. Currently, the hotel chain operates 374 hotels in 40 countries on 4 continents under the brands Meliá, Gran Meliá, ME by Meliá, Paradisus, Innside by Meliá, TRYP by Wyndham, Sol Hotels and Club Meliá. The Triangle broke through the support line on 21/02/2023. If the price holds below this level, you can have a possible bearish price movement with a forecast for the next 12 days towards 5.545 EUR. According to experts, your stop-loss order should be placed at 6.200 EUR if you decide to enter this position.
Risk Disclosure: Trading Foreign Exchange (Forex) and Contracts of Difference (CFD's) carries a high level of risk. By registering and signing up, any client affirms their understanding of their own personal accountability for all transactions performed within their account and recognizes the risks associated with trading on such markets and on such sites. Furthermore, one understands that the company carries zero influence over transactions, markets, and trading signals, therefore, cannot be held liable nor guarantee any profits or losses.

Cisco Inc. (CSCO) bullish scenario:The technical figure Ascending Triangle can be found in the daily chart in the US company Cisco Systems, Inc. (CSCO). Cisco Systems Inc., commonly known as Cisco, is an American-based multinational digital communications technology conglomerate corporation. Cisco develops, manufactures, and sells networking hardware, software, telecommunications equipment and other high-technology services and products. Cisco specializes in specific tech markets, such as the Internet of Things (IoT), domain security, videoconferencing, and energy management with leading products including Webex, OpenDNS, Jabber, Duo Security, and Jasper. The Triangle broke through the resistance line on 17/02/2023. If the price holds above this level, you can have a possible bullish price movement with a forecast for the next 7 days towards 52.35 USD. Your stop-loss order, according to experts, should be placed at 46.43 USD if you decide to enter this position.
Investors grew optimistic about Cisco's stock last week after the company reported non-GAAP (adjusted) earnings of $0.88 per share, which was an increase of 5% from the year-ago quarter and beat analysts' consensus estimate of $0.85.
The tech giant also impressed inventors with its second-quarter sales of $13.6 billion -- up 7% year over year -- which outpaced Wall Street's expectation of about $13.4 billion for the quarter.
Sales climbed higher due in part to the company's total software revenue rising 10% from the year-ago quarter to $4.2 billion. Cisco's management said on the company's earnings call that 84% of its software revenue is now subscription-based, up 4% from the year-ago quarter.
Risk Disclosure: Trading Foreign Exchange (Forex) and Contracts of Difference (CFD's) carries a high level of risk. By registering and signing up, any client affirms their understanding of their own personal accountability for all transactions performed within their account and recognizes the risks associated with trading on such markets and on such sites. Furthermore, one understands that the company carries zero influence over transactions, markets, and trading signals and cannot be held liable nor guarantee any profits or losses.

VERU Options Ahead of EarningsLooking at the VERU options chain ahead of earnings , I would buy the $10 strike price Calls with
2023-4-21 expiration date for about
$0.60 premium.
If the options turn out to be profitable Before the earnings release, I would sell at least 50%.
Looking forward to read your opinion about it.

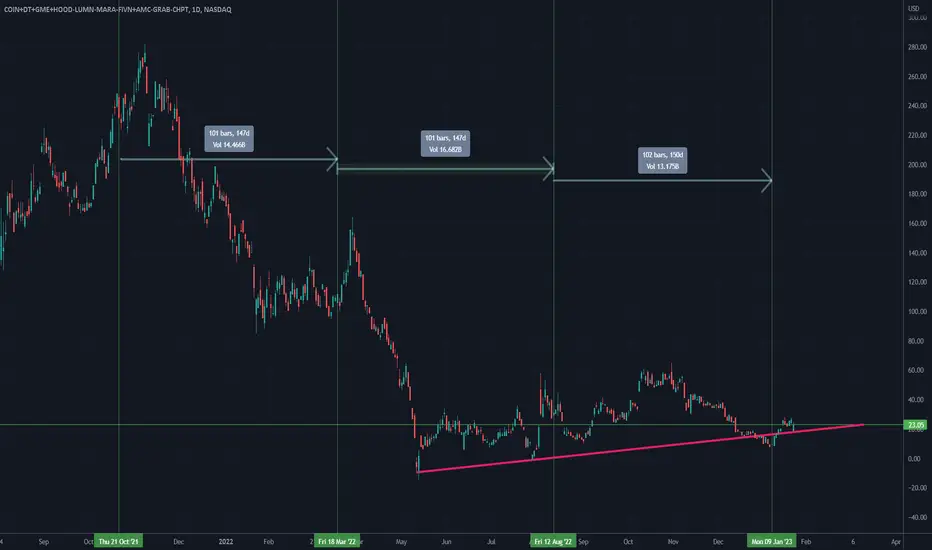
$GME Meme Basket: No ideaEnjoy the new GME basket. One stock was removed and was replaced with MARA a couple of weeks ago. I would've added APE as -APE in the formula that makes this basket, but Tradingview only allows up to 10 symbols to be combined into 1 ticker and APE is the 11'th ticker in this so...
Down to business, i have literally no clue what's going to happen.
imgur.com
Data says big downs, looks legit in my opinion. I have some reservations on what's going to happen so i'm keeping my eyes peeled.
In other news, FINV and GRAB are no longer in the data i'm receiving as of yesterday. No reason at all. I contacted TheOCC to see what's up with that.
Funnily enough, GRAB is IN the GME meme basket whilst another ticker called FIVN (Five9) is also in the basket whereas they removed GRAB and FINV(Finvolution). All timed perfectly with this auction error on open yesterday, all also timed perfectly well with when all of Opex Friday's volume was supposed to hit the tape yesterday but instead we got multiple chained glitches instead.
That being said, i have no idea where the market wants to move. TQQQ and QQQ are making huge moves in one direction whilst SPY is making big moves in the opposite direction. This flip happened before in Oct - December 2022 and now seems to be happenining again. I don't know what it means yet. I have no idea the direction we'll be taking. I need more data and more time. There's too many scenarios that could happen and it's impossible to pick the right one right now. We could start seeing volume on Friday due to yesterday's big OPEX volume having been FTD'd, we could see volume today from Monday's T+2 share settlement from option settlement... We could see T+3 share settlement or T+6 settlement into next week's Tuesday. We could see a move in around 33 days from now... it could be anything... So for now, i have no idea.
Guesstimate: Don't trade based on this. I think we'll have a short period of neutral trading as the flip between going short on one pair of Indices (TQQQ,QQQ) happens and shorts cover on SPY. Then we'll have a decent move up and then another move down. No idea about timeframes yet. This one is difficult to quantify. Obviously sideways for the market means downwards for GME, so... yeah.