15% for MEME soonMEME is showing strength as market is bullish, I am expecting continuation with 15% minimum gain tomorrow.
NOT A FINANCIAL ADVICE
MANAGE YOUR RISK AND ALWAYS USE STOPLOSS
MEMEUSDT

Trend Reversal Confirmed? MEME/USDT Bulls Take ControlThe MEME/USDT chart is showing a highly compelling technical setup. Here are the key points of the analysis:
1. Breakout from Long-Term Downtrend:
Price has successfully broken above a descending trendline that has been in place since November 2024. This breakout marks a potential end to the prolonged bearish phase and opens the door for a new bullish trend.
2. Strong Accumulation Zone:
A clear accumulation zone is visible between $0.00130 – $0.00160, lasting from May through late June 2025. This zone now serves as a strong support area.
3. Formation of Higher Lows:
After the breakout, price action has begun to form higher lows — a bullish signal indicating that buyers are stepping in.
4. Potential Upside Targets (Key Resistance Levels):
The chart outlines several key resistance levels that may serve as short- to mid-term targets:
$0.001996
$0.002608
$0.003074
$0.003987
$0.004764
$0.007136
$0.010259
$0.017863
$0.018690 (previous high)
5. Bullish Scenario:
If bullish momentum continues with strong volume, price could follow the projected upward zigzag pattern and move through these resistance levels progressively.
6. Risk Management Note:
A breakdown below the accumulation zone ($0.00130) would invalidate the bullish scenario and should be watched closely.
✅ Conclusion:
MEME/USDT is displaying strong reversal signals after breaking out of a long-term downtrend and consolidating in a solid accumulation range. If buyer momentum continues, we could see significant upward moves toward key resistance zones.
#MEME #MEMEUSDT #CryptoBreakout #AltcoinAnalysis #BullishReversal #TrendlineBreakout #CryptoTrading #TechnicalAnalysis #AltcoinSeason #ChartPattern #CryptoSignals

MEMEUSDT 1D AnalysisMEME ~ 1D Analysis
#MEME Buy back gradually from here if you still have confidence in this coin with a short term target of at least 15%+ from here.

MEMEUSDT 1D AnalysisMEME ~ 1D Analysis
#MEME Buy on retest of this support block with short term target of at least 15%+ from here.

#MEME #MEMEUSDT #MEMECOIN #LONG #SWING #Eddy#MEME #MEMEUSDT #MEMECOIN #LONG #SWING #Eddy
MEMEUSDT.P SWING Long Setup
Important areas of the upper time frame for swing are identified and named.
This setup is based on a combination of different styles, including the volume style with the ict style.
Based on your strategy and style, get the necessary confirmations for this Swing Setup to enter the trade.
Don't forget risk and capital management.
The entry point, take profit point, and stop loss point are indicated on the chart along with their amounts.
The responsibility for the transaction is yours and I have no responsibility for not observing your risk and capital management.
By scratching the price and time bar, you can see the big picture of targets.
Buy Position "LONG" Spot & Future Details :
Entry : 0.002662
Stop : 0.002616 (( 1.73% ))
Target 1 : 50% Spot
Target 2 : 100% Spot
Target 3 : 500% Spot
Target 4 : 1000% Spot
Target 5 : 1500% Spot
Target 6 : 2000% Spot
Be successful and profitable.

$FLOKI/USDT BREAKOUT TRADE SETUP🚨 $1000floki/USDT Breakout Trade Setup
Massive breakout from a long-term downtrend line on the 1d chart
Price has reclaimed the 0.095–0.10 resistance zone, now acting as support.
- Entry Zone: $0.096 – $0.103
- Targets:
• TP1: $0.14
• TP2: $0.18
• TP3: $0.29 (+192% from breakout zone)
Stop Loss: $0.08686
Leverage Suggestion: 3–5x max
Clean bullish structure.DYOR, NFA

MEMEUSDT:- Pennant Breakout coming up.BINANCE:MEMEUSDT - Breakout to the upside coming up in meme once it reaches the edge of the triangle. Expecting a huge upside. Keep watching the edge of the triangle in the days to come. Thank You!

MEME Main trend -97% Channel. Reversal or scam zone.Logarithm. Time frame 3 days (less is not needed).
🟡 The price has reached a decline from the highs (not a listing squeeze) -97%. These are practically the maximums of declines after the hype for cryptocurrencies of such liquidity (96-98), after which there is only a complete scam. At the moment, there is a reaction from this zone (the lower zone of the main trend channel) (impulse buyback), and a rollback after it, which forms the canvas of a potential ascending flag. If there is a breakthrough, then locally - the implementation of the ascending flag.
⚠️🔼 These are high-risk cryptocurrencies of such liquidity (that's why such declines are big), but the percentage of price growth in them, for the same reasons (liquidity/volatility) is an order of magnitude greater in the case of their implementation. When working with such assets, observe money management.
🟣 Implementation of the flag's goals (essentially to the channel median) +80-100%
🟡 To the resistance of the descending channel of the main trend +325%
🔵 To potential highs (one of the previous consolidations) +1000-1300%.

MEME/USDT: BREAKOUT ALERT!!🚀 MEME Breakout Alert – 40%+ Potential Incoming?! 👀🔥
Hey Traders! If you're all about high-conviction plays and real alpha, smash that 👍 and tap Follow for more setups that actually deliver! 💹💯
🚀 AMEX:MEME / USDT Long Setup – Breakout Watch! 🚀
AMEX:MEME is squeezing inside a symmetrical triangle on the 1H chart and is now testing breakout levels! Get ready for a potential explosive move! 📈⚡
📊 Trade Setup:
✅ Entry: CMP and add more in dip
✅ Targets:
• Target 1 → $0.00260
• Target 2 → $0.00290
• Target 3 → $0.00302+
🛡 Stop Loss (SL): $0.00207 (below triangle support)
📌 Why this setup?
Tight consolidation near apex
Strong EMA support
Previous breakout gave ~40% move!
⚠️ Risk management is key! Wait for confirmation, and always stick to your SL.
💬 Share your thoughts below — bullish or cautious on MEME? Let’s discuss! 👇👇

MEME price analysis⁉️ Maybe #MEME is trying to start the memecoin 2.0 season?)
Before the strong resistance from above, the growth potential is 400%, but even this will not be much consolation for those who bought OKX:MEMEUSDT a year ago.
But again, in accordance with the assumption that was written a few posts earlier: coins with market caps in the range of $50-100 million are starting to “pumping”.
💰 In general, if the CRYPTOCAP:BTC price in April is kept above $79-80k (9 days left), then May may turn out to be quite generous.
_____________________
Did you like our analysis? Leave a comment, like, and follow to get more

#MEME/USDT#MEME
The price is moving within a descending channel on the 1-hour frame, adhering well to it, and is on its way to breaking it strongly upwards and retesting it.
We are seeing a bounce from the lower boundary of the descending channel. This support is at 0.001424.
We have a downtrend on the RSI indicator that is about to break and retest, which supports the upward trend.
We are looking for stability above the 100 moving average.
Entry price: 0.001452
First target: 0.001496
Second target: 0.001537
Third target: 0.001586

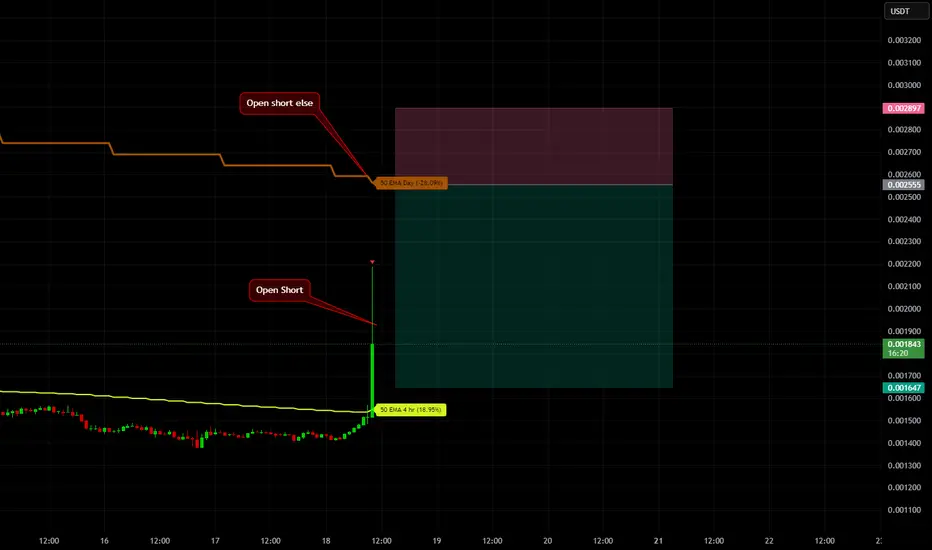
MEMEUSDT ShortMEMEUSDT had a strong breakout from the 4H EMA50 — up 23%! This setup is perfect for a short without a stop, using scaling in.
There’s a chance price might reach the daily EMA50 — if it does, I’ll add more to the short from there. The target will be adjusted based on how the 4H EMA50 moves.
#MEME/USDT#MEME
The price is moving in a descending channel on the 1-hour frame and is adhering to it well and is heading to break it strongly upwards and retest it
We have a bounce from the lower limit of the descending channel, this support is at a price of 0.00284
We have a downtrend on the RSI indicator that is about to break and retest, which supports the rise
We have a trend to stabilize above the moving average 100
Entry price 0.00309
First target 0.00334
Second target 0.00355
Third target 0.00381

#MEME/USDT#MEME
The price is moving in a descending channel on the 1-hour frame and is adhering to it well and is heading to break it upwards strongly and retest it
We have a bounce from the lower limit of the descending channel, this support is at a price of 0.00424
We have a downtrend on the RSI indicator that is about to break and retest, which supports the rise
We have a trend to stabilize above the moving average 100
Entry price 0.00442
First target 0.00460
Second target 0.00475
Third target 0.00492

#MEME/USDT#MEME
The price is moving in a descending channel on the 1-hour frame and is expected to continue upwards
We have a trend to stabilize above the moving average 100 again
We have a descending trend on the RSI indicator that supports the rise by breaking it upwards
We have a support area at the lower limit of the channel at a price of 0.00670
Entry price 0.00694
First target 0.00725
Second target 0.00751
Third target 0.00783

MEMEUSDT 4DMEME ~ 4D
#MEME This trade is high risk. But if you still have Conviction on this coin,. This is a very good support block for now,. Buy in stages with a minimum target of 20%++

#MEME/USDT#MEME
The price is moving in a descending channel on the 1-hour frame and is expected to continue upwards
We have a trend to stabilize above the moving average 100 again
We have a descending trend on the RSI indicator that supports the rise by breaking it upwards
We have a support area at the lower limit of the channel at a price of 0.00810
Entry price 0.00890
First target 0.00937
Second target 0.00990
Third target 0.01050

TradeCityPro | MEMEUSDT Potential Breakout from the Range Box👋 Welcome to TradeCityPro Channel!
Let’s dive into analyzing our coins in the current market conditions to identify potential triggers before the next move begins.
🌐 Overview Bitcoin
Before starting today’s altcoin analysis, as usual, let’s first check Bitcoin on the 1-hour timeframe. Bitcoin has finally initiated a wave, breaking through the 95753 resistance.
However, I’m not fond of the volume in these recent candles, and it needs to increase. You can consider opening positions upon entering the overbought zone.
Additionally, today saw a short-term wave with some green candles, accompanied by a decline in Bitcoin dominance. Now, as Bitcoin prints green candles, its dominance is also rising, indicating that the next wave moving toward Bitcoin’s peak might come with increased dominance.
📊 Weekly Timeframe
On the weekly timeframe, the altcoin MEME rejected the top of the range and the significant 0.01790 resistance, pushing it back toward the range’s bottom.
The buy trigger hasn’t activated yet, and this rejection has made the trigger even more critical. If you’re interested in buying this altcoin, consider adding it to your mid-term portfolio after breaking 0.01790.
If you’ve already bought at any level on this chart, it’s logical to exit and cut losses if the range’s bottom breaks. A break below 0.00997 would suggest forming new lows, so it’s better to liquidate and look for a fresh trigger later.
📈 Daily Timeframe
On the daily timeframe, following a heavy rejection from the 0.1795 resistance, MEME returned to the range, resulting in continued oscillations within this area.
We must consider that, price-wise, the market is at a logical level for buying. However, time-wise, it might range here for a while before starting a potential upward move. This makes it somewhat reasonable to take small spot risks during these days.
Based on the above, you can make a risky buy at 0.01132, with a stop-loss at 0.00861, after breaking the level. However, personally, I’ll hold onto liquidity for lower levels.
For example, if I have 30% of my funds in cash, any purchases I make here would amount to just 5% overall, assuming stop-losses are hit! For a more logical entry, I’ll monitor for a break above 0.01795.
⏱ 4-Hour Timeframe
On the 4-hour timeframe, MEME has been ranging for days within the 0.01007–0.01139 box. A breakout from either side of this range will provide a clear trigger without bias.
📈 Long Position Trigger
the rejection at the 0.01139 resistance has increased its significance. Once this level breaks, I’ll open a futures long position with a large stop-loss at 0.01.
📉 Short Position Trigger
momentum can be tracked on lower timeframes, and positions can be opened with triggers on these smaller timeframes. The 0.01 support level could be used for a small stop-loss and low-risk, quick profit management.
📝 Final Thoughts
Stay calm, trade wisely, and let's capture the market's best opportunities!
This analysis reflects our opinions and is not financial advice.
Share your thoughts in the comments, and don’t forget to share this analysis with your friends! ❤️

AIXBT/USDT Analysis – Key Levels and Potential BreakoutIn this analysis, we’ll explore the AIXBT/USDT pair on the daily timeframe (1D). The chart suggests that the price is at a critical juncture, with a strong support zone and the potential for a breakout above key resistance levels. Let’s dive into the technical details and possible scenarios for this pair.
Title: AIXBT/USDT Analysis – Key Levels and Potential Breakout
Introduction:
In this analysis, we’ll explore the AIXBT/USDT pair on the daily timeframe (1D). The chart suggests that the price is at a critical juncture, with a strong support zone and the potential for a breakout above key resistance levels. Let’s dive into the technical details and possible scenarios for this pair.
Technical Analysis:
1. Support Level:
The orange-highlighted area represents a key support zone. This level, around 0.30–0.40 USDT, has historically acted as a strong support, and the price has bounced back multiple times from this range.
As long as the price holds above this zone, the bulls may have the upper hand.
2. Breakout Potential and Uptrend:
The price appears to be consolidating below a significant resistance level. A confirmed breakout above this zone could trigger a strong bullish move.
Initial target levels after a breakout could be around 0.90 USDT, followed by 1.20 USDT if momentum persists.
3. Chart Structure:
Bullish Continuation Pattern: The chart indicates a potential continuation of the uptrend after a period of consolidation. The green and red projection lines suggest that once the resistance is broken, the price could rally strongly.
However, if the price fails to break above the resistance and drops below 0.30 USDT, a deeper correction might occur.
4. Volume Confirmation:
Watch for an increase in trading volume during the breakout. This would provide further confirmation of a bullish move.
Targets:
First Target: 0.90 USDT
Second Target: 1.20 USDT
Bearish Scenario:

"Breakout Confirmed: MEME/USDT Poised for 250% Gains – Don’t MisHere’s an overview of the MEME/USDT chart, pointing out its potential to increase in value by 250% or more in the next few months.
Important Findings
Breaking above a downward trend line.
A clear downward trendline was crossed in early November 2024, showing a change from a negative to a positive outlook.
After the price increased, it has now become steady, which means people might be gathering more before the next big change.
Important Support Points:
0. 01262 (current breakout level): This is a key level for support right now.
Below this, 0. 01200 acts as strong support, keeping the price above important low points.
Important Levels Where Prices Might Stop Rising (Target Areas):
0. 02122: The first big obstacle. If it goes above this point, it could start a big rise.
002500: The next goal after breaking out, which is the same as the last highest point.
003311: A medium-term goal that matches earlier supply areas.
004732: This is the last key resistance point, which could lead to a profit of about 250% to 300% from the current price.
MACD Analysis: Understanding MACD is about looking at two moving averages to help predict the price trends of a stock. It can tell us when to buy or sell by showing the momentum of price changes.
The CM_Ult_MACD and MACDRe indicators suggest that momentum is slowing down and may start to go up soon.
When the histogram shows positive divergence and the red bars are getting smaller, it might mean that there is a chance for more upward movement in the market.
Amount and Market Setup:
The amount of trading seems stable after the price went up, showing that the market is settling down.
A big increase in trading activity when prices go up can show that investors are interested and that the upward trend will keep going.
Story of Investing for Medium-Term Profits
Technical Breakout Setup: The price has moved up from a long period of decline and is now settling down, which suggests that people are starting to buy more.
Risk-to-Reward Ratio: There's a small chance of losing money at the support level of 0. 012, but there's a big chance to make money, reaching between 0. 03311 and 004732
250% Target Reason: The main resistance points match up with past price patterns and show a slow return to a positive trend.
Planning When to Start and Stop:
Start buying at a price around 0. 01239 to 001262
Stop-Loss: Under 0. 01200 (a solid support area).
Profit Goals:
0. 02122 (Goal for the short term: about 75% increase)
0. 03311 (Goal for the middle of the term: about 150% increase)
0. 04732 (Goal: about 280-300% profit)
This chart setup provides:
Low risk with a clear point to stop losses.
Big chances for profit with possible returns over 250%.
A clear confirmation of a breakout and positive MACD signals are boosting confidence in continued price increases.

Top Reasons to Buy Simon’s Cat Token Meme CoinWelcome to the purr-fect intersection of memes and crypto: Simon’s Cat Token! As we leap into the end of 2024, digital currencies are evolving faster than ever, and among them stands a true contender that combines humour with investment potential. Imagine a world where your love for adorable feline antics can also lead you toward financial gains—sounds enticing, right?
The daily timeframe is trending up. New daily demand levels are being created and respected. A new imbalance is being created. Watch the video below to learn more about Simon’s Cat Meme Coin projections for 2024 and 2025. Let's see if it drops to the new daily imbalance being created at 0.000044.

memeI think you can check the green box for buying and if there is support in the green box, it can grow to the red box.

HODLE BASKEThello friends
This coin gave a buy signal and we informed you.
After defeating your resistance, it's a good situation...
We have specified the entry steps for you and don't forget capital management.
Be successful and profitable.
