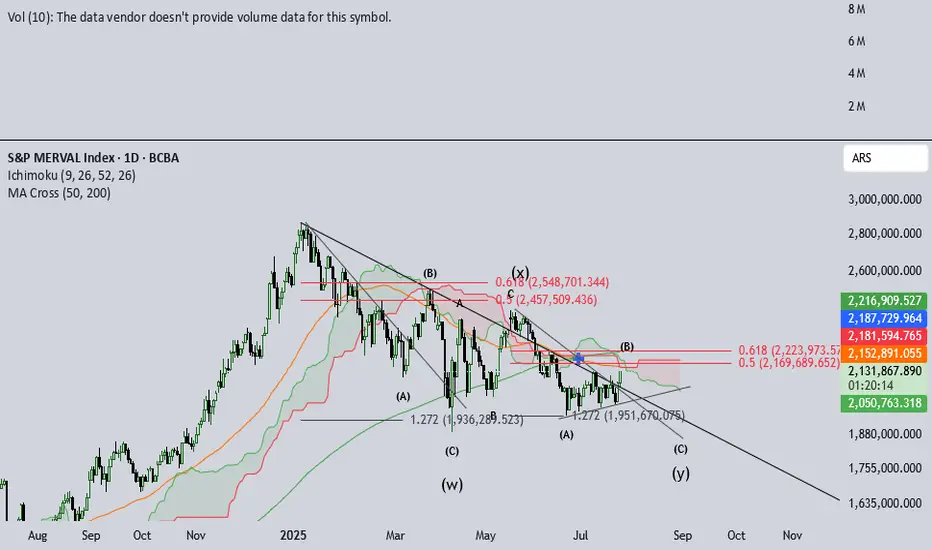
IMV Multiple analysisIMV, Argentina's Merval Index valued in pesos, has been in a downtrend since jan-25. Due to electoral process, noise has been increasing this last week, amidst some shade on what seemed as an easy win for Milei's gov.
The amount of chatter the Merval has brought up is inmense. This psychology is similar to that expected in IVth elliott's waves. Also, jul 2022 - dic 2024 saw huge gains, signaling IIIrd elliot´s wave behavior.
This long and extended IVth can be seen after such huge rallies. Anxiety begins to build up and retail investors begin to be shaken out. This IVth wave seems to be a triple-three type. Volatile and fast, this structure destroys an investor's patience.
Recent developements in the money market seem to have calmed down and peace seems to be partially restored. September elections are around the corner and this little Pax may be threatened.
I'm inclined to believe NOTHING WILL HAPPEN in these elections the govt faces, nor will the gov succeed enourmously, nor will it fail badly. So, I believe the index will likely test previous (W) wave bottoms, to then breakout for a final Vth wave. This analysis is compatible with a triangle-shaped breakout.
Merval


LOMAActualmente posible formacion de HCH al que habra que estar atentos si se confirma o no. La figura tuvo ya una formacion leve dentro del canal durante jul/ago, pero con escenario totalmente distino al actual, en donde la cuarentena estaria por llegar a su fin en ARG y en donde la actividad constructora esta presentado moderados signos de recuperacion. Siendo optimistas, podriamos esperar un rebote en el 0.618 de Fibonacci para esperar nuevos maximos.
Se aceptan comentarios. Slds


encontro piso?podemos observar que esta en un soporte. podra disparar?
yo voy a esperar una suba y luego un retroceso para asegurar una nueva entrada.
por ahora la veo lateral y no es seguro para mi

NYSE:GGAL - La nave insignia del Merval en problemasNi las buenas noticias de la renegociación de la deuda parecen hacer reaccionar al título más importante del mercado argentino. A punto de perder el canal alcista que empezó a construir luego de la caída por la pandemia del COVID-19. Es importante que defina soporte en la zona de 9.74, aunque el aftermarket del 11/9 la ubicaban ya en 9.72. De no mostrar reacción en los primeros días de la semana del 14/9, para al menos definir una nueva tendencia lateral, podemos esperar bajas hasta la zona de 7.82

EDN - EDENOR HEADING TO THE ROCKET STATION!!! VARIOS TRADERS COINCIDIMOS EN QUE A LARGO PLAZO ESTE PAPEL DA FRUTOS...
SERA EL MOMENTO DE ENTRAR??? OPINIONES SE BUSCAN!
AS MANY TRADERS AGREE, THIS STOCK WILL PRODUCE GREAT PROFIT IN THE LONGTERM
IS IT THE RIGHT TIME TO INVEST??? COMMENTS REQUIRED!

TGLT - What's this figure?Apart form the surely artificial rally from late July 2020, TGLT is describing a perfectly symmetrical figure, which begins from January 2020. What is it? I don't know: maybe some kind of reversal double-headed & shoulders... If so, would price sink up to ARS 5,00? Better wait no confirmation!

IRSA - Triangulo descendente anticipa caida de la cotizacionInversiones y Representaciones Sociedad Anónima (IRSA) formando un triangulo descendente, con base en los ARS 43, y objetivo de precios en el soporte de ARS 38,50. la figura se confirma con la caida en volumen de operaciones, asi como también la tendencia del histograma MACD y la debilidad del Demand Index

#MERVALRompió el megáfono, impulsado por noticia de arreglo en reestructuración de deuda. Hizo pullback al ahora soporte previo.. de aquí veremos

LOMAEn el caso de que vuelva a 102 se podría presentar una gran oportunidad de compra, en caso de romper el máximo anterior probablemente entre en un rally alcista impulsado por fundamentales como que el gobierno buscara una reactivación económica por medio de políticas keynesiana y por un aumento de la inversión privada en el desarrollo inmobiliario debido a los precios baratos de construcción en dólares

BMA - Reaching top limit within ascending wedge formationBanco Macro SA (BCBA: BMA) is about to complete an ascending wedge formation. From its current ARS 253, its target is most likely to be between ARS 239 and ARS 234, as several support contacts have been tested there.

SAMI - Head and shoulders confirmationSan Miguel S.A (SAMI) Is about to confirm a head and shoulders formation. After a tremendous price sinking, the only way now is upwards, but not that up: With some luck prices will recover up to ARS 142 before decreasing up to who knows at which price.

TXAR - Rebound within flat bottom wedgeToday Ternium Argentina (TXAR) began its way up towards its next resistance within its wedge, located around ARS 35. It can be noticed a substantial difference between selling and buying volume, being the former the most significant. Stoch RSI is 5/10, MACD is still depicting a downwards trend, and Momentum has reached its lowest level since COVID-19 market meltdown in mid-March.
Strategy: Do not buy this stock, and if you already own it, sell it when reaching a price between ARS 35 and ARS 36.

BMA: Aiming towawrds its next short-term resistanceThe chart analyses the current trend of BMA (Banco Macro SA), taking into account MACD, Stoch RSI, and Momentum. The stock is thriving to reach to its next price milestone around ARS 256. As noticed by the green circles, the stock tried to set a new baseline on this value: May 12, March 05, and December 19 of 2019, and today July 13. However, indicators show more potential this time, as volume is increasing steadily, RSI though high has not yet reached 100/100; MACD has not yet reached 3.560, as it is currently at 2.600; and Momentum is almost at its resistance of 18.200.
I'd suggest waiting until prices get to about ARS 255, and re-evaluate the situation: mind that prices right now are highly volatile and related to the news about sovereign debt.

AR:PATA - Signs of breaking current bearish trendImportadora y Exportadora Patagonia (PATA) shows signs of starting its way up. RSI, MACD and Momentum are increasing at a moderate rhythm, but most importantly prices are about to escape from the downward channel that began after May 04 (ARS 43,00). The current RSI, MACD, and Momentum values depict an interesting point of
There are some resistances to consider: In regards of pricing, the first resistance is around ARS 36,50, confirmed with five contacts. If surpassed, ARS 38,00 should be considered. MACD +0,40 and Momentum +2,80 should also be considered as a sell signal.

AR:CVH Reaching maximum within rectangular channelThe chart analyses an imminent bearish trend for Cablevision Holding (AR:CVH) stock, as prices are near the top of its rectangular, parallel channel. As can be seen in the chart, after an interesting bearish trend, the stock got into a rectangular channel, peaking un ARS 478 on June 08. In that occasion, RSI reached 85/85, MACD reached +5.30, and Momentum reached +61,00, with MACD curves depicting a bullish trend four days after crossing each other.
Current stats show RSI 98/94, MACD +5.60, and Momentum reaching +90,00. Considering this, and noticing that prices are near its resistance line, I believe that it is almost the time to sell, and by no means to buy.

AR:BMA Strategy for July 07 and July 08The chart analyses short-term pricing after comparing a 21 EMA bullish trend, 30/50 RSI values, and MACD trends immediately before changing its convergence to overselling, considering moderate volume. These conditions were met seven times between 2016 and 2020, with an average of 15,57% increase in stock price within a span of 9 days on average. In the current case, the starting point is set on 30 June ($198) and ending July 8, before Argentina's Independence Day (July 9 and 10 are free days).
I'd suggest selling immediately after the market opens on July 07 (and rebuying when price reaches around $228 on July 08). The current price ($238) could be a consider a resistance, as prices have dropped from there two times before (see orange circles).

SUPV SEGUIMIENTOARRIBA EL CANAL "DANGER", ABAJO EL CANAL "COHETE".
PARTICULARMENTE DADO EL CONTEXTO NACIONAL DE TERRIBLE EMISION Y DESCONTENTO SOCIAL IRA A BUSCAR EL CANAL "COHETE".
ANALIZADO SEMANAL LOG.
VAYAN PREPARANDO LAS RESERVAS PARA GATILLAR. LA COSA SE PONE LINDA.
NYSE:SUPV

Analisis de largo plazo y corto plazo bolsa dólares ArgentinaAquí la segunda parte del análisis del largo plazo de argentina recordar ver mis gráficos del twitter para entender el anàlisis..

merval en dólares análisis largo plazoEl merval en dólares de largo, rebote o cambio de tendencia, creo que es más bien rebote niveles claves primera parte

