Mid-Week Outlook Update: US CPI- Trade TalksCPI day today. Scheduled to be released at 7:30 AM CT.
CME:6E1! CME_MINI:ES1! CME_MINI:NQ1! CME_MINI:MNQ1! CME_MINI:MES1! COMEX:GC1! CBOT:ZN1!
ES futures edged slightly higher after positive commentary from US-China trade talks. The delegations from both sides agreed on a framework to move forward with negotiations.
It is important to note that Trade War 1.0 took about two years to formalize and finalize. However, given the previous experience and the current agreement on the framework, our opinion (which is not the consensus) is that the trade deal between China and the US may be closer than what most analysts and investors might otherwise predict.
Like any negotiations, China and the US have previously discussed these difficult issues and have found a way to resolve them. Although the concerns have shifted towards niche sectors, we still view baseline tariffs with some sectors seeing increased tariffs as likely.
TACO (Trump Always Chickens Out) acronym traders will see a tougher stance from Trump to resolve the overarching trade deficit issue with China, particularly the dumping of Chinese goods.
AI, defense technology, chips, and rare earth minerals are at the center of these discussions. There will be targeted controls on exports of chips from the US and exports of rare earth minerals on the Chinese side, despite the current framework and deals agreed. In our view, these controls will be phased out until agreements are finalized, to maintain leverage and show TACO acronym backers that Trump is not “chickening out,” but rather maintaining a strong stance while negotiating trade deals with China and other countries.
In our analysis, despite positive headlines, the overhanging uncertainty has not dissipated. In fact, there is clarity that President Trump is willing to take the difficult road to negotiate from an apparent position of strength. Would this result in extension of trade deadlines or temporary increase in tariffs followed by an extension of deadlines? This remains to be seen!
If May CPI comes in lower than expectations, this will be a nudge in the direction that tariffs are not translating into higher inflation. We may see a rally in index futures.
On the contrary, any increase in CPI above the previous 2.3% YoY increase will be seen as tariff-induced inflation.
In our analysis, given lower energy prices, rent inflation stabilizing at levels last seen in late 2021, and services inflation in the US trending lower from the peak in January 2023, we are seeing embedded inflation in the prior two months and this may remain sticky in today’s release. However, any stability with lower energy prices seen in the prior month will point to a lower inflation print overall.
Comment with your favorite trade idea from our past trade ideas and what you would like to see more of.
MES1!

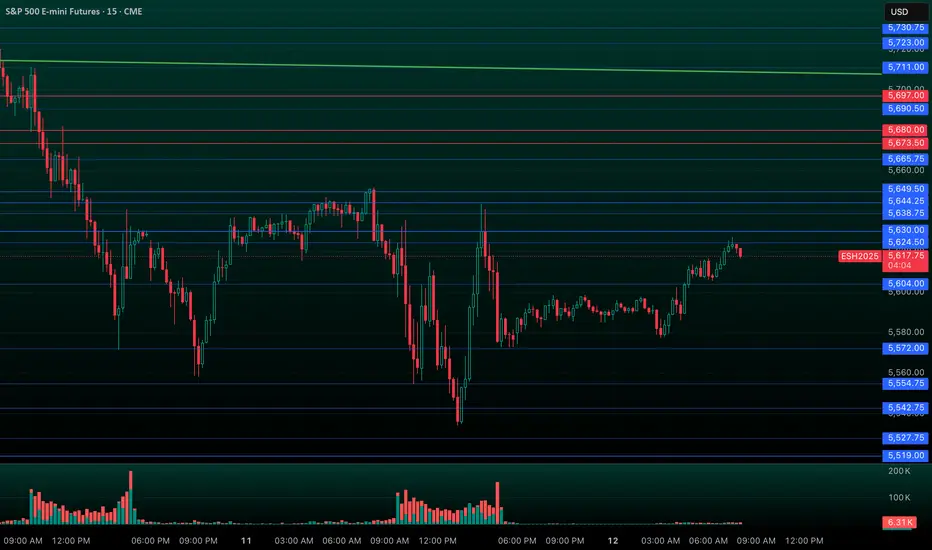
ES Trade Idea and Upcoming NFP ReportCME_MINI:ES1!
• What has the market done?
ES futures are lagging compared to tech heavy index NQ futures. ES futures are still below yearly open. Yearly open has been a strong area of resistance since the rally of April 6th Lows in futures complex.
• What is it trying to do?
ES futures are in consolidation mode, building value higher. VPOC has shifted higher since the gap up from May 11th open. VPOC and 0.786 fib level provide a base for a continuation higher.
• How good of a job is it doing?
Markets seem to be slowing its rally. After such a strong rebound, participants are wary of any pull-backs. Although a strong trend higher, consolidation or a pullback is not illogical at these levels.
• What is more likely to happen from here?
o Scenario 1: Hold steady and NFP provides needed boost for markets to get across yearly open resistance and climb higher.
o Scenario 2: A mixed NFP report may point towards further consolidation. Key level 5873 as support on move lower before reverting higher.
o Scenario 3: A hawkish NFP report that signals higher for longer rates, may be interpreted by market participants as less monetary stimulus and dwindling rate cut bets for this year. We anticipate a sell-off towards 0.618 fib level in this scenario, moving to the lower edge of micro composite volume profile.
In all the above scenarios, there is a clear LIS at yearly open. Other key levels are defined cleanly on the higher time frame. Important thing for traders to note here is to trade what you see and not what you think. Having an alignment between fundamentals and technicals is sound but the markets do what they do, and price moves where it should. Painting narrative to any move may sound fancy but it gets less important at intraday time frames in our opinion. Hence why we view all this considering auction markets and volume profile.
Glossary:
ES - emini-S&P 500 Futures
NQ - emini-NASDAQ 100 Futures
VPOC - Volume Point of Control: The most traded price by volume in a given range. Represents acceptance or consensus
NFP - Non-Farm Payroll: Released by the US Department of Labor around the 1st Friday of every month. It reports on Unemployment, Productivity and other key metrics. Key economic release
LIS - Line In the Sand: A key zone that might tip buyers or sellers to act to cover risk and might change the overall bias of our analysis

MES1!/ES1! Day Trade Plan for 05/06/2025MES1!/ES1! Day Trade Plan for 05/06/2025
📈 5625 5638 5650
📉 5614 5602 5590
Thanks to all my followers! Truly appreciate the support!
Please like and share for more ES/NQ levels Tues & Thurs 🤓📈📉🎯💰
*These levels are derived from comprehensive backtesting and research and a quantitative system demonstrating high accuracy. This statistical foundation suggests that price movements are likely to exceed initial estimates.*

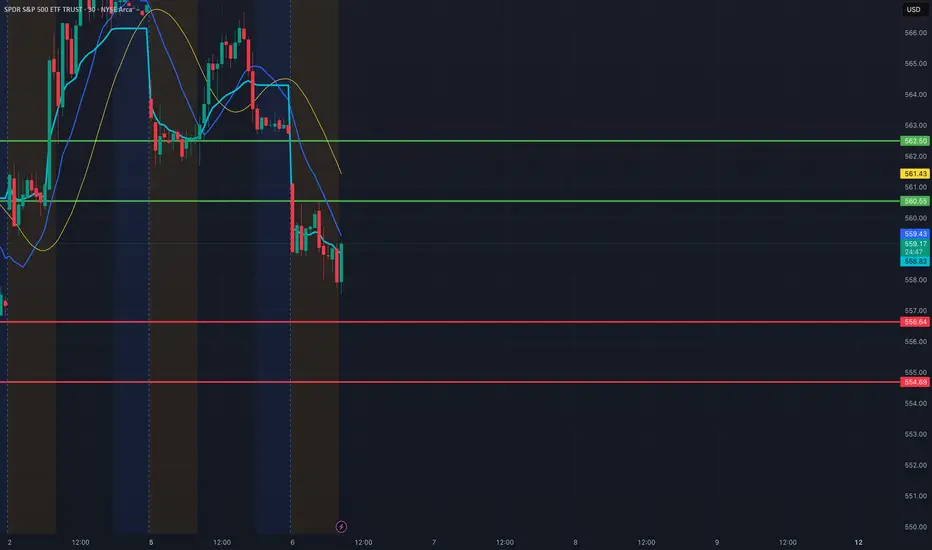
SPY Day Trade Plan for 05/06/2025SPY Day Trade Plan for 05/06/2025
📈 560.55 562.50
📉 556.64 554.69
Thanks to all my followers! Truly appreciate the support!
Please like and share for more ES/NQ levels Tues & Thurs 🤓📈📉🎯💰
*These levels are derived from comprehensive backtesting and research and a quantitative system demonstrating high accuracy. This statistical foundation suggests that price movements are likely to exceed initial estimates.*
SPY Day Trade Plan for 05/01/2025SPY Day Trade Plan for 05/01/2025
📈 562.70 565.60
📉 557 554.30
Thanks to all my followers! Truly appreciate the support!
Please like and share for more ES/NQ levels Tues & Thurs 🤓📈📉🎯💰
*These levels are derived from comprehensive backtesting and research and a quantitative system demonstrating high accuracy. This statistical foundation suggests that price movements are likely to exceed initial estimates.*

MNQ1!/NQ1! Day Trade Plan for 04/29/2025MNQ1!/NQ1! Day Trade Plan for 04/29/2025
📈 19560 19685
📉 19185 19060
Thanks to all my followers! Truly appreciate the support!
Please like and share for more ES/NQ levels Tues & Thurs 🤓📈📉🎯💰
*These levels are derived from comprehensive backtesting and research and a quantitative system demonstrating high accuracy. This statistical foundation suggests that price movements are likely to exceed initial estimates.*

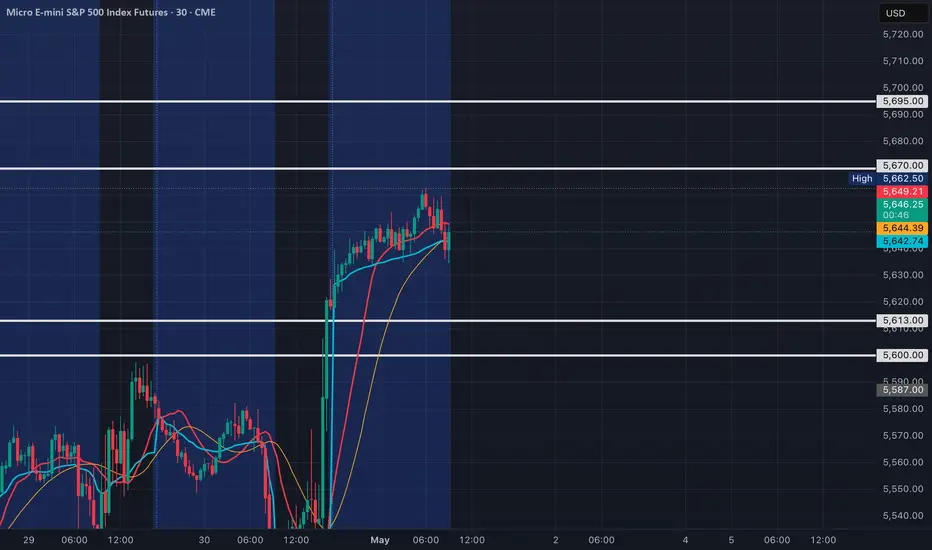
MES1!/ES1! Day Trade Plan for 05/01/2025MES1!/ES1! Day Trade Plan for 05/01/2025
📈 5670 5695
📉 5613 5600
Thanks to all my followers! Truly appreciate the support!
Please like and share for more ES/NQ levels Tues & Thurs 🤓📈📉🎯💰
*These levels are derived from comprehensive backtesting and research and a quantitative system demonstrating high accuracy. This statistical foundation suggests that price movements are likely to exceed initial estimates.*
MES!/ES1! Day Trade Plan for 04/29/2025MES!/ES1! Day Trade Plan for 04/29/2025
📈 5555 5580
📉 5500 5475
Thanks to all my followers! Truly appreciate the support!
Please like and share for more ES/NQ levels Tues & Thurs 🤓📈📉🎯💰
*These levels are derived from comprehensive backtesting and research and a quantitative system demonstrating high accuracy. This statistical foundation suggests that price movements are likely to exceed initial estimates.*

MES!/ES1! Day Trade Plan for 04/25/2025MES!/ES1! Day Trade Plan for 04/25/2025
📈 5530 5560
📉 5475 5445
Thanks to all my followers! Truly appreciate the support!
Please like and share for more NQ levels Tues & Thurs 🤓📈📉🎯💰
*These levels are derived from comprehensive backtesting and research and a quantitative system demonstrating high accuracy. This statistical foundation suggests that price movements are likely to exceed initial estimates.*

MES1!/ES1! Day Trade Plan for 04/23/2025MES1!/ES1! Day Trade Plan for 04/23/2025
📈 5512
📉 5440
Thanks to all my followers! Truly appreciate the support!
Please like and share for more NQ levels Tues & Thurs 🤓📈📉🎯💰
*These levels are derived from comprehensive backtesting and research and a quantitative system demonstrating high accuracy. This statistical foundation suggests that price movements are likely to exceed initial estimates.*

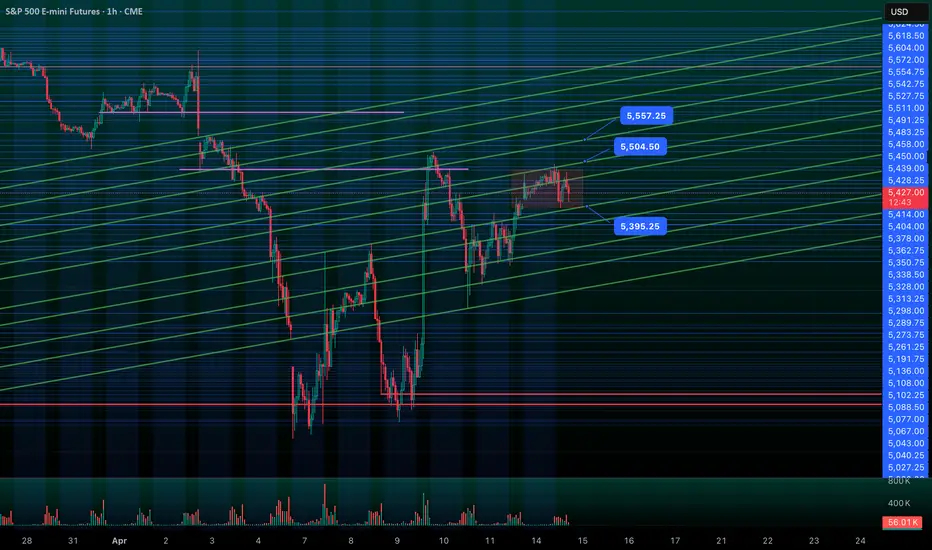
Fibs to Watch For Traps - ES/MESNew fib channels to keep your eyes on for ES and levels I will be eyeing for the next few weeks or so.
MES!/ES1! Day Trade Plan for 03/18/2025MES!/ES1! Day Trade Plan for 03/18/2025
📈5740. 5760
📉5680. 5660
Like and share for more daily ES levels 🤓📈📉🎯💰
*These levels are derived from comprehensive backtesting and research and a quantitative system demonstrating high accuracy. This statistical foundation suggests that price movements are likely to exceed initial estimates.*

ES Morning Update March 18thYesterday, the plan for ES was straightforward: rally to ~5755 (adjusted for the June contract, previously 5703 on March) to back-test the 3-month megaphone breakdown from last Monday. The market followed through with an 88-point rally to that level before selling off.
As of now:
• 5720 (reclaimed) and 5698 are key supports
• Holding above keeps 5739 and a second test of 5754 in play
• If 5698 fails, look for selling pressure toward 5668

MES!/ES1! Day Trade Plan for 03/17/2025MES!/ES1! Day Trade Plan for 03/17/2025
📈5660. 5680
📉5600. 5580
Like and share for more daily ES levels 🤓📈📉🎯💰
*These levels are derived from comprehensive backtesting and research and a quantitative system demonstrating high accuracy. This statistical foundation suggests that price movements are likely to exceed initial estimates.*

ES/MES Prediction 3/17/25 = +$2725 1 ContractIf you're trading MES, Its 1/10th of the $$$.
Example: 1000 on ES is 100 on MES. 😎🫡💰
3/17/25: $2,725 in 1 hour....minimum 😤🔥🫡
Levels are provided DAILY prior to market open. Like and follow for more insight 🫡💰🔥

MES!/ES1! Day Trade Plan for 03/14/2025MES!/ES1! Day Trade Plan for 03/14/2025
📈5600 5640
📉5560 5520
Like and share for more daily ES levels 🤓📈📉🎯💰
*These levels are derived from comprehensive backtesting and research and a quantitative system demonstrating high accuracy. This statistical foundation suggests that price movements are likely to exceed initial estimates.*

ES Morning Update March 14thYesterday was all about 5558 in ES. After a drop to 5512 support, bulls needed to reclaim 5558 for upside. That level was tested twice before a sell-off, but once it cleared at 8:30 PM, buyers stepped in, pushing the market +20 points higher.
As of now:
• 5598, 5615 are the next upside levels as long as 5558 (now weaker) holds
• A break below 5558 opens the door for a drop to 5548, then 5533

ES Morning Update march 13thThis week has revolved around one key level in ES: 5568-72, which has been lost and reclaimed four times. At 11:20 PM yesterday, it triggered a long setup from an a textbook failed breakdown, leading to a 65+ point rally—and overnight, the same pattern repeated again.
As of now:
• No change—5568-72 remains weak support
• A 5599 reclaim sets up a move to 5616, 5643+
• If 5568 fails, expect further downside

ES Morning Update March 12thSince I prioritize Failed Breakdowns, my job is pretty simple—do absolutely nothing until we get one. This is how you keep an incredibly high wind rate, while easily scaling your accounts. Yesterday, the 5569-72 reclaim triggered the long setup, leading to a 70+ point rally to the 5608 target, where we’re still holding.
As of now:
• 5599, 5569-72 must hold through CPI volatility to keep 5645, 5668, and 5703 in play
• A failure below could open up more downside
ES Morning Update March 11thYesterday marked the largest red day in ES since the August 5 capitulation low. After deep sell-offs, squeezes typically come from my core setup: The Failed Breakdown—which triggered at 9:30 PM, now up +75 points, as outlined in the plan sent out yesterday evening.
As of now:
• Hold the runner
• Next targets: 5668, 5688, 5703
• If 5628 fails, expect a dip to 5609 first

ES Morning Update Mar 10thFor the last three days, 5720 has been the key battleground in ES—testing, bouncing, breaking below, squeezing, and repeating. After another bounce to the 5764+ target on Friday, we’re back under it again.
As of now:
• Same setup: 5720 must reclaim to target 5745, 5763
• If 5700 fails, expect a dip to 5676 first

ES Morning Update March 7thES has been revolving around 5757-63, acting as a key magnet. It held as support in the morning, leading to a rally toward 5822, but once it failed in the afternoon, the market sold off to the 5725 target. Now, NFP will dictate the next move.
As of now:
• 5763 must recover to target 5777, 5794, and 5822
• On an NFP flush, 5714 and 5700 must hold to prevent deeper downside

MES!/ES1! Day Trade Plan for 03/06/2025MES!/ES1! Day Trade Plan for 03/06/2025
📈5798 5818 5838
📉5759 5739 5719
Like and share for more daily ES/NQ levels 🤓📈📉🎯💰
*These levels are derived from comprehensive backtesting and research and a quantitative system demonstrating high accuracy. This statistical foundation suggests that price movements are likely to exceed initial estimates.*
