META Long position. High price fall, but lower revenue from CFDuring the recent price fall in the share price of META, there may be a good entry point for a long position; 6 months and beyond. If revenue keeps reducing from cash flow (CF), one should wait for a lower entry point, or consider a short position.
Meta

buy into metaLike it or not! There are not many places advertisers can go! And if you don't believe in digital advertising or if you don't believe our lives are affected by the digital world then you can go buy Mall/retailers stocks. but for the people who believe that more of our decisions and influence will involve in the digital space, then META is the only place to be!
Recessions wont last forever, and sooner rather then later, people will still buying again. Where are the advertisers going to go? lets see
1) APPLE - but they have already been identified as having a monopoly, and the war with Elon Musk could give regulators the catalyst to look into their advertisement business! Its unlike Apple will push further into this category, they need to protect their iOS phone business and wait to grow their area when they get the Apple glasses ready.
2) TikTok - no doubt, it is capturing eyeballs and market share. But is it capturing advertisers? Probably not, I think American companies have learnt from Russia and they will not want to make investment in a platform that may become banned if the US escalate things with China. Capturing eyeballs, but not capturing advertisement business.
3) SNAP - Probably a trojan horse, it is ahead in the AR business, but if they can get their act together around hardware and bring out a worthy SNAP glasses we could see some pivots from advertisers and brands! But its more of a co-existence with META rather then direct competition
4) Google - As big as their search engine business is, their other business is completely hopeless! They are nowhere on messaging, I would say their messaging app strategy is a mess, its not co-ordinated with google maps, google search or Youtube! How hard is it for retailers to message you if you clicked on one of their ads or watched an video ad or searched for direction on google maps! They know everything about you, but they fail to execute, maybe because like Apple, they are worried about regulators and want to protect their search business at all cost.
5) Pinterest - Probably a nice grower, but you have to put alot of time and investment into this to take advantage. Its less of an impulse buy but protected from Apple's privacy protection.
Unless there is a re-platforming (ie death of the mobile platform), the most common social media/messaging/commerce platform on everybody's phone is owned by META, and this category is still growing, it has only been around for less then 10 years, and probably has another 10-15 years of growth left. When the bull-market starts raging again, the advertisers will come out in force to push their products into META and SNAP!
META probably has another 5-10 years of growth left, easily to double or triple your money...

META - my oculus sees a gap fill Gaps get filled. Green arrows show latest dip buys filled the gap from the mass sell off. My red arrows show potential gap fills to equalize this out.
Entered PUTS late in the afternoon in anticipation of a gap fill to the downside and seeing the post market dip as well as nice candle Pin off of the 20ma (red line) on the daily gives me a solid indication of where the METAverse is headed in the next few days. The is not investment advice just another one of my crazy ideas…. trade at your own risk.
Will I put dinner on the table with this trade? Like and follow to find out!! Yehawwwwww traders!

#META 4hr chart reversing off bottom of channelMeta seems to be reversing off the bottom of the channel which has held meta price action lower since the February gap down on results. This reversal is coinciding with news that the FCC boss mentioned that the US Should ban TikTok - widely known to be one of facebooks fiercest competitors in the space. Let's see if we can get some follow through on this move..

Short entryPossible false break on the downtrend at the 50 SMA & resistance, waiting for confirmation.
Would be eyeing the gap fill + launch or a retest of the lows. (depending on market conditions)

FUTURE META MOVEMENT ( BUY )Depends on the previous movements of the chart and recent meta activities we can notice
- the strong short movement is coming to and end due a recent push in buying power
- the crossing in the purpel hma indecatore
- good support pressure
- best move : wait until the price crosses the yellow hma indicator and go in as buyers

Financial Wave. META-FacebookIt became interesting for us to consider the state of Meta. Unlike Twitter, Meta's outlook looks pessimistic.
Our preferable scenario is the continuation of the downtrend, the price may rebound to the range of $190-250, after which the downward movement will continue. The fall may resume without a rebound, the target level is $60. In case of growth above $250, the downward scenario will be cancelled.

buy fb (meta)Inverse head and shoulders here on meta.
Buy ahead of breakout above
See earlier post for more info on my meta long trade

Meta keeps dipping!Meta is already down %77 from the top and it still seems bearish as long as it’s trading below $117. The next crucial support is at $57 which is the ultimate support and the potential bottom for this bear market in my opinion.

META Facebook/Meta - Too Much Bear, Not Enough BullPersonally, I have only low opinions of Facebook, for it exists really as a big data collection hub. A lot of tracking cookies just traffic your browsing history and information back to their servers, whether you have an account or not, for AI analysis and surveillance.
And then there's the Metaverse, which Mark Zuckerberg and Communist Party Global are so delirious that they think you're going to spend your 40 hour work week with a 10 pound Oculus Rift bolted to your face while you lay on the floor in your pod covered in blankets with your heat restricted by the Communist Party Central Planning Committee to 18C eating the bugs as they scream "climate crisis" and "energy crisis" while showing off in their private jets, feasting on cows.
All commentary on the state of affairs of the company and the disastrous direction the Metaverse vaporware has taken it aside, I'm a price action trader, and when it comes to Meta, which is a keystone of the Nasdaq, you just have to have your interest piqued when something has dropped as much as this boat anchor has.
Notably, in the last 2 months and 4 days alone, Meta has lost 76% of its value.
Just look at this monthly:
With stocks, these types of doom gaps rarely seem to present a real buying opportunity to capture a retrace with. This is demonstrated in Meta on the weekly, which shows literally 8 consecutive losing weeks, with pretty much no bounce at all.
In the last two weeks alone, from the broken low to the bottom was another 28%.
Looking at the daily, we can see that the post-earnings dump just literally went straight down in a straight line.
This is the definition of "oversold," really. But as any seasoned trader who has burned their hands will tell you, something being oversold does not make it a buy, for that oversold indicator can snake on the floor for a lot longer than you can stay solvent before finally recovering.
Yet, we get to a key juncture that gives us a situation that certainly piqued my interest tremendously.
Not only has Meta dumped another $10 in the first trading days of November already, but it made a very weak high on the first and has since traded below a key pivot low from 2016.
Additionally, price action on Non-farm payrolls Friday showed Meta crush through a short term double bottom and then reverse.
To me, all the stars have aligned and all the conditions precedent for bears to get #rekt are present.
Going long here means you have a $7 upside just to the November high. That November 1 high will not be the high of the month for Meta. You can pretty much set your watch to that. At some point, they will rip it past it and clear out the shortsellers and bring in rally chasers, for sure.
Better yet, trading back to the post-earnings gap down to rebalance the range produces a $12 upside.
If Meta trades back to range equilibrium of the up candle before the earnings dump, your upside is $25.
A key point here is the area above $120 is a high resistance range on the weekly. If Meta starts to trade in here, especially if it doesn't reject hard, the upside can be significantly higher.
You might think that there's no way it could happen, but there's always some latent "news" driver that has been arranged to power the bear guillotine and bring the FOMO in.
The key point with trades like this is to manage your risk. Don't be too greedy. Take profits. Be patient. Give up if it won't pump.
But don't bottom short and make yourself a dead bear, either. If Nasdaq does what the Dow just did during election week next week, a lot of people's bottom puts are going to expire worthless while those short on margin are going to get gap up on open liquidated.

META Can cutting 11000 jobs reverse the bearish outlook alone?The news of a 11k jobs cut had an immediate bullish impact on the Meta Platforms Inc (META) stock, helping it break above the 100.00 barrier again. Today's much lower than expected CPI number is also adding fuel on this rally but can those alone push the price out of the death spiral it has been since January in particular?
Well technically the November 03 drop made a Lower Low on the Channel Down pattern that Meta has been trading in since the February 03 collapse. Taking also into account the massive rebound below the 30.000 1D RSI oversold zone, the price can target the 1D MA50 (blue trend-line) by the end of this month. Beyond that, only a closing above the 1D MA100 (green trend-line), which is unbroken since December 30 2021, can turn the trend bullish.
As you see, the November 03 bottom was made on the January 20 2016 Low (89.25). The next Support is the August 25 2015 Low of 72.10, so we will be ready to short this and if broken then 60.00.
-------------------------------------------------------------------------------
** Please LIKE 👍, SUBSCRIBE ✅, SHARE 🙌 and COMMENT ✍ if you enjoy this idea! Also share your ideas and charts in the comments section below! This is best way to keep it relevant, support me, keep the content here free and allow the idea to reach as many people as possible. **
-------------------------------------------------------------------------------
You may also TELL ME 🙋♀️🙋♂️ in the comments section which symbol you want me to analyze next and on which time-frame. The one with the most posts will be published tomorrow! 👏🎁
-------------------------------------------------------------------------------
👇 👇 👇 👇 👇 👇
💸💸💸💸💸💸
👇 👇 👇 👇 👇 👇

META short squeeze pop expectations by 11/11/22, options playThis is an options play with higher reward. We all know that META has be absolutely obliterated this year. I'm not a long term bull on META but earlier in the year NFLX got crush after earning and then roughly a week later it popped really hard. Kinda expecting that to happen here on META. I did try this play this week, but its not going to work out; probably just too quick on it. But it is a high reward play with options, so if it works then easily recoup last weeks losses as well. So I'm gonna look for the 98/99 Bull call vertical for 11/11/22 as they are roughly 0.10/share ($10/contract); price probably gonna be different for when you see the prices. Max value for the bull call vertical would be $1, so plenty of room if META pops to take profits at 0.30, 0.50, or 0.70 if you don't want to hold until expiration.

The 1.1 Trillion Dollar Penny StockI have three major principles in my life. The first is the Golden Rule, the holiest of all rules. Treat others the way I want to be treated. The second major principle is "holla holla get dolla", which is a really fun way to say respect the hustle, respect other's choices in life. Naturally, my third is that Rome was strongest with the triumvirate. All of this to say that when I act a fool, I expect others to tell me and moderate - this is the natural evolutionary cycle of social structures. It is of absolute sociological importance for bad behaviour to be called out. Jedi Blue, Suckerberg's Metaquest to find a friend, an inability to refinance debt, the real web3.0, and the literal heat-death of Facebook's geriatric population all spell doom for an over-glorified penny stock.
First, what exactly was Wall Street thinking letting a GeoCities RSS feed for people's feelings get to a $1.1 TRILLION dollar market cap? It is difficult to explain the need for controlling health care inflation when the same economy is more than happy to offer debt to a business incapable of making a profit at valuations well into the hundreds of billions of dollars. Fine, the bubble popped. A lot of people, pensioners, and sovereign treasuries lost a lot of money. But for Facebook it's a little bit more severe. Facebook has around $10 billion in long-term debt, debt that is most assuredly used to recycling at the lowest interest rates possible garnered by free government money. What starts as a few billion recycling at ~4-6% per year starts finding draining liquidity in corporate bond markets making it hard to offer debt at 10+%. Meanwhile, real world inflation driving up operating costs for office, labour, and servers force bigger and bigger debt offerings to less and less willing parties. Advertising growth declines and degrades as advertisers suffer in recessionary markets. Plus the $10 billion in long-term debt is nothing compared to carrying $16 billion in floating accrued expenses -think cycling debt among credit cards, $15 billion in "deferred revenue"- as if renaming fake profits makes it more real, and a $7.5 billion mixed bag debt growing by $250 million a quarter. There is a funny saying that owing the bank a hundred dollars makes it your problem, owing the bank a hundred million dollars makes it theirs. Banks are reanalyzing their tail-risk models for profit and capital margins. Forgoing the mysterious $84 billion a year in revenue, Facebook burned $62 billion this year alone. A decrease in real revenue is an undertone to out of control costs that needed to be dealt with a decade ago. All of which are suddenly important.
Facebook's interdimensional turn to the Metaverse at investor expense in the billions with no plan to stop illustrates an Executive board that isn't controlling risk or managing direction. Removing Zuckerberg won't be easy, if at all possible. Facebook can change it's name all it wants, but there is one person in power. The public aren't the only ones harbouring negative feelings for Zuckerberg and his company; various US and International legal groups have been launching investigations and lawsuits against Facebook, Facebook's Directors, and Zuckerberg personally. The FTC won a $5 billion charge against Facebook in 2020 in relation to selling user's personal data. Now the FTC is against the very fabric of Facebook: Illegal Monopolization via uncompetitive acquisitions to be resolved by shedding Instagram, WhatsApp, and more. Facebook has attempted to dismiss it twice, failed on both counts, and is now pushing for a delay in trial - something unlikely to happen. Intertwine a multi-state and multi-country investigation into Google & Facebook's "Jedi Blue" collusion, research reports codifying the bad return on investments of digital ad spend, especially on Facebook, and it starts to look like a crisis of confidence in an entire business model. Google has been in a constant battle regarding it's own Monopoly and the power of pricing that comes with it, most ending with a corporate-win inside the United States. While Republicans' hatred against Big-Tech is more bark than bite, certain lawsuits in Republican-driven states pose the probability of a big loss for big brother business. However, the EU investigation into Jedi Blue is far more likely to create a material change in ad pricing. The basics are this: Facebook and Google agreed on a floor of pricing ads, thus forcing companies to pay more than in a free and competitive market. While this isn't surprising, it is illegal - making materially impactful fines and pricing changes a very likely outcome within the next few years, again all enhanced by a global recession.
Invoke the Laws of the Monthly Active Users and bequeath one billion dollars. Or just know that internally-verified MAU's are on par with Allianz SE returns. Facebook claims 3 billion monthly active unique users of whom 500 million joined since COVID in Q1 2020. The underlying growth trend shows nearly perfect linear growth from 2008 to 2020, and logarithmic post. Without the ability to predict the future, Facebook is sitting at a 1% annual growth rate over 2 years on a statistic that only they can confirm. Facebook knows growth has stalled and will turn negative, if it hasn't already, all leading up to the dramatic need for Facebook to CREATE a UNIQUE digital space to bring in NEW users. Where Facebook claims Horizon Worlds is only a $1.2 billion failure, R&D costs are up $8 billion in the same 9-month period YoY. But the failure aspect is correct, as Horizon Worlds has failed to breach 200,000 unique users with a recent investigation showing a general localized environmental userbase <50 people. This analyst won't fault the metaverse for this failure. Facebook isn't just uncool and unpopular, they are reviled in a way that only a new generation can do. If Web3.0 is about decentralization against mass-control, there are few homo sapiens lizard-people that have earned such hysterics as Zuckerberg.
One final inspection of their public accounting records leaves one final question: how much longer can Facebook run? With just under 50% of cash equivalents in corporate debt securities with an 8% unrealized loss in a year, paired to a $2.3 billion or 14% degradation of the Corporate Treasury in the past 9 months, what is the game plan? Facebook is looking at $2+ billion per year in increased costs to refinance debt at minimum, that is if they find a bid. The company has burned more on a Metaverse catering to no one, being sued by the FTC to break up the social media conglomerate completely, looking at decreased revenue, decreased value of previous revenue, and a very tangible decline in users amid a digital transformation period brought by a new generation wholly happy to cancel celebrities and companies. There is a growing probability and possibility of a failure for Facebook to maintain debt and business operations without filing for bankruptcy or modification of historic debt. Facebook is a penny stock, at least while it remains listed.
Selected References:
www.sec.gov
www.ftc.gov
www.ftc.gov
www.law360.com
nymag.com
www.chancerydaily.com
www.statista.com
kotaku.com

Meta still got downside to come to $40 JUST IN: Mark Zuckerberg has announced that Meta will be laying off 11,000 of its employees —
an estimated 13% of its workforce — and will also be taking “a number of additional steps to become a leaner and more efficient company.”
This is a clear indication that since Mark went and focused on building the Metaverse (VR and AR) that this was a risk.
We focused on building Horzons (app) and building Oculus and Metaquest. But clearly the world was not ready for this evolution.
Also with Oculus costing $299 and the new Oculus costing over $500 shows that majority aren't willing to invest in this technology or can't afford it...
I do think the Metaverse will take over one day, but only when technology becomes cheaper and the benefits outweigh the risks... Right now it's a liability to those due to a lack of education
What are your thoughts...

FAANG Performance Jan 01, 2022 - Nov, 08 2022 FAANG Performance Jan 01, 2022 - Nov, 08 2022
Apple -23.36%
Alphabet -39.02%
Amazon -47.20%
Netflix -55.90%
Meta -71.50%

$META futureNice prespective
lets me know your views
how facebook will help people experiencing meta.nice prespective and hopefully this will be future

November 9 BTCUSD BingX Chart Analysis and Today's HeadlineBingX’s Bitcoin Chart
Bitcoin's downtrend isn't over yet, which means risks remain in the crypto market. But a more optimistic scenario is that the price of Bitcoin has broken through the previous low. History does not simply repeat itself, and market bottoms are usually accompanied by significant events. High - risk insolvency events are likely to lead to stronger regulation. For market participants and exchanges, a cautious investment attitude is needed. In the short term, $18,000 remains the most important psychological line of defense for BTC.
Today’s Cryptocurrency Headline
Meta Will Begin Laying off Employees
Meta CEO Mark Zuckerberg told hundreds of executives on Tuesday that the company would begin laying off workers on Wednesday morning, according to the Wall Street Journal. Zuckerberg blamed himself, saying he was responsible for the company's missteps and overstaffing. As previously reported, people familiar with the matter said Meta is planning to begin large-scale layoffs this week. The layoffs are expected to affect thousands of employees, and company officials have told employees to cancel nonessential travel starting this week. Meta reported more than 87,000 employees at the end of September. This will be Meta's first major layoff since its inception.
Disclaimer: BingX does not endorse and is not responsible for or liable for any content, accuracy, quality, advertising, products, or other materials on this page. Readers should do their own research before taking any actions related to the company. BingX is not responsible, directly or indirectly, for any damage or loss caused or alleged to be caused by or in connection with the use of or reliance on any content, goods, or services mentioned in the article.

META Buy and Hold SetupNASDAQ:META
Meta Platforms stock stoped the downtrend, after The Wall Street Journal reported that Facebook's parent company plans to begin large-scale layoffs.
The layoffs could be the largest in a spate of tech job cuts following the industry’s rapid growth during the pandemic, with Twitter, Stripe and Lyft among the companies also reducing headcount. On a long term view this can be an interesting price for an investment.
So here an trading setup for stock and option traders:
The idea is to place one Stop Buy Order at 105 $, so when META will move in direction to gap closing we can participate from this move. If the price will go down to 80 $ I also place a stop limit order to catch a lower entry price. You can also do this when you sell a put option for the Strikeprice of 80 $. This brings you revenues of 3 % for a duration of 2.5 months.

Meta facebookHey Traders this is Meta weekly chart it falls very badly in a year from ATH 384 to 90 may looks bearish but can start investing for a long term view

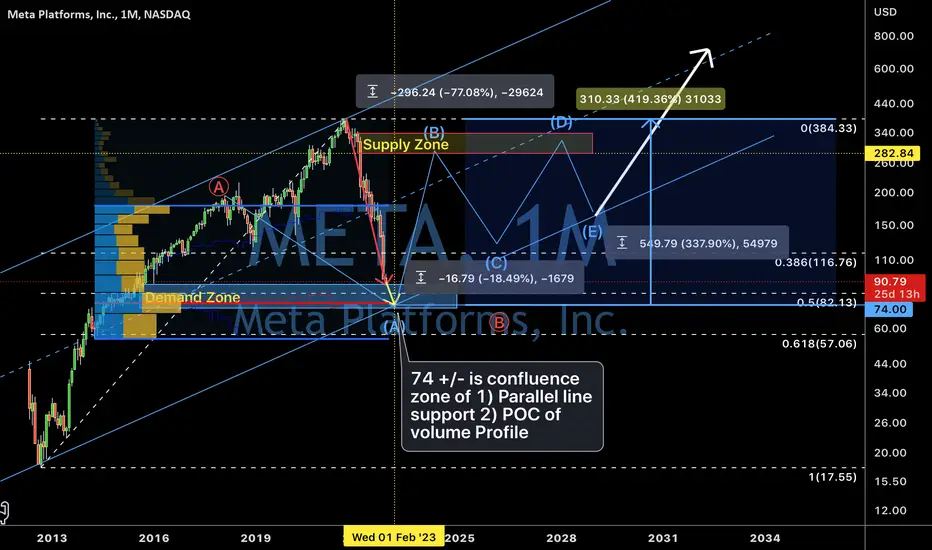
META/Facebook how “low” it can go? 5/Nov/22Meta / Facebook share price have dropped more than 70% ( 77.08%) Since A.T.H.. Probably another -18.49% +/- to reach 74+/-...AND probably ranging ( flat, triangle etc) for few years after after previous years of strong rally..
META go down the hoooooooleMy friend's parents want to snatch up some META shares, so I took a look at the chart out of curiosity. Feels like we haven't seen the bottom yet, particularly with a broader market crash imminent.

META monthly despair of the bubbleBuy Shares of META Stop at $103.91 Limit at $103.91 (Good 'til Canceled)
META monthly despair of the bubble long term investment for my retirement account.

META Daily TA Neutral BearishMETAUSD daily guidance is neutral with a bearish bias. Recommended ratio: 45% META, 55% Cash.
* BOUNCE WATCH . Equities, Equity Futures, Commodities, Cryptos, CNYUSD, JPYUSD, GBPUSD, EURUSD and US Treasuries are up. DXY and VIX are down. META has now fallen 77% from its ATH in September 2021 after posting two consecutive quarters of revenue declines and is projecting another a decline in Q4. Their Reality Labs division which works on their virtual reality + metaverse projects has lost almost $10b this year . Their operating margin is also shrinking as cost and expenses rose 19% YOY. People are getting fearful and smart money might be getting greedy. Though premature to say that META has found a bottom, it's looking like it's found a good spot for an impulse bounce. The Employment Situation today showed that nonfarm payroll employment increased by 261k and the unemployment rate jumped from 3.5% to 3.7% . Key Upcoming Dates: US October CPI at 830am EST 11/10; UofM November Consumer Sentiment Survey at 10am EST 11/11; 2nd Estimate of US Q3 GDP at 830am (EST) 11/30.*
Price is currently testing $89 support which coincides with the descending trendline from June 2017. Volume is currently Moderate (high) and has been shrinking for five consecutive sessions and is on track to favor sellers for a third consecutive session if it closes today's session in the red. Parabolic SAR flips bullish at $127, this margin is bullish at the moment. RSI is currently trending up at 24.5 as it continues to technically test 26.51 support which coincides with the uptrend line from July 2012 as support as well. Stochastic remains bearish and is currently trending down slightly at 2.72 as it approaches a test of max bottom. MACD remains bearish and is beginning to form a trough as it tests -13.77 support. ADX is currently trending up slightly at 42 with no sign of peak formation as Price continues to fall, this is bearish.
If Price is able to bounce here then it will likely test $107.28 resistance and potentially attempt to fill the gap from 10/26/22 (~$128) when Price fell ~20% on earnings day. However, if Price continues to break down here, it will likely test $74 support . Mental Stop Loss: (two consecutive closes above) $90.
