GOLD will start dropping againThe price chart simultaneously approaches the trend line and the resistance range. We anticipate that the price will start its downward trend with the target of 1778.
Metal


Gold downwards trendI drew this fork in October, still intact.
Orang man out, vaccines in. Metals will now be confirmed dead, until we go into a recession/depression due to the new debt.
All money into stonks.
It bounced off the fib I drew, so may go up short term, maybe back to 1830, but the downwards trend will remain intact.

GOLD will drop till 1771Weekly and monthly price charts show a down trend . The price chart shows the highest sales in gold. We expect that the downward trend in the price will accelerate in the coming days after the break of the 1822-1830 price range. The next target could be $ 1771 . We expect this target could be on Friday after the important news of the US unemployment rate.


Metals Mania, but has Silver lost its hype?In 2020, Silver had a legendary rise from its low during the peak of the Coronavirus lockdowns in March – up over 140%. Analysts (including me) attempted to justify its price and separate its strong correlation with Gold by arguing that Biden’s climate change policies will boost Solar Panels’ use, which extensively uses Silver. This may be a catalyst in the longer term.
However, in the short to medium term, Silver is unlikely to be affected by this catalyst. With a new US President in the seat, alongside a decrease in Gold’s price, what are we going to see in the price of Silver?
Technical see Silver playing between $22 – $27
From September till the present, Silver has been fluctuating between $22.40 and $27.30 reliably. We can see clean candles to the downside from the $27 mark, predicting strong moves to the downside if it rejects that strong psychological level.
The Gold /Silver Ratio reached an all-time earlier this year when Silver’s price collapsed to $11.94 when investors flew to equities out of fear of market fluctuations. The Gold/Silver Ratio is a ratio of how much silver ounces must buy a silver ounce of Gold.
With Gold quoted to rise in the medium due to inflation concerns, some analysts predict a Bull Run in 2021 for Silver. Philip Newman, a consultant at Metal Focus, stated that “We are going to see new record highs for Gold and Palladium , but silver will see the chunkies gains,”


GOLD Long breakout expected next?...The Dollar continues to retreat on a mixture of broad risk factors and US specifics following confirmation that Treasury Secretary-in-wating Yellen favours bold fiscal stimulus and market forces when it comes to the Greenback’s value, while she also intimated that increased spending should not necessarily raise the tax burden for businesses extortionately (or proportionately). The index is trying to keep tabs on the 90.500 level having declined to 90.272 and hold above support ahead of 90.000 via the 21 DMA that comes in at 90.141 today. Conversely, Sterling is back in the ascendency, and across the board as Cable sets sights on 1.3700+ again and Eur/Gbp tests bids into 0.8850 amidst reports of heavy selling interest after the cross breached 0.8900. Firmer than forecast UK inflation metrics may have prompted some upside, but the Pound’s revival appears more corrective and positional in advance of another speech from BoE Governor Bailey. In terms of the gold sentiment, we could see a rally over the rest of the week taking gold back above the $1,900 handle...

XAUUSDAs the rise of DXY follows my plan as shown in previous ideas.
it has made 91.0 target 1 and could continue to possible key FIB values at 92.0 which would result in gold double bottoming at 1764.
Small market balance required I should see filled.
targets valid and on correct path as things stand.

GOLD Buy Setup - Will You Wait For It?Hello everyone, if you like the idea, do not forget to support with a like and follow.
on DAILY: GOLD is approaching a strong round number 1800.0 in green so we will be looking for buy setups on lower timeframes.
on M30: GOLD is forming a channel in gray but it is not valid yet so now we are waiting for a third swing to form around it to consider it valid.
Trigger: Waiting for a momentum candle close above the gray area to buy.
and until the buy is activated, this one would be overall bearish and can still break the 1800 downward.
and if GOLD breaks the gray trendline upward now (before forming two more swings for it to be valid) then we will not buy.
As price approaches our upper resistance, we will be looking for sell setups.
Good luck!


XAUUSD (Gold) Entry Price 1848.49Enter at the 1848.49 price zone area. Price Targets are 1973.73 and 2074.98.


Metal Inverse Head & Shoulders Pattern (Easy 70% Move)Metal (MTLBTC) is now active in what people called the iH&S pattern.
The inverse head & shoulders do not need to be exact for me to be used as a signal.
As soon as you see the dips where the second one is the lowest point of the three, you have a reversal signal. I've seen this pattern many times before.
This is normally a bullish pattern.
Looking at other chart signals, we can also see a volume breakout and MTLBTC price moving above EMA10.
The green arrows show the potential bullish scenario.
The red dashed line at the bottom is the support/stop-loss.
Namaste.

Possible buy opportunity hereLooking for it to bounce off S1 mark. PT after that would be $9.8- $10.
*Indicators used*
-Zig Zag
-Pivots
-Vol
-MACD
-Super Trend V1.0


GOLD (XAUUSD) Looking 1800 AreaGold ranging tomorrow , when thanksgiving moment low volatility
Waiting can Price Hit 1800 , will be bounce back or breakout
It looks like we will see Hit 1800 First

Platinum towards the topLet me present my idea, it looks like Platinum has touched the 61.8% Fibonacci retracement level at the price 953.066, and we hope to go to the first price direction in the 982.739 range at the 161.8% level, and the second price at the 999.925 range at the 261.8% level, but I personally prefer to set the profit point at the first price range. If the movement breaks below the price 953.066, it is likely to go short.

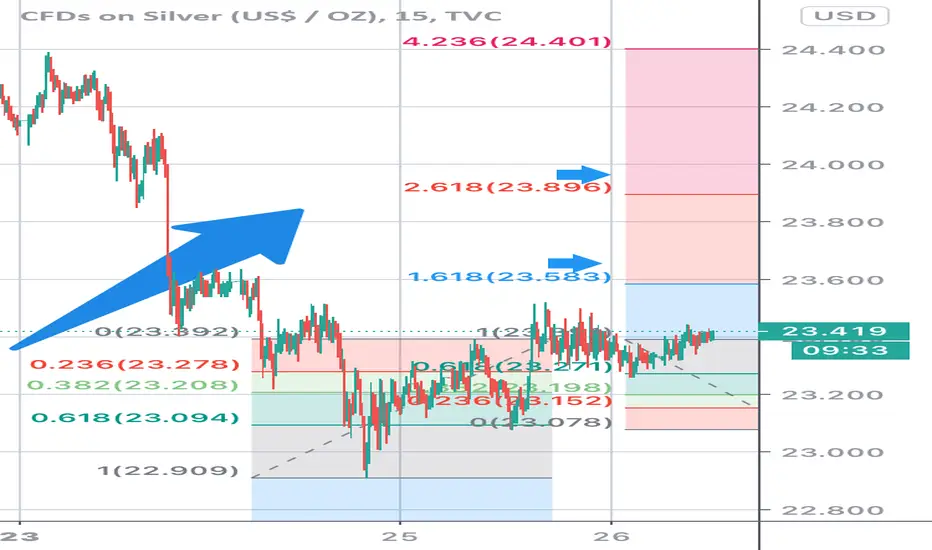
Silver returns to the top in a momentSilver has tested the 61.8% Fibonacci retracement in the 15-minute time frame, and we expect the first profit target to be achieved in the 23,586 price range and the second price range at 23,888.