GOLD - Eyes on The Price With This One As Metal Pushes HigherGood day fellow traders!
Daily time frame: Gold can be unfolding a higher degree wave C), as part of a bigger A)-B)-C) structure, out of a previous triangle correction. Wave C) is an impulse and may unfold five-waves to the upside, before resistance for wave C) may be seen, and a change in trend may follow. At the moment sub-wave IV of C) can be unfolding, and can look for support near the 14000 psychological region.
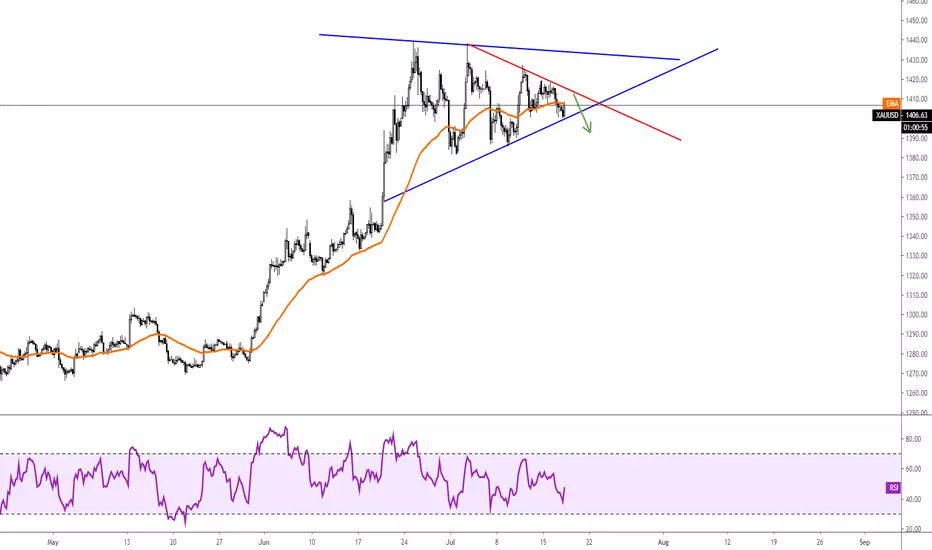
4h time frame: Sideways price activity on gold from 1439 region can be a possible triangle correction in the making as part of an uptrend, and can look for support near the Fibonacci ratio of 23.6 (1390/1400 region). A later rally in impulsive fashion (clear, five legs), and above the upper triangle line would suggest a completed consolidation, and more upside.
Projection target for the fifth wave can be around 1460/1470 area.
Have a great day everyone!
Metal

Overall view on XAUUSD - June 15th's weekThe IMF said the U.S. currency is overvalued by 6% to 12% based on near-term economic fundamentals. The dollar index, benchmarked against a basket of six currencies, fell 0.2% on that, boosting gold which is a contrarian trade to the dollar. In another hand, markets are currently pricing the odds of a quarter-point interest rate cut at 100% for the end of the month. With a constant daily traded volume and a price increase, odds of a bullish continuation.
Possible targets: 1440.000 (+1450$ per lot).
Advice: Stay bullish and buy lower points while we don't break down 1400.00.

We will follow the 1414 levelRisk appetite in the market is changing. The decline in the precious metal reached support at the 1400 level. If it breaks the 1400 level, we can see a sharp decline towards to 1392 level. But if 1400 level holds downward price action, we will follow the 1414 dollar resistance.
Gold CFD (XAUUSD) long.All description on chart.
Please, don't forget to like and follow.
Thank you.

Long Gold 1:2 R:R Gold is going to trade higher. Let's just make money out of this move. Use proper money management.

Platinum breakout? Where will it go from here?Let's see what the move will be now that Platinum has broken the downward trend line

Metal/Bitcoin (June 28) #MTL $MTL #BTC $BTCAccumulate : 410-450
Sellzone : 550-620
Holdzone : 870
Stoploss : Under 410


SILVER/USD UPDATEKeypoint :
- Orange line : Fibonacci sequence x 1.618 from October 2008.
Yellow line : Fibonacci retracement 2018
white line : Projected Down Trenline from september 2016
Closer they are (orange and yellow fibonacci line) in between the high resistance/support is expected
- expect a down trendline would be tested and a possible retracement once it's touch that line. in unexpected moment, if the price action do managed get above the down trendline. there will be a good bullish trend sign for SILVER/USD
Indicators :
- Stochastic RSI : managed to create higher low and rising up above 80 level currently. bullish momentum yet it's highly chance it will retrace in next fib line
- DMI : +DI (buyer strength) is creating a huge range with - DI (seller strength) which is a good sign for bullish momentum for now. ADX (momentum strength) is rising and expected will be get above 25 soon..
- MACD : Macd line crosses toward bullish zone and the buyer histogram is rising currently. although there's slight bearish divergence in between price action and histogram which is lower than previous one. nevertheless it can be negated easily.
Thank you for your time to read this post and please take this idea as a grain of salt as reality always differ from what i expect as this post merely just an opinion.

GOLD (XAUUSD) - Strong ResistanceA possible Sell opportunity:
- yearly levels (2017 high)
- trendline
- strong area
Wait for a rejection from smaller timeframes. If possible then wait for a confirmation from bearish candlestick patterns.
Feel free to support my effort by hitting the "LIKE", it is my only fee from You!
Best regards

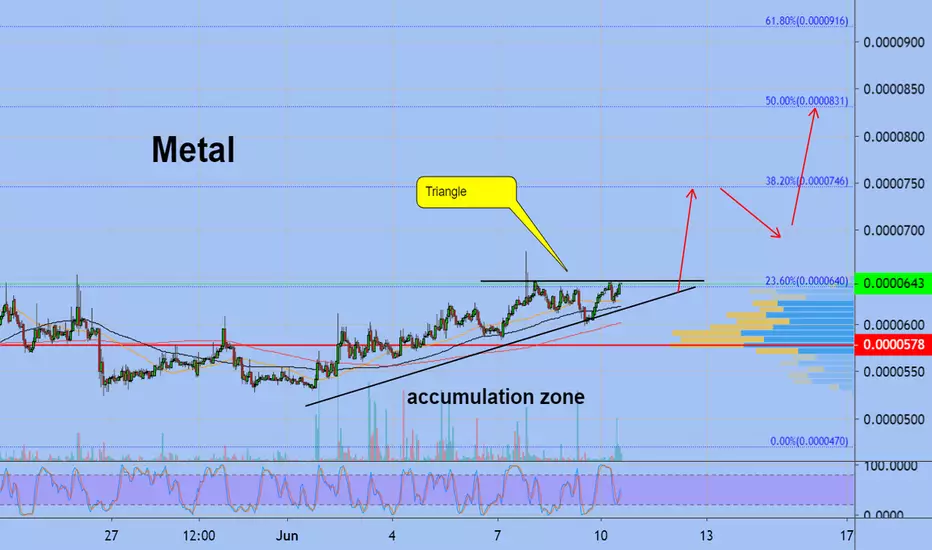
Metal signal by EXCAVOMTLBTC look like rocket. You can see accumulation zone. Formed billish triangle
RSI- oversold
We need just wait little
Metal (MTLBTC) Prepares For Another Run (220% Or More Possible)Metal (MTLBTC) is another altcoin that we traded in the past with great results. Our last public trade generated for our readers and followers over 100% profits, and we believe Metal can move again and do even more this time.
Here you can find our latest public trade (great results):
Right now we are looking at:
New all-time low (on Binance)
Long term bullish divergence.
The RSI hit oversold and is now trending up.
We believe there is plenty of room for growth.
Thanks a lot for reading and your support.
Namaste.
This is not financial advice.
All the information shared here on this channel, and/or by Alan Masters, is intended for educational and entertainment purposes only.

Metal/Bitcoin (29 May) #MTL $MTL #BTC $BTC#BUY #WAIT
Current Price : 553
Buyzone : Buy close to 500 as possible
Sellzone : 600-900
Stoploss : Below 450

Daily Bullish Signal $MTL #MTL #MTLBTC #BTC $BTC (3 May)RED ARROW indicates the EXPECTED Time and Targets
Level Stoploss point up to maximize profit and reduce risk
I'm working all the time, even in Bearish Market
======================
My path doesn't seem like anyone. I'm like a MONK, always studying to find the direction that prices will follow. I will feel very comfortable if the price goes exactly in the direction I drew. I will always try and practice until PERFECTION is MY OWN

SILVER - Descending triangle and possible HSGood evening traders,
Straight to the point for XAGUSD / silver
Weekly (left) we have a big descending triangle since beggining 2016 (3 years already), we have a downtrend confirmed by multiple touches and a huge support on 13.85 that has not broken so far.
Now, on DAILY chart (right) we have a POSSIBLE hs formation that has his neckline yet to be broken. Now, why do i have my doubts about this HS? Because a HS formation is a ONLY REVERSION pattern and....Silver was in an uptrend on daily chart? Well, yes..at least since NOV/18, anyway its not a HUGE uptrend and for that i dont fully trust this HS.
H4 (bottom) chart we have a confirmed downtrend but RSI is almost oversold and therefore its a good idea to wait another downtrend re-test.
For anyone willing to sell i'd close all position on main support since there is too much buying pressure there, anyway lets keep an eye ;)
This Trading Idea is to be used for educational purposes only. This idea does not represent financial advice and its NOT a signal. You should trade based only on your own technic and knowledge.

MTL-BTC Long Trade PlanCommodity : METAL
Trade Type : LONG
Trading Against : BITCOIN
Entries : Double-UP Entries throughout the Buy Zone
Profit Taking : 25% at each TP point.
Profit Locking : Move SL to break even once TP1 is hit, to TP1 once TP2 hits, to TP2 once TP3 hits and so on
Duration - 2-4 weeks
Investment in trade : 5% of the total Trading Balance.
Prospective Profit : 14% to 63%
Prospective Loss : 19%
RRR : Between 0.75 and 3.24 depending on TPs
Buy Zone/TPs/SL price points are marked in the chart as follows
Greens - Profit Targets (TPs)
Blue - Buy Zone (Entries)
Red - Stop Loss (SL)

Daily Bullish Signal $MTL $MTL #MTLBTC $BTC #BTC (17 April)RED ARROW indicates the EXPECTED Time and Targets
Level Stoploss point up to maximize profit and reduce risk
I'm working all the time, even in Bearish Market
======================
My path doesn't seem like anyone. I'm like a MONK, always studying to find the direction that prices will follow. I will feel very comfortable if the price goes exactly in the direction I drew. I will always try and practice until PERFECTION is MY OWN


GOLD - Wait for the possible bottom + possible H&SGood weekend everyone,
Gold as i've said on previous ideas is not ready to take off toward 1400 zone yet, and for that we must wait the proper opportunity to buy it.
Weekly timeframe we can see the price failing to create a new HH and now we have a bearish engulfing candle removing all the progress from 3 weeks past, all this added to a hidden bearish divergence on RSI.
Daily timeframe we have a possible (not confirmed yet) H&S formation, price did a good selloff and now rejected 50ema as resistance, bearish sign .
H4 we had a huge sell off movement and now i expect some consolidation period before another big movement.
Personal strategy: wait for the bottom for a big RxR opportunity to long
Optional: Its possible to short aiming ~1275 on lower timeframes after pullback + rejection, its risky.
This Trading Idea is to be used for educational purposes only. This idea does not represent financial advice and its NOT a signal. You should trade based only on your own technic and knowledge.

SILVER - Bearish behaviourGood weekend everyone,
WEEKLY:
As we can see on weekly timeframe, silver is been on a big descending triangle since 2016 and failed to break the descending trendline 7 times so far.
If you check the last weeks volume up-wave, its decreasing, maybe there is no interest on buying silver yet? The price closed the week below 50ema weekly.
DAILY:
After the rally upward, silver failed to keep creating new HH (chech RSI bearish divergence) and HLows and now is struggling around fibo retracement zone.
4H
Ok see these last green candles on the yellow circle? low volume say : no demand.
So overall, silver looks bearish so far and a break below current low can trigger a short opportunity with good RxR targeting the bottom of the big triangle, first support zone would be around 14.65 usd.
This Trading Idea is to be used for educational purposes only. This idea does not represent financial advice and its NOT a signal. You should trade based only on your own technic and knowledge.

Palladium - Short term top?Good weekend everyone, lets look at Palladium, a metal similar to platinum and very used on eletromechanics system like relays, also used on OIL industry as a catalyst.
This metal has been on a very long term rally upside that never seens to stop, but, nothing go up or down forever.
This week candle closed as a bearish pin bar and as we can see the volume is getting smaller and smaller, now, of course i'll not trade based ONLY on a simple pin bar, and since we are at ATH we dont have previous resistances to analyse =)
Daily chart is where im looking forward a short opportunity, if the price break and close below orange line i may short with good RxR targeting fico retracement zones and weekly 50ema.
The low volume on last wave say that maybe the demand is slowly decreasing, maybe its too expensive now our beloved palladium ?
And now we have a beautiful RSI BEARISH DIVERGENCE which give us confluence to try this one.
Anyway remember, trade AGAINST the main trend is always dangerous and the main trend for palladium right now is BULLISH, thats why always trade with proper money management.
This Trading Idea is to be used for educational purposes only. This idea does not represent financial advice and its NOT a signal. You should trade based only on your own technic and knowledge.

Platinum - Double/triple top Good weekend everyone,
Quick look at platinum OANDA:XPTUSD ;
WEEKLY:
As we can see on weekly chart (right on top) platinum is on a downtrend since 2016 and show no bullish signals so far, again rejected the descending trendline.
DAILY:
On our daily chart (bottom) we see that ~875 usd level has been a strong resistance level, tested 4times now and was a previous support before (green up arrow).
What do we have now? A double/triple top for platinum and a bearish RSI divergence.
4H
We see the decreasing volume on the last up-wave and now we are slowly approaching oversold zone and rejected 50 ema as a support , therefore we might see some pullback on the next hours (after market open of course =] )
Strategy:
Sell outright with S.L above 880 usd level aiming 820 zone and further 785 usd level or keep an eye on shorter timeframes after a likely pullback to happen and then short when the best opportunity presents itself.
This Trading Idea is to be used for educational purposes only. This idea does not represent financial advice and its NOT a signal. You should trade based only on your own technic and knowledge.

Metal Profits (Keeping It Easy) This is just straight up chart.Metal Profits (Keeping It Easy)
This is just straight up chart.
I saw Metal (MTLBTC) earlier and the signals were a bit mixed, but I still decided to buy some of it.
It is starting to move and it looks like it might do a strong impulse up. EMA100 is the main target if it follow the same path other altcoins are following.
The RSI is super bullish and the MACD shows plenty of room left available for growth.
Feel free to hit like to show your support.
Namaste.
