Gold - Getting Ready for the Next Impulse!Hello TradingView Family / Fellow Traders. This is Richard, also known as theSignalyst.
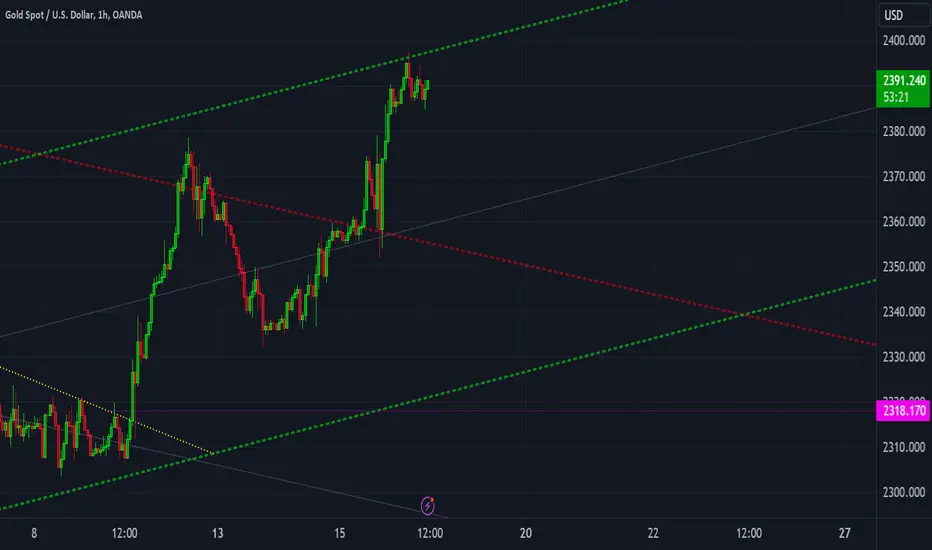
📈 XAUUSD has been overall bullish, trading within the flat rising channel in blue.
Currently, XAUUSD is undergoing a correction phase and it is currently approaching the lower bound of the channel.
Moreover, it is retesting strong demand zone marked in green.
🏹 Thus, the highlighted blue circle is a strong area to look for trend-following buy setups as it is the intersection of the green demand zone and lower blue trendline acting as a non-horizontal support.
📚 As per my trading style:
As #Gold approaches the blue circle zone, I will be looking for bullish reversal setups (like a double bottom pattern, trendline break , and so on...)
📚 Always follow your trading plan regarding entry, risk management, and trade management.
Good luck!
All Strategies Are Good; If Managed Properly!
~Rich
Metal

HINDALCO: METAL TO METTLE?Hey There, Welcome Back.
We are not big fans of industries that are on the commodity (Raw Material) side of the value chain, But for those who don't mind, Here is everything you should know about Hindalco.
- A support trendline has been pushing the price up
- An ascending triangle was formed with the recent 6M consolidation
- A breakout candle broke both the AT Range and crucial resistance zone
- The breakout came in as a Bullish engulfing that adds to the positives
- Overall for the last 15 months, the price has been sideways
- If you draw a resistance line from top, We saw a breakout of that too. Not the most reliable trendline, but it still adds to the analysis
- Price is nicely above 200EMA
- Previously the price failed to sustain the 500 mark. What will it do this time?
Have Insights or Questions? Let us know in the comments below.👇
While you do that, how about a boost for some motivation🚀
⚠️Disclaimer: We are not registered advisors. The views expressed here are merely personal opinions. Irrespective of the language used, Nothing mentioned here should be considered as advice or recommendation. Please consult with your financial advisors before making any investment decisions. Like everybody else, we too can be wrong at times ✌🏻

Nifty Metal: An overviewThis is a quick one. The chart should tell you everything there is to know. We will keep updating the comments below as the price action unfolds.
Have Requests, Questions, or Suggestions? Let us know in the comments below.👇
⚠️Disclaimer: We are not registered advisors. The views expressed here are merely personal opinions. Irrespective of the language used, Nothing mentioned here should be considered as advice or recommendation. Please consult with your financial advisors before making any investment decisions. Like everybody else, we too can be wrong at times ✌🏻

xauusd: Bullish but overbought Near the peak of a mid-term bullish channel, we're slightly overbought, suggesting a mild correction or a couple of days of consolidation for the pair. Keep an eye on unemployment news, as possible change of direction in the market
First rise then fall?Gold broke out off the bearish channel so expecting a rise first towards either 2347 or 2361. Then we might expect a bearish move again. Resistance 2328 might hold and a posible fall from here directly. Priceaction is key!
Resistance: 2328, 2346, 2362
Support: 2319, 2308, 2295

Bearish continuation or trap?After the long bullish gold market gold tapped out around 2400 with a tripple top(H4). Gold managed to break below the neckline and a fall off gold happended after the retest off the bullish channel.
Currently were moving in a smaller bullish channel wich cam from a bearish fall. Expecting bulls to weaken this week and another fall in gold might happen. If gold manage to break above 2365 again the sentiment will change and bulls will take over the goldmarket again.
Bearish midterm target lies around 2305. While bullish target might be 2400 again.
Resistance: 2344, 2352, 2364
Support: 2330, 2313, 2305

XAUSD_Bullish_Long_Gold_#metal#Gold
Once again yellow metal is showing very clear divergence and the same being confirmed from the momentum indicator as well (RSI). Double bottom also printed and now the script is trading at it's critical support. If it's break neckline then we are bullish and therefore we have place Buy Stop Order at those level with very clear SL & TP.
#NFA (Non Financial Advice) #DYOR (Do your own Research)

What can we expect this week?last friday gold suffered a big crash off around 1000pips in couple hours, leavins buyers perplex. The bullish trend support stopped the fall off gold for now. Expecting gold to retrace bullish, but all depend on certain support levels and the trend support.
A clear break off 2325 would be bad for buyers and a posible reverse trend may start. If 2305 breaks then gold will fall furhter.
The given arrows are not a signal. but a posibility
Resistance: 2363, 2373, 2393
Support: 2346, 2326, 2305

8000 MARKET CAP IS BOUND TO 11 THOUSAND MARKET CAP IN 100 DAYSArchean Chemical Industries Ltd, incorporated in the year , has its registered office in No 2 North Crescent Road, T Nagar, Chennai, Tamil Nadu, 600017, 91-44-61099999. The main industry in which Archean Chemical Industries Ltd operates is Chemicals.
Auditor/Auditors for Archean Chemical Industries Ltd is/are PKF Sridhar & Santhanam LLP. In the main management, is chairman and G Arunmozhi is the company secretary for Archean Chemical Industries Ltd.
SPOT 653
DATE 12 APRIL 24
777 EXPECTED TO GO
ADD UPTO 636
MAIL US FOR MORE VIJAY at Vijaymarketingg . com
HAPPY INVESTING

The trend is your friend..The current trend is very bullish. Fundamentals playing a role. Gold remains a safe assets during wars. In my last analysis i notified the montly timeframe were we cuyrrently broke out the major ranging market. It is posible that we will stay in a bullish trend for longterm with targets 2400 and 2500 in the long run.
Priceaction remains important. Selling can become a losing strike very easily. But this doesnt mean we can't sell the market. We should pay attention to priceaction. Proper reversal pattern can give indication the trend is reversing. But be cautious with selling, because with every pullback we can see a very strong bullish momentum in return. Buyin the lows seems more reasonable in the gold market. Wait for proper confirmation to take any trade. SElling or buying.
>The arrows are not a signal. But a posibility<
resistance: 23,49, 2364, 2400(psycological)
support: 2342, 2331, 2321

PLatinum Quick Video Idea - -2024.04.08EASYMARKETS:XPTUSD
Disclaimer:
easyMarkets Account on TradingView allows you to combine easyMarkets industry leading conditions, regulated trading and tight fixed spreads with TradingView's powerful social network for traders, advanced charting and analytics. Access no slippage on limit orders, tight fixed spreads, negative balance protection, no hidden fees or commission, and seamless integration.
Any opinions, news, research, analyses, prices, other information, or links to third-party sites contained on this website are provided on an "as-is" basis, are intended only to be informative, is not an advice nor a recommendation, nor research, or a record of our trading prices, or an offer of, or solicitation for a transaction in any financial instrument and thus should not be treated as such. The information provided does not involve any specific investment objectives, financial situation and needs of any specific person who may receive it. Please be aware, that past performance is not a reliable indicator of future performance and/or results. Past Performance or Forward-looking scenarios based upon the reasonable beliefs of the third-party provider are not a guarantee of future performance. Actual results may differ materially from those anticipated in forward-looking or past performance statements. easyMarkets makes no representation or warranty and assumes no liability as to the accuracy or completeness of the information provided, nor any loss arising from any investment based on a recommendation, forecast or any information supplied by any third-party.

Is there an end to the bullrun? Or longterm bullmarket!Gold still pushing higher and higher. Is it posible were in a longterm bullrun? See update post montly timefram.
Priceaction wise gold is showing a rising wedge wich can indicate a correction or reversal. Selling the high resistance off this channel can be done but is trickie against the main bullish trend. A confirmed break below this support channel and below support level 2266 might drop gold even more. If the support channel keep respecting then you can enter longs.
Make sure you mange risk 100%. Especially with selling the bullmarket.
Support: 2287, 2277, 2266
Resistance: 2300(Psycological)

Jindal Steel multi year breakout incomingJindal steel looks like set for major breakout of 15+ years of 796.
As per wave count too it look set for a major wave.
Buy in the zone of 750-770 & add more above 800 for good targets of minimum 900 & much more in the coming months.
Stop loss should be anything below 750

Pullback or further growth?Last week gold moved in a very strong bullish wave and tapped into new ATH. The big daily resistance trend got broken. Today it broke below this resistance trend. Structure build above this zone. Expecting gold to retrace bullish first and then a posible further fall towards 2225.
Arrows are a posibility, not a signal.
resistance: 2244, 2259(ATH)
support: 2222, 2211

Wich way is next for gold?Last week 2150-2147 support showed it's power to traders. For now it's our most important support zone to watch out over. After FED gold spiked up and created a ATH sitting around level 2222 and the next day gold collapsed again towards 2155. I do think gold bulls maxed out at last 2222 ATH. In the long run gold will fall.
Gold is retesting the breakout channel and i am expecting a pull back into stronger resistance zones before a fall of gold again. So in the upcoming days we must focus on longs first in the gold market.
All confirmed breaks below 2145 we should consider as a strong bearish market. So shorts needs to be added after. In my opinion whe wont be seeing this in the upcoming days..yet...expecting a good range between 2195 and 2148
All arrows show on the charts are posibilities. Priceaction confirmation are important. So don't use this as signal!!
Resistance: 2176, 2185, 2193
Support: 2157, 2148

🔖XAUUSD H4🔖 20 March 2024🔖XAU/USD, H4🔖 20 March 2024
Better-than-expected inflation data from the US prompted expectations of a hawkish tone from the Federal Reserve during its interest rate decision. Consequently, US Treasury yields climbed alongside the dollar, triggering a selloff in non-yielding assets like gold. Despite this, gold may consolidate within a range ahead of key events, with investors advised to monitor closely for further trading signals, particularly from the Fed's monetary policy decisions.
Gold prices are trading lower while currently testing the support level. Suggesting the commodity might extend its losses after breakout.
Resistance level: 2150.00, 2235.00📉
Support level: 2080.00, 2035.00📈

Silver Is Bouncing From The Support; Bullish Breakout Soon?We talked about silver (XAGUSD) in January, where we mentioned and highlighted strong support at the lower side of a triangle range. On January 26rd we shared a weekly chart of silver, where we warned about limited weakness and sideways contracting triangle range.
As you can see today, silver bounced from the lower triangle line and it’s back to the upper side of a triangle range, which can be signal for a completed A-B-C-D-E bullish triangle pattern, but bullish confirmation and real bullish breakout is only above 26 region.
So far we can see some nice recovery with an important move above 23.50 followed by push out of a base channel and above 24.50 on 4h time frame, which possibly that's wave (3) of 3 within an impulse, meaning more upside can be coming on silver as this one can be preparing on some major breakout of a big triangle, just be aware of short-term pullbacks.

Wich side will gold breakout?Last week gold formed a posible Symmetrical Triangle or descending triangle. Keeps respecting the resistance trendline and support trendline/zone. We can expect a breakout from both sides. But need to be aware off potential fakeouts. Wait for confirmation break on either sides and enter the trade.
Upcoming week we have Fed Interest Rate deciscion on 20th March.
Resistance: 2163, 2176
Support: 2150, 2140, 2132

Gold will be Slave or Master❗️Hello TradingView Family / Fellow Traders. This is Richard, also known as theSignalyst.
📈 After breaking above the $2100 resistance, XAUUSD surged by 5%.
How high can Gold climb?
The marked red circle represents a significant resistance and overbought zone as it marks the intersection of:
1- $2250 round number.
2- Upper red trendline from weekly.
3- Upper blue trendline from daily.
🏹 Thus, the highlighted blue circle denotes a robust area to anticipate a potential reversal.
And keep in mind: the bigger the impulse, the bigger the correction.
Therefore, when Gold begins to trade lower, be prepared!
📚 Always follow your trading plan regarding entry, risk management, and trade management.
Good luck!
All Strategies Are Good; If Managed Properly!
~Richard Nasr

ATH retested. Break and fly or gold crash?Mentionend in my previous analysis that ATH will get retested. Gold hit the target!
from 2090 up tp 2150 gold didn't proper pullback into support/supply zones. So many zones are fresh an untested. We bought the gold market all the way up. Atm ATH resistance keeps respecting. We can expect a cooldown for gold. Priceaction can confirm this. Divergengy also shown. Bearish targets are 2133 and 2105. Longterm maybe 2090, but it won't be an easy road back.
If price manage to break above 2012 with confimations then the game changes and bulls will take over the market to create a new ATH. Targets posible 2180 and 2200.
Resistance: ATH 2150
Support: 2125, 2120, 2100, 2090

Will we test ATH again. Or bull trap?Last week friday ended either in disaster or very profitable market for traders. After the break off the bearish channel and retest gold went up 400+ pips in a short time leaving multiple resistance levels in dust. Especially the 2060 level were most retail traders expected a downfall(including me) got wrecked. It was because off fundamentals, but in my opinion big players joined the market also to grab liquidity.
For upcoming weeks we have some good oppertunities:
Bullish scenario:
2085-2088 is last major resistance. Got tested 1 time before in higher timeframe. We can still expect a proper rejection on this level. We need to focus on posible sell off the market here and wait for the fall towards 2070, the bigger support level 2060 or last posibilty is back to the support trendline. From these levels we can expect a bullrun again. If the last resistance 2088 break with confirmation it will grow rapidly towards psycological resistance 2100 and then back to last ATH 2150!! Because there is less structures above 2088 we can expect quit some moves. Especially if it breaks ATH then gold will posible grow towards 2300!
BUT....
Bearish Scenario:
Keep in mind that the marketmaker moved the market up from 2055 rapidly to wipe
early sellers. 2088-2090 is major resistance It is posible that the market will
collapse from 2088 and eventually also breaks below 2060 were most buyers will wait to go long
Early sellers already got wiped out. So maybe the marketmaker will try to wipe buyers also.
We need to follow priceaction. Were we get confirmation we will take the trade.
Resistance: 2088, 2100, 2150
Support: 2070, 2060

GOLD - Wait For It ⏱Hello TradingView Family / Fellow Traders,
On Daily: Left Chart
GOLD has been bullish trading within the flat channel in blue and it is currently hovering around the upper bound.
On M30: Right Chart
📈 For the bears to take over, we need a momentum candle close below the last major low highlighted in gray.
📉 Meanwhile, XAUUSD would be bullish short-term and can still trade higher to test the $2100.
📚 Always follow your trading plan regarding entry, risk management, and trade management.
Good luck!
All Strategies Are Good; If Managed Properly!
~Richard Nasr

FIrst long then posible short againGold managed to break the bearish trendline resistance. I have adviced members to buy the market on retest confirmation. Bullish targets are 2024, 2030 and posible 2040(depends)
In the long run waiting for proper confirmation for sells around 2030 or 2040. But only if priceaction confirms it. Then we can sell the market for targets: 2020, 2007, 2000
Resistance: 2020, 2030, 2040
Support: 2013, 2007, 1990
