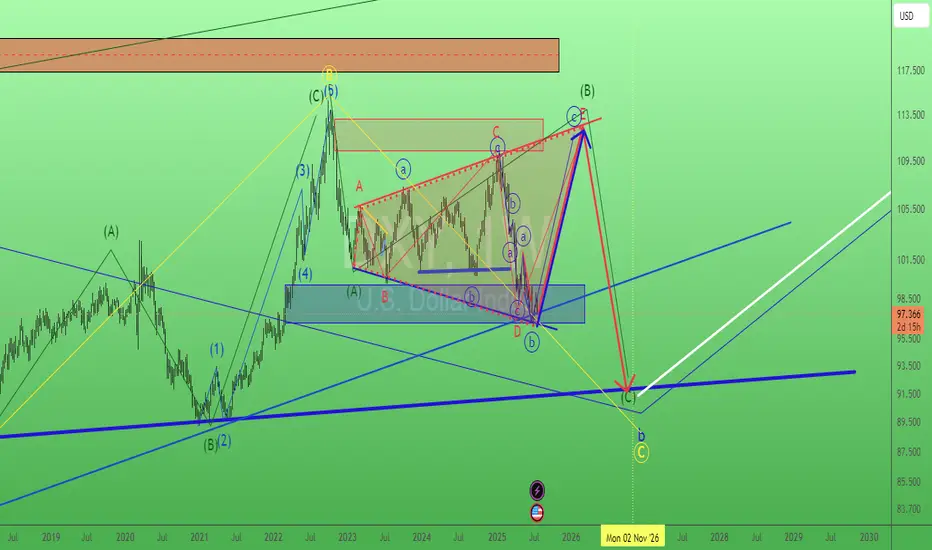
GOLD - SHORT TO $2,880 (UPDATE)As Gold has pushed up towards our $3,416 zone which I said would happen on Monday, I have re-analysed the charts & put in a new yellow 'supply zone' of where sellers should hold price & start declining.
Gold is still holding below our Wave 2 high ($3,451) which is a good sign. But, if Wave 2 high is taken then bearish structure is invalidated & we can start looking at buy trades.
Metals

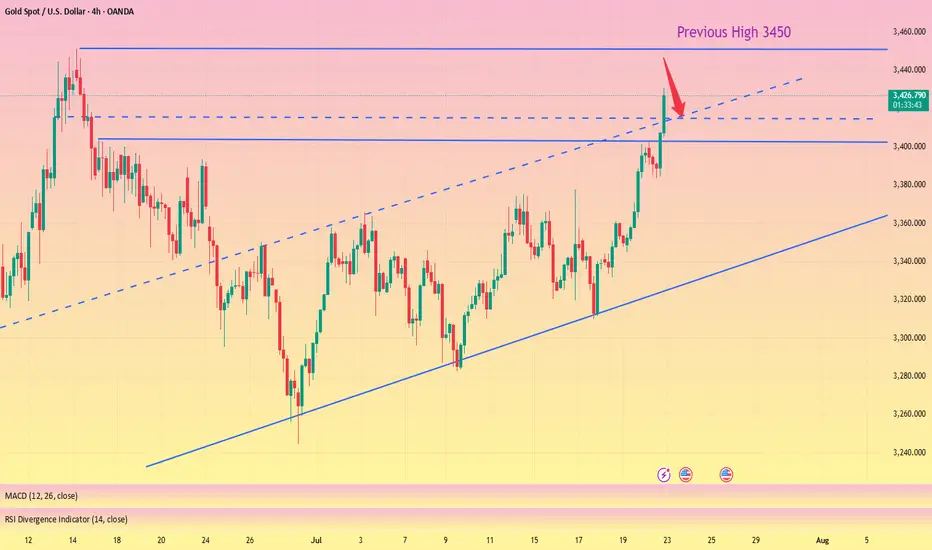
HelenP I. Gold, after small correction, can continue to move upHi folks today I'm prepared for you Gold analytics. If we look at the chart, the dominant feature is a strong, sustained bullish trend defined by a major ascending trend line that has repeatedly served as a reliable foundation for the price, confirming that buyers currently maintain firm control. At present, the price action is consolidating above a crucial horizontal pivot area, the support zone between 3385 and 3400. The significance of this zone is high, as it's a classic polarity point where previous resistance has flipped to become support, suggesting a concentration of buying interest. My core analysis hinges on the scenario of a brief, healthy corrective move down to retest this support zone. I believe this retest is a key market dynamic to confirm buyers' commitment. If the price dips into the 3385-3400 area and is met with a decisive rejection of lower prices, it would provide a powerful signal that the underlying bullish sentiment remains fully intact. A successful defense of this zone would be the primary trigger, creating the momentum for the next upward leg. Therefore, I have set the primary goal for this move at the 3460 level. If you like my analytics you may support me with your like/comment.❤️
Disclaimer: As part of ThinkMarkets’ Influencer Program, I am sponsored to share and publish their charts in my analysis.

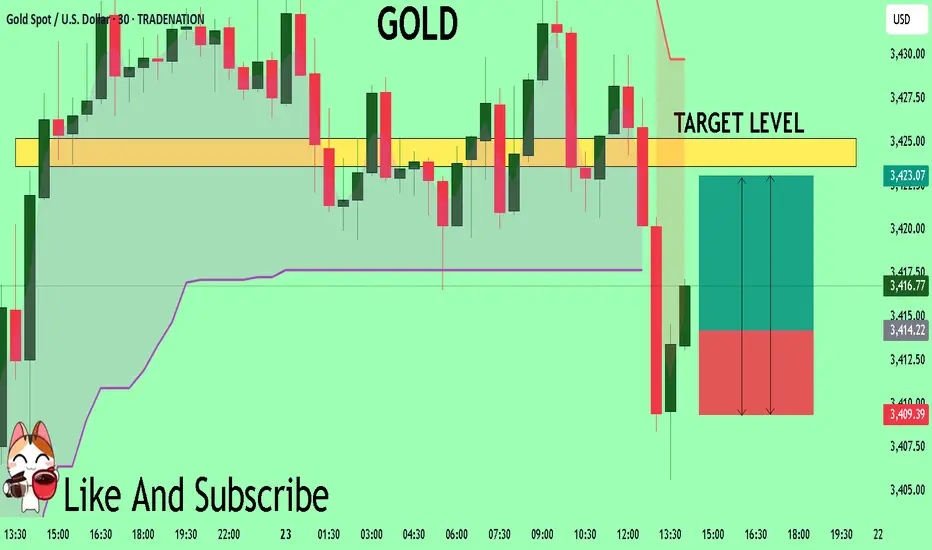
GOLD The Target Is UP! BUY!
My dear friends,
Please, find my technical outlook for GOLD below:
The price is coiling around a solid key level - 3414.2
Bias - Bullish
Technical Indicators: Pivot Points Low anticipates a potential price reversal.
Super trend shows a clear buy, giving a perfect indicators' convergence.
Goal - 3423.6
Safe Stop Loss - 3409.3
About Used Indicators:
The pivot point itself is simply the average of the high, low and closing prices from the previous trading day.
Disclosure: I am part of Trade Nation's Influencer program and receive a monthly fee for using their TradingView charts in my analysis.
———————————
WISH YOU ALL LUCK
XAUUSD: Market analysis and strategy on July 22.Gold technical analysis
Daily chart resistance level 3450, support level 3330
Four-hour chart resistance level 3420, support level 3375
One-hour chart resistance level 3402, support level 3375.
Gold rose sharply on Monday, fluctuated upward in the Asian session, and the NY market accelerated its rise, with the daily line rising sharply to 3400. The fundamentals of the bull market have not changed, and this time it is believed that the factor that triggered the unilateral rise is the expectation of the Fed's interest rate cut. Yesterday I mentioned that the 1-hour bottom structure appeared, and a new bullish opportunity appeared again!
Yesterday's idea was very clear. The Asian session stepped back to confirm the top and bottom conversion support level of 3344, and finally the NY market rose sharply, directly breaking through the key position of 3377.
Gold price stood firm at 3360, preparing to break through the key position of 3377 and then accelerate its rise. Yesterday's increase broke through the highest level in the past month. After all, the strength after the breakout after such a long period of volatility will not be small. In the previous few trading days, it returned to the previous high to complete the conversion of top and bottom. Today, pay attention to the support of the top and bottom conversion position of 3377. If it falls back during the day, you can continue to buy on dips based on the support of 3375. The bulls are accumulating momentum to break through the suppression of the 3400 mark. If it stands firm at 3400 after the breakthrough, it will be a large-scale increase.
In terms of intraday operations, buy more near 3377/75 after the retracement.
Buy: 3375 near
Buy: 3402near

Gold breaks new high, expect a pullback in the evening#XAUUSD
After the rapid rise of the previous day, the gold market has fallen into an overbought state, but yesterday's increase of nearly $60 still provided solid support for the bulls. It is expected that the market will show repeated fluctuations in the future⚖️.
In terms of operation, it is recommended to pay close attention to the gains and losses of the 3,400 mark. If it is successfully broken through, it is expected to further test the 3,420-3,425 and 3,450 lines; on the downside, pay attention to the top and bottom conversion support of 3,403📈.
📊At present, you can consider shorting near 3430, defending 3440, and aiming at 3410💡
🚀SELL 3430-3440
🚀TP 3415-3405
GOLD | Bullish Bias Amid Fed & Trade Policy UncertaintyGOLD | Bullish Bias Amid Fed & Trade Policy Uncertainty
Gold prices edge higher as markets weigh conflicting signals from the Federal Reserve and renewed trade policy uncertainty. Diverging opinions among Fed officials regarding the inflationary impact of President Trump's proposed tariffs have fueled demand for safe-haven assets.
While some members like Waller and Bowman appear open to rate cuts, others remain cautious about lingering inflation risks, adding to market volatility.
Technical Outlook:
Gold maintains bullish momentum above 3365. A break and hold above this pivot supports continuation toward 3375, and if momentum builds, toward 3385 and 3395.
However, any sustained move below 3365 may trigger a bearish correction toward the support zone between 3355 and 3342.
Pivot Line: 3365
Resistance Levels: 3375 · 3385 · 3395
Support Levels: 3355 · 3342
Bias: Bullish above 3365

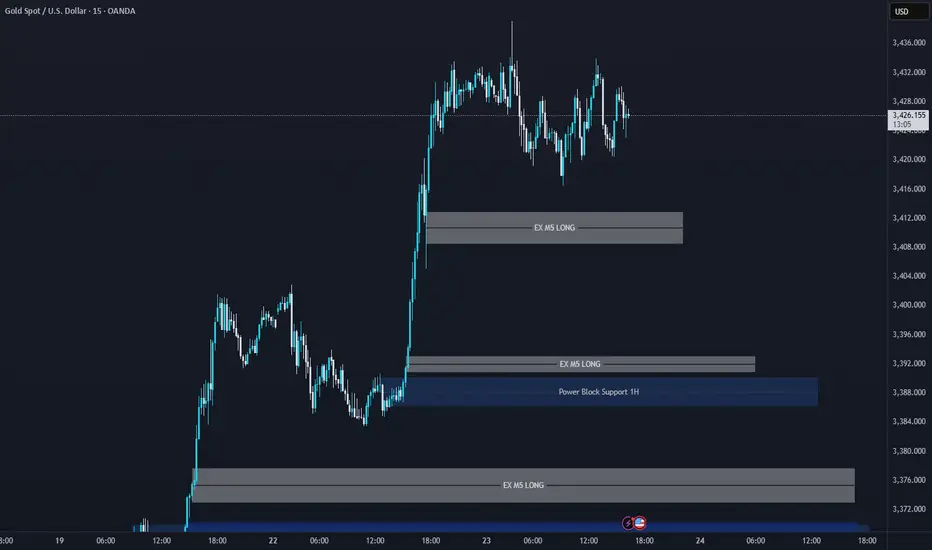
XAUUSD Support & Resistance Levels🚀 Here are some key zones I've identified on the H1/M15/M5 timeframe.
These zones are based on real-time data analysis performed by a custom software I personally developed.
The tool is designed to scan the market continuously and highlight potential areas of interest based on price action behavior and volume dynamics.
Your feedback is welcome!
Gold is Targeting Fresh HighsHey Traders, in today's trading session we are monitoring Gold for a buying opportunity around 3,410 zone, Gold is trading in an uptrend and currently is in a correction phase in which it is approaching the trend at 3,410 support and resistance area.
Trade safe, Joe.

XAU/USD) Bullish trend analysis Read The captionSMC Trading point update
Technical analysis of Gold (XAU/USD) on the 1-hour timeframe. Here's a breakdown of the key trading
---
Technical Overview
Price: $3,428.71 (currently near the upper consolidation)
EMA 200: Around $3,367.38 (well below price, indicating strong uptrend)
Target Point: $3,468.52
Indicators:
RSI (14): 60.19–62.55 → shows moderate bullish momentum, not yet overbought.
---
Key Technical Elements
1. Bullish Breakout Structure:
Price has broken out of a previous range, and is forming a bullish flag or rectangle, which typically leads to continuation higher.
Measured move projection from previous leg (approx. $51.57 gain) targets the $3,468.52 level.
2. Strong Support Zones:
Two yellow zones highlighted:
Upper support level (around $3,415): acting as immediate structure support.
Lower key support (around $3,380): crucial structure level from where the trend initiated.
3. Trend Line Support:
A clearly marked ascending trend line supporting higher lows—indicating bulls are in control.
Expect price to stay above this trend line to maintain bullish bias.
4. Volume & RSI Confirmation:
RSI remains in a bullish zone but isn’t overbought → leaves room for upside.
Volume remains steady, confirming healthy consolidation.
Mr SMC Trading point
---
Conclusion & Trade Idea
Bias: Bullish
Entry Zone: On breakout or retest of minor support ($3,415–$3,420)
Stop Loss: Below trendline or below $3,415
Target: $3,468.52
Confirmation: Hold above trendline + RSI staying above 50
This is a classic bullish continuation setup supported by structure, RSI, and trend momentum. Traders could look for buying opportunities on minor dips or trendline retests.
---
Please support boost 🚀 this analysis)

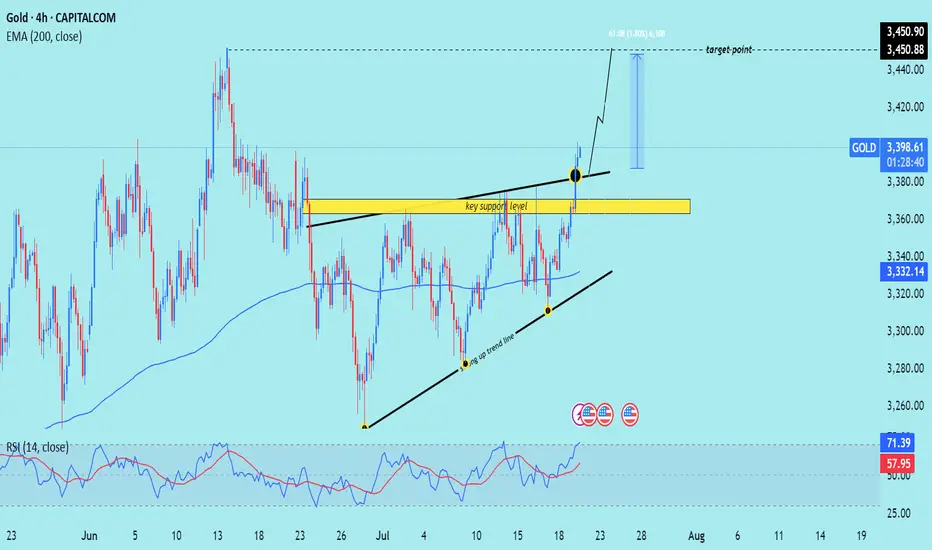
XAU/USD) breakout analysis Read The captionSMC Trading point update
Technical analysis of (XAU/USD) on the 4-hour timeframe, highlighting a move toward the $3,450 target. Here's the full technical breakdown
---
Technical Analysis – Gold (4H)
1. Breakout from Resistance Zone
Price has broken above a key horizontal resistance level (now turned support, marked in yellow).
The breakout is confirmed by a strong bullish candle with momentum, suggesting buyers are in control.
2. Ascending Triangle Formation
Price formed an ascending triangle, a classic bullish continuation pattern.
The breakout above the upper boundary confirms the pattern, projecting a potential measured move.
3. Trendline Support & Higher Lows
The structure shows a rising trendline (black), where price bounced multiple times — confirming a higher low sequence.
The confluence of trendline support + breakout level adds strength to the bullish case.
4. 200 EMA Confluence
The 200-period EMA (3,332.13) has been acting as a dynamic support throughout.
Price retested it earlier in the move, then surged upward — validating trend continuation.
5. RSI Indicator
RSI is at 71.13, entering overbought territory.
This implies strong bullish momentum, but a short-term pullback to retest the breakout level is possible.
6. Target Projection
Target Point: $3,450.90, calculated from the height of the triangle (~61 pts or 1.80%) added above the breakout zone.
A retest of the breakout area (yellow zone) around $3,370–$3,380 could offer a better entry before continuation.
Mr SMC Trading point
---
Summary
Bias: Bullish
Current Price: $3,397.62
Support: $3,370–$3,380 zone (previous resistance turned support)
Trend: Higher lows + breakout above resistance
EMA Support: 200 EMA at $3,332.13
Target: $3,450.90
RSI: 71.13 – bullish but near overbought
Please support boost 🚀 this analysis)
EUR/USD | Bullish Momentum Builds – Next Targets Ahead! (READ)By analyzing the EURUSD chart on the 4-hour timeframe, we can see that, as per the previous analysis, the price first made a strong move in two steps, successfully hitting the 1.15580 target. Upon reaching this key level, it reacted positively with increased demand and is now trading around 1.16520. Given the current trend, I expect further bullish movement soon, with the next potential targets at 1.16720, 1.17230, and 1.17500.
Please support me with your likes and comments to motivate me to share more analysis with you and share your opinion about the possible trend of this chart with me !
Best Regards , Arman Shaban

$GLD / $GC – Gold Poised for Breakout as Hard Assets FlexAMEX:GLD / SET:GC – Gold Poised for Breakout as Hard Assets Flex
Gold is setting up for a major breakout, and the broader market is finally catching on to the hard asset trade. Whether it’s inflation ticking up or the never-ending government deficit spending, the market is starting to signal something big.
🔹 Macro Tailwinds:
Inflation pressures + record deficit = a perfect storm for gold.
The dollar is under pressure — metals ( AMEX:GLD , AMEX:SLV , SET:GC ) are responding.
This theme isn’t going away anytime soon.
🔹 Technical Setup:
AMEX:GLD and SET:GC (Gold Futures) are coiled tightly just under breakout levels.
Volume is steady, and momentum is building under the surface.
A move through current resistance could send this entire trade into overdrive.
🔹 My Positioning:
1️⃣ Options: Long AMEX:GLD calls with 1-month expiration — slow mover, but clean structure.
2️⃣ Futures: Trading SET:GC contracts on the breakout side.
3️⃣ Silver Exposure: Still holding partials in AMEX:SLV — it’s following gold’s lead but with more juice.
Why I’m Focused Here:
This is not a one-day theme — hard assets are becoming a rotation trade.
If this confirms, we could see multi-week upside in precious metals.
It’s rare to get clean technicals that align this well with macro.
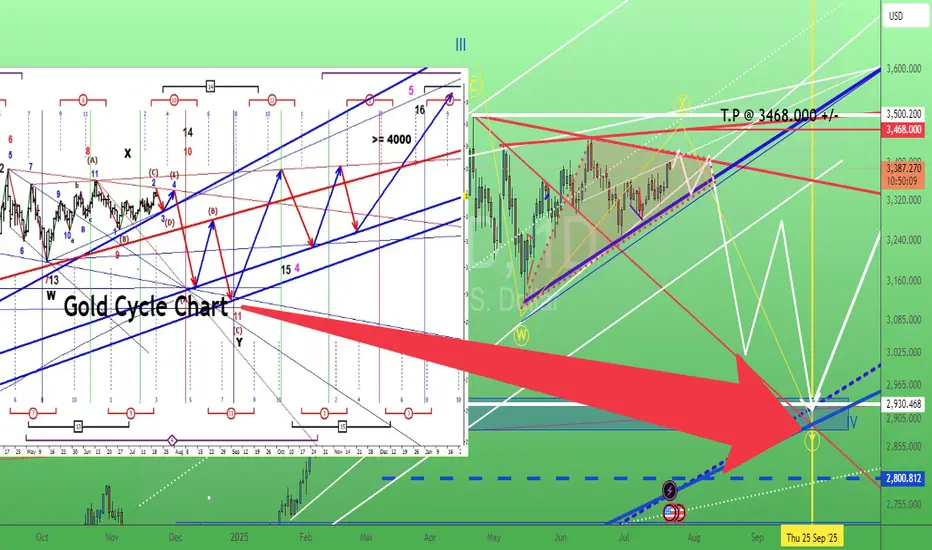
Gold is forming a bull or bear triangle. 22/July/25XAUUSD. is gold forming a bearish or bullish triangle, but the cycle chart shown it is pointing to the "south", maybe my analysis s is "wrong"...
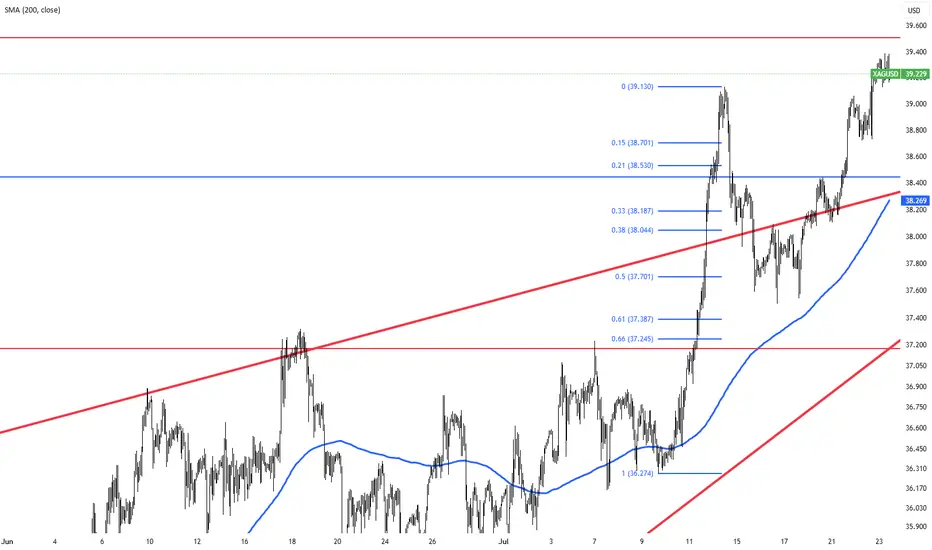
SILVER (XAGUSD): Confirmed Break of Structure
Silver updated a year's high yesterday, breaking a strong daily resistance.
With a confirmed Break of Structure BoS, we can expect that
the market will rise even more.
The next strong resistance is 40.
It is a round number based psychological level.
It can be the next goal for the buyers.
❤️Please, support my work with like, thank you!❤️
I am part of Trade Nation's Influencer program and receive a monthly fee for using their TradingView charts in my analysis

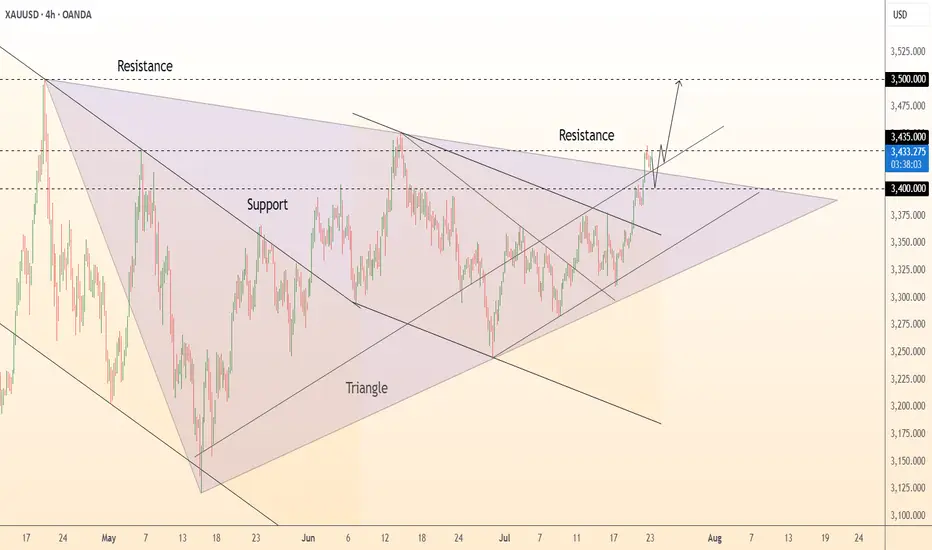
DeGRAM | GOLD exited from the triangle📊 Technical Analysis
● Price has burst above the five-month symmetrical-triangle ceiling at 3 400, converting that line into support; the breakout’s measured move targets the June peak 3 435 and aligns with the rising-channel top near 3 500.
● A tight bull flag is forming on higher-lows inside the new micro up-trend; repeated bids on pull-backs to 3 400-3 405 confirm fresh demand and favour continuation.
💡 Fundamental Analysis
● Gold is buoyed by a softer USD and safe-haven demand as trade frictions grow and Fed guidance turns less certain, keeping XAU/USD firm above $3 400.
✨ Summary
Buy 3 400-3 410; sustained trade over 3 435 eyes 3 500. Bull view void on an H4 close below 3 360.
-------------------
Share your opinion in the comments and support the idea with a like. Thanks for your support!
GOLD - Strong Trendline & Golden Pocket ContinuationMarket Context
Gold is currently trading within a rising wedge structure on the 4-hour timeframe. This formation typically represents a tightening market, where buyers continue to push higher — but with decreasing momentum. The confluence of both trendlines and repeated Golden Pocket bounces makes this setup technically rich and worth watching closely.
Golden Pocket & Trendline Confluence
Throughout the recent move up, price has consistently reacted to the 0.618–0.65 Fibonacci retracement zone — often referred to as the Golden Pocket. Each major retracement has found support not only at this zone but also at a rising trendline, showing strong alignment between horizontal and diagonal demand. This dual-layer support has repeatedly led to sharp rebounds, reinforcing the bullish structure.
What Comes Next?
Price is currently sitting just below the upper resistance of the wedge. If history repeats, a retracement toward the lower trendline could be the next logical step. A reaction in the same region — where the Golden Pocket once again overlaps the trendline — could offer a high-probability long opportunity for continuation toward the top of the wedge or even a breakout.
Alternatively, if price breaks below the trendline with conviction, it could signal exhaustion in the current structure, potentially flipping the bias toward a broader correction.
Final Thoughts
This is a textbook example of how technical confluence can guide trade planning — especially in clean, trending environments like this. Remember: patience is key. Let the market come to your levels.
If you enjoyed this breakdown, a like would go a long way — and feel free to share your thoughts or ideas in the comments below!

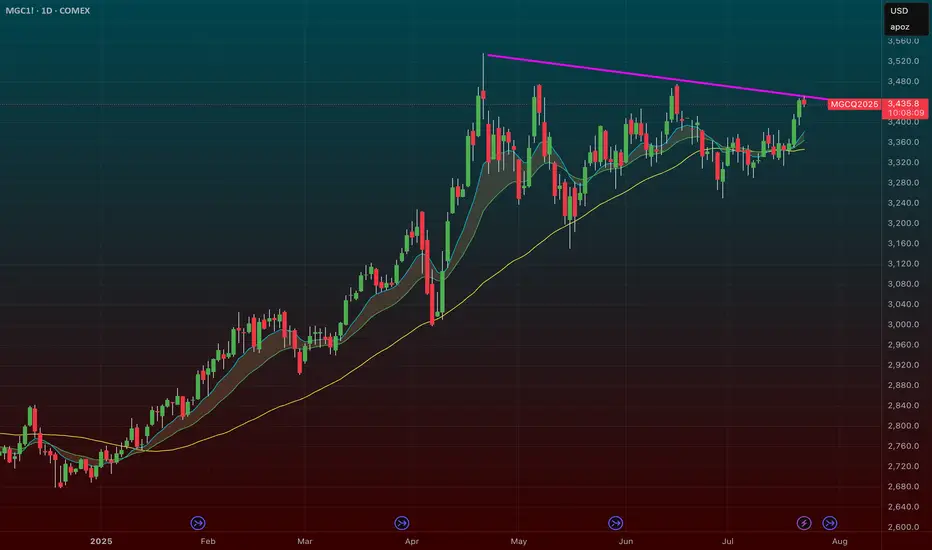
Gold to $3720Gold has been trading within an ascending triangle since late April, staying above the support line and the 50-day EMA. This is the fourth time Gold is testing the resistance line at $3440, and it will likely break soon. The breakout FOMO should push Gold to around $3720, IMO.

3400 has been reached, wait patiently for a pullback to go longGold opened on Monday with a volatile rise. After breaking through the 3360-65 area, the bulls turned strong. After breaking through the 3375~80 area in the evening, the bulls accelerated their rise, reaching the highest point of 3402. It fluctuated sideways in the late trading, and the daily line closed at around 3397 with a big positive line! Gold temporarily broke the small range oscillation pattern, but the bulls were not strong, and it still fluctuated upward.
From the perspective of the intraday cycle, after yesterday's rapid rise, the market fell into a serious overbought state; however, yesterday's $60 big positive line supported the bulls, and it is expected that the market will fluctuate; the next focus is still the 3400 mark area. The pressure in the 3400~05 area was dense last night, and adjustments may be made at any time before the breakthrough; and since the rise of 3282, it has just touched the upper edge of the parallel channel. The big sweep will continue, but the range is constantly changing!
So although gold broke the recent volatility yesterday and hit the 3400 mark with a big positive line; however, if it cannot stand above it, then it will continue to fall; recently we have repeatedly and many times emphasized the importance of the 3400 mark. If it stands here, the market will gradually rise to 3420~25 and break through to the 3450 area before looking for a decline.
Today we will continue to focus on the 3400 mark area. First, we will rush to the high altitude, with the goal of retracement to the 3375 and 3356 regional support platforms, and then pay attention to long opportunities; if the bulls stand above the 3400 mark, they will further bullishly impact 3420~25 and break through the 3450 area before falling back.
OANDA:XAUUSD
Bullish continuation?The Gold (XAU/USD) is falling towards the pivot and could bounce to the 1st resistance.
Pivot: 3,390.13
1st Support: 3,356.66
1st Resistance: 3,491.05
Risk Warning:
Trading Forex and CFDs carries a high level of risk to your capital and you should only trade with money you can afford to lose. Trading Forex and CFDs may not be suitable for all investors, so please ensure that you fully understand the risks involved and seek independent advice if necessary.
Disclaimer:
The above opinions given constitute general market commentary, and do not constitute the opinion or advice of IC Markets or any form of personal or investment advice.
Any opinions, news, research, analyses, prices, other information, or links to third-party sites contained on this website are provided on an "as-is" basis, are intended only to be informative, is not an advice nor a recommendation, nor research, or a record of our trading prices, or an offer of, or solicitation for a transaction in any financial instrument and thus should not be treated as such. The information provided does not involve any specific investment objectives, financial situation and needs of any specific person who may receive it. Please be aware, that past performance is not a reliable indicator of future performance and/or results. Past Performance or Forward-looking scenarios based upon the reasonable beliefs of the third-party provider are not a guarantee of future performance. Actual results may differ materially from those anticipated in forward-looking or past performance statements. IC Markets makes no representation or warranty and assumes no liability as to the accuracy or completeness of the information provided, nor any loss arising from any investment based on a recommendation, forecast or any information supplied by any third-party.

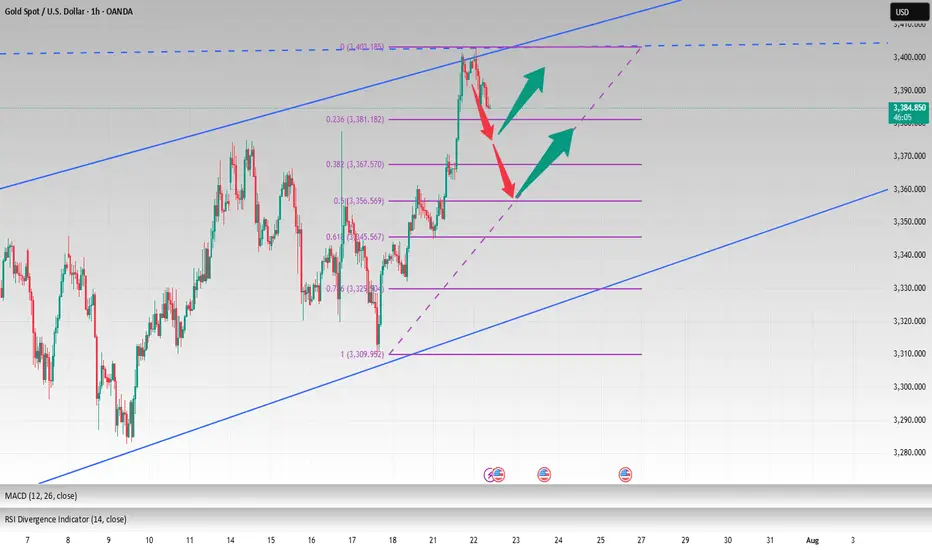
DeGRAM | GOLD above the resistance📊 Technical Analysis
● Five successive rebounds (green arrows) from the 4-month rising‐channel base at 3 293 keep the primary up-trend intact while turning the former wedge roof into support.
● Price is compressing inside a 4-day ascending triangle whose ceiling sits at 3 366; a break projects 1 : 1 to the March top/outer channel rail at 3 435.
💡 Fundamental Analysis
● FXStreet notes bullion ETF holdings rose for a second week as softer US PMI prices dragged 2-yr real yields back to early-July lows, trimming the dollar bid.
✨ Summary
Buy 3 345-3 355; triangle breakout >3 366 opens 3 389 then 3 435. Long bias void on an H4 close below 3 293.
-------------------
Share your opinion in the comments and support the idea with a like. Thanks for your support!

Hellena | GOLD (4H): LONG to resistance area of 3498 (Wave 3).The price continues to move in a bullish direction, and I believe that now is the time to pay attention to the medium-term wave “3.” It is actively developing, and I believe that the target should be set at the maximum area of the higher-order wave “3” — the resistance area of 3498.
This is the nearest target, which carries significant weight.
Overall, the upward five-wave movement is developing according to the old scenario.
Manage your capital correctly and competently! Only enter trades based on reliable patterns!

Silver Stays Strong on China Growth HopesSilver remained firm around $38.90 per ounce, holding near its highest levels since 2010. A weaker dollar and lower U.S. yields underpinned the metal, while traders await Fed Chair Powell’s comments and trade updates ahead of the August 1 deadline. China’s pledge to boost industrial growth also added to silver’s positive outlook.
Resistance is at $39.50, with support at $37.40.
Dollar. When King of cash said : I'm still the king. 23/July/25DXY. when Dollar = the king of cash said : "Cash is King!" AND as a King of cash I'm RECLAIMING MY CROWN.. What will happen to "all equities market? e.g Stocks, Gold or even Bitcoin?