Gold keeps falling – is there more to come?Hello everyone, great to see you again!
Today, gold remains under pressure following a series of strong U.S. economic data releases, which have reinforced expectations that the Federal Reserve will keep interest rates elevated for longer. As a result, the U.S. dollar has strengthened, Treasury yields have climbed, and gold has lost its footing.
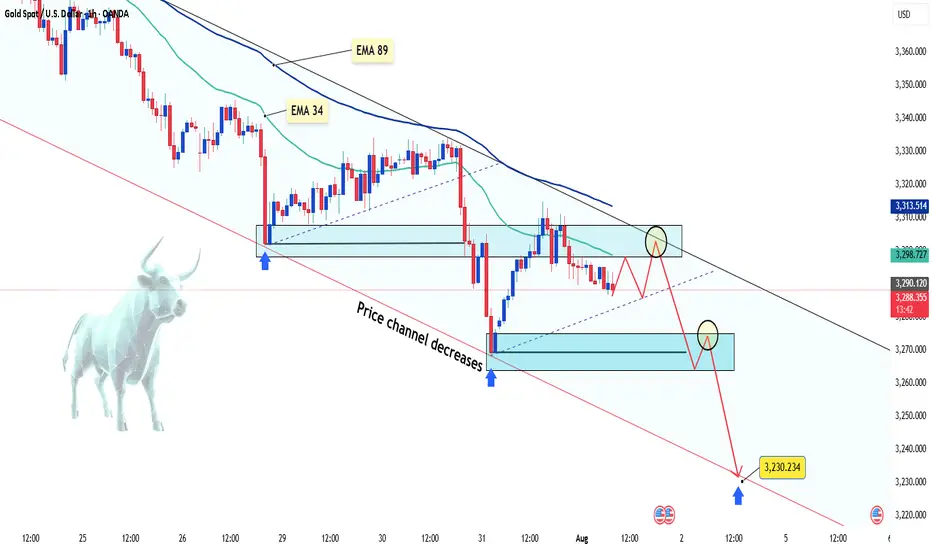
On the H1 chart, XAUUSD is clearly trading within a descending price channel. Both the EMA 34 and EMA 89 are acting as dynamic resistance zones. Recent attempts to rally have consistently failed at these levels, mirroring the bearish setup seen before July 29.
Currently, price is retesting a minor resistance area. If this retest fails, the next downside targets lie near 3,270 – and potentially down to 3,230 USD, which aligns with the lower boundary of the price channel.
From my perspective, the bearish momentum is likely to continue.
What about you? How do you think gold will close the day?
Metals
DeGRAM | GOLD reached the $3300 level📊 Technical Analysis
● XAUUSD remains capped below a broken trendline retest near 3,355, while price forms a lower-high inside a descending channel.
● The repeated rejection of the 3,357.83 resistance level, coupled with failed bullish continuation, points to renewed downside toward 3,300 and 3,262.
💡 Fundamental Analysis
● A rebound in the DXY after strong US consumer sentiment and pending home sales adds pressure to gold, reaffirming real-yield strength.
● Traders are reducing long exposure ahead of upcoming NFP data and Powell’s next statement, shifting bias away from risk hedges.
✨ Summary
Short bias below 3,355. Break under 3,320 eyes 3,300 → 3,262. Key breakdown risk if lower trendline fails.
-------------------
Share your opinion in the comments and support the idea with a like. Thanks for your support!

GOLD Buyers In Panic! SELL!
My dear friends,
Please, find my technical outlook for GOLD below:
The instrument tests an important psychological level 3309.2
Technical Indicators: Supper Trend gives a precise Bearish signal, while Pivot Point HL predicts price changes and potential reversals in the market.
Target - 3296.9
Recommended Stop Loss - 3316.4
About Used Indicators:
Super-trend indicator is more useful in trending markets where there are clear uptrends and downtrends in price.
Disclosure: I am part of Trade Nation's Influencer program and receive a monthly fee for using their TradingView charts in my analysis.
———————————
WISH YOU ALL LUCK

GOLD: Strong Bullish Sentiment! Long!
My dear friends,
Today we will analyse GOLD together☺️
The recent price action suggests a shift in mid-term momentum. A break above the current local range around 3,296.556 will confirm the new direction upwards with the target being the next key level of 3,310.375 and a reconvened placement of a stop-loss beyond the range.
❤️Sending you lots of Love and Hugs❤️

XAUUSD Intraday Technical Analysis – Bullish Breakout SetupGold (XAUUSD) is showing signs of bullish recovery after a sharp sell-off, with current price action around 3305.86 USD hinting at a potential breakout on the 1-hour timeframe.
- Technical Overview
Price structure: After a steep decline, gold formed a base near the 3284–3299 zone and is now climbing back, with a potential inverse head-and-shoulders formation taking shape.
EMA cluster: Price is approaching the confluence of the EMA 50, EMA 100, and EMA 200, currently acting as dynamic resistance around 3309–3323. A break above these levels may confirm bullish strength.
Fibonacci retracement: The bounce appears from the 0.874 extension, indicating the end of the previous bearish leg.
Volume analysis: Increasing bullish volume supports the idea of a potential breakout.
- Key Levels to Watch
Zone Type
Price Level (USD)
Remarks
Immediate Resistance: 3,309 – 3,323 - Major test zone; overlaps with EMA 50/100
Major Resistance : 3,337 – 3,340 - Previous high; if broken confirms bullish continuation
Support Zone: 3,299 – 3,302 - Intraday support turned demand zone
Critical Support: 3,284 – 3,285 - Recent swing low; invalidates bullish view if broken
- Intraday Strategy Suggestion
Scenario 1 – Bullish Breakout
Entry: Buy on breakout and retest of 3,309–3,323
SL: Below 3,299
TP1: 3,337
TP2: 3,355
- Confirmation by strong bullish candle closing above EMA cluster and above resistance zone.
Scenario 2 – Buy on Pullback
Entry: Buy limit at 3,300–3,302
SL: Below 3,284
TP1: 3,323
TP2: 3,337
- Look for RSI divergence or bullish engulfing candle at support for higher conviction.
- Final Note
The bulls are attempting to reclaim momentum after a major correction. If gold can sustain above the 3,309 resistance and hold the 3,300 base, a short-term bullish reversal could materialize.

XAUUSD Market Update – July 30 Late NY Recap🔸Macro Context
Markets are still digesting Powell’s ongoing speech with no clear pivot signals. While FOMC tone remained cautious, no dovish surprise emerged. Trump’s upcoming comments keep geopolitical risks elevated. USD remains firm. Gold is reacting within key HTF demand as intraday volatility cools off.
🔸Bias Overview
Weekly Bias:
• Bearish rejection from the major supply wick 3439–3350
• Structure still below 3345, maintaining downside pressure
• Weekly RSI cooling off — no bullish divergence yet
Daily Bias:
• Lower high locked below 3345
• Price reentered the imbalance toward 3272
• Clean structure remains bearish unless we reclaim 3302
H4 Bias:
• Lower high formed at 3314
• Current price testing HTF Extreme Demand Base (3289–3272)
• Still bearish unless we see a confirmed M15 or H1 BOS from demand
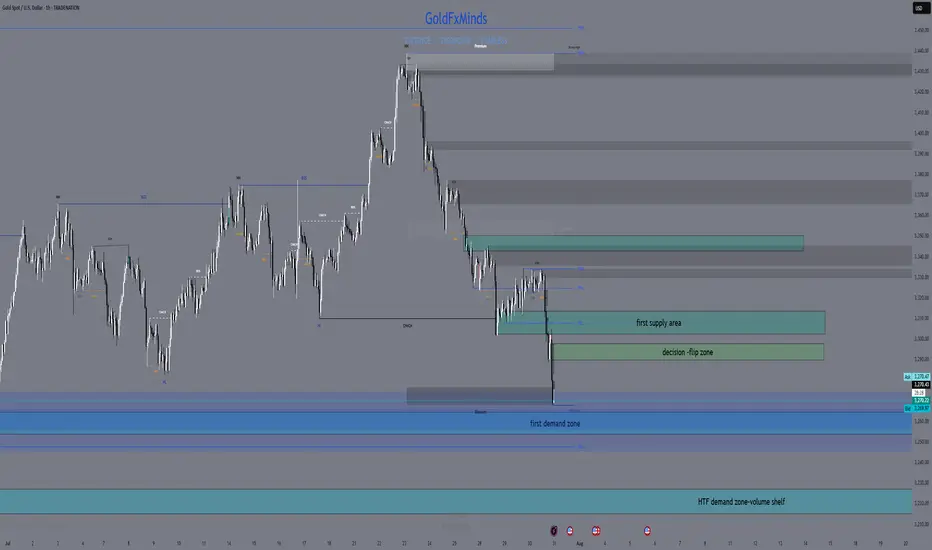
🔸Key Structural Zones
🔺Above Price (3272):
• 3289–3294
Decision Block – M30 OB + FVG. First sign of momentum shift if reclaimed.
• 3302–3314
Supply Reversal – H1 OB + previous BOS zone. EMA alignment adds pressure.
• 3345–3350
Major Rejection Zone – H4 origin of last leg down. Strong resistance area.
🔻Below Price (3272):
• 3254–3264
Imbalance + OB – H4 FVG + clean demand zone. Buy setup only on deep flush + reversal PA.
• 3227–3214
HTF Demand Base – Daily OB + historical volume shelf. Final structural floor before deeper downside opens.
🔸Battle Plan
▶ Scenario 1 – Bearish Breakout
If 3272 fails with momentum and no reversal signs, expect continuation into 3254–3264.
No long trades unless BOS confirms.
▶ Scenario 2 – Reactive Long from Demand
If price gives a strong reaction from 3272 with BOS on M15 or H1 and clears 3294, then a recovery into 3302 is possible. Only valid with confirmed PA + EMA shift.
▶ Scenario 3 – Choppy Rejection from 3294
If price tests 3294 but fails, watch for rejections back toward 3272. Scalpers can fade reactions if no bullish structure forms.
🔸Final Thoughts
Price is once again testing our Extreme Demand Base from July 28 (3289–3272). The zone remains valid — but execution depends entirely on confirmation. Bears still in control unless we reclaim 3302 cleanly.
No need to rush. Best RR setups are found at clean structural edges.
Patience = profits.
—💬 Drop your thoughts in the comments.
❤️ Like if you appreciate the precision.
🔔 Follow GoldFxMinds for more sniper-level updates.
With you all the way,
— GoldFxMinds
📊 Analysis based on Trade Nation TradingView charts.
Gold Sell Setup - M15PEPPERSTONE:XAUUSD
Timeframe: m15
Risk Level: Medium
🔹 Setup:
Price is testing the upper boundary of the descending channel.
📈 Entry:
Current price zone: 3302.5
🎯 Targets (TP):
TP1: 3393
TP2: 3283
TP4: 3264
TP6: 3244
⛔ Stop Loss (SL):
3312.2
#XAUUSD #GOLD #SELL #Signal #MJTrading
Psychology Always Matters:

Gold Next Move (Read description). Hello, Traders.
As you saw we have achieved our target at last ideas.
This week gold is running in down trend, today it has touched the price 3268 and then gold pumped.
As you see guys, gold has breakout the last support area and its support became resistance.
Gold has changed the character according to H1 and there is break of structure (BOS).
The trend is bearish, so gold needs to fall, it can fall till 3351.
Comment positive feedbacks, Thanks.

Gold 30Min Engaged ( Bullish Reversal Entry Detected )Time Frame: 30-Minute Warfare
Entry Protocol: Only after volume-verified breakout
🩸Bullish Reversal - 3318
➗ Hanzo Protocol: Volume-Tiered Entry Authority
➕ Zone Activated: Dynamic market pressure detected.
The level isn’t just price — it’s a memory of where they moved size.
Volume is rising beneath the surface — not noise, but preparation.
🔥 Tactical Note:
We wait for the energy signature — when volume betrays intention.
The trap gets set. The weak follow. We execute.
GOLD falls sharply, fundamental analysis and technical positionOANDA:XAUUSD fell sharply below the $3,300/oz price level as Chairman Jerome Powell did not signal any rate cuts at his next press conference on September 16-17. He only said that “no decision has been made on September” and that “more data will be evaluated in the coming months.” Economic data undermined the case for a rate cut, while geopolitical play remained a potential support.
The Fed and Interest Rates
The Federal Reserve kept interest rates unchanged for a fifth straight meeting on Wednesday, defying persistent pressure from President Donald Trump and White House officials.
However, two members of the central bank's board dissented, a rare move in three decades that underscored growing divisions within the central bank over the impact of Trump's tariff policies.
At the meeting, the Fed kept its benchmark federal funds rate in a range of 4.25% to 4.5%, in line with policy through 2025. Last fall, the Fed cut rates by a total of 100 basis points.
However, Federal Reserve Board Governors Christopher Waller and Michelle Bowman opposed cutting interest rates by another 25 basis points, marking the first time since Alan Greenspan in 1993 that two board members have opposed a majority resolution at a meeting.
At the press conference, Chairman Jerome Powell did not signal a rate cut at the next interest rate meeting on September 16-17, saying only that “no decision has been made about September” and that “more data will be evaluated in the coming months.” Powell also noted that despite Trump’s call for a sharp 3% rate cut to reduce interest costs on US debt and stimulate the housing market, the Fed will continue to monitor the longer-term impact of tariffs on the path of inflation and economic recovery.
Market expectations for a Fed rate cut in September fell to 47% in Powell's speech.
Economic data
ADP jobs data beats expectations and is bearish
US ADP payrolls jumped 104,000 in July, beating market expectations of 75,000 and marking the biggest gain since March. The data showed continued strength in the labor market, reinforcing the Federal Reserve’s stance on keeping interest rates high. Meanwhile, the preliminary estimate of annual GDP growth in the second quarter came in at 3% (2.4% expected), and the core personal consumption expenditures price index rose 2.5% year-on-year (2.3% expected), indicating both economic resilience and inflation stability, further weakening expectations for a rate cut.
Keep an eye on the ISM manufacturing PMI and non-farm payrolls data on August 1. If the jobs numbers continue to be strong, this could reinforce the Fed’s dovish stance.
Geopolitical and Policy Plays
News of a 90-day extension of the US-China tariff deal has eased some safe-haven demand, but Trump’s August 8 deadline for a new Russia-Ukraine deal, coupled with tensions in the Middle East, continue to provide potential support for gold.
Continued purchases by central banks (such as China and India) are a positive signal in the medium to long term, but are unlikely to offset short-term pressure from the Federal Reserve’s policies.
Technical outlook for OANDA:XAUUSD
On the daily chart, gold has been sold below the $3,300 level and now the $3,300 level has become the nearest resistance at present. For now, gold will be limited by the area of the 0.382% Fibonacci retracement with the original price point of $3,300, along with that it has formed a short-term downtrend with the price channel, the next target will be around $3,246 in the short term followed by the Fibonacci retracement level noted with readers in previous publications.
On the momentum front, the Relative Strength Index is operating below 50 and is far from the oversold zone (20-0), indicating that there is still plenty of room for downside ahead.
In addition, the gold trend will also be pressured by the EMA21, as long as gold remains below the EMA21, the current technical conditions continue to favor the downside.
For the day, the technical outlook for gold is bearish with notable positions listed as follows.
Support: 3,246 – 3,228 USD
Resistance: 3,300 USD
SELL XAUUSD PRICE 3345 - 3343⚡️
↠↠ Stop Loss 3349
→Take Profit 1 3337
↨
→Take Profit 2 3331
BUY XAUUSD PRICE 3240 - 3242⚡️
↠↠ Stop Loss 3236
→Take Profit 1 3248
↨
→Take Profit 2 3254
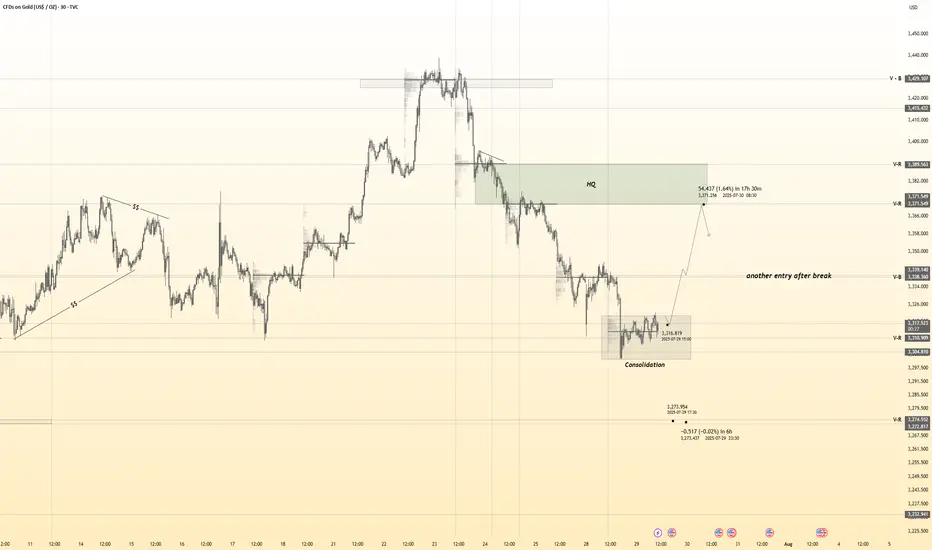
Platinum Breakout Stalk: Thief Entry Only After Confirmed🧠 Thief's Heist Plan Activated!
Asset: XTI/USD (PLATINUM) 💎
Strategy: Bullish Pullback + Breakout Play 💥
🔍 We stalking platinum's neutral zone… waiting for that clean breakout!
No early entries, no premature SLs. Discipline = Profits. 🎯
🎯 Entry: After breakout confirmed. Use multiple DCA limit orders to layer in like a ghost.
🔐 Stop Loss: ONLY after breakout – Place at 1280.00 🛡️
💎 Target: 1560.00 – Vault unlock point! 💰
📵 DO NOT place SL or orders before breakout – patience is the thief’s edge. 🧘♂️
This isn’t gambling... this is precision trading. Breakout = green light 🚦
Get ready to raid the platinum vault!
#ThiefTrader #BreakoutStrategy #PlatinumHeist #XTIUSD #BullishSetup #SmartMoneyMoves

XAU/USD | Gold Below $3345 – Key Demand Awaits at $3282–$3296!By analyzing the gold chart on the 4-hour timeframe, we can see that after dropping to the $3301 area, strong demand came in, helping the price stabilize above $3300 and rally up to over $3334. Currently, gold is trading around $3331. If the price fails to break and hold above $3345 within the next 8 hours, we may see a price correction soon. A key demand zone lies between $3282–$3296, where a strong bullish reaction could occur if price revisits this area. Important supply levels to watch are $3366, $3382, $3393, and $3404.
Please support me with your likes and comments to motivate me to share more analysis with you and share your opinion about the possible trend of this chart with me !
Best Regards , Arman Shaban

Gold Alert: Key Levels for Potential Sell Setup!Good morning, my friends 🌞
Here’s today’s gold analysis. I'm expecting a decline in gold prices, specifically from the 3,383–3,420 level.
Once a correction starts around that zone, my target will be 3,310. Gold has been riding a strong uptrend, and if we reach those levels, I’ll be expecting a pullback and opening a sell position accordingly.
Please set your stop loss based on your personal margin preferences.
Your likes and support are my biggest motivation for continuing to share these analyses. Thank you to everyone showing appreciation 🙏

NZDUSD BUY SETUP LOOOOOOOONGHELLO
we have demand and ascending channel 4h
and low time frame the price make engulfing candle on 30m 15m on support zone
and can't make lower low so i will buy it

Gold Slips After Powell Speech Below 3320 Bearish Pressure BuildGOLD Overview
Market Context:
Gold declined from the 3333 level, as anticipated in yesterday’s analysis, ahead of Fed Chair Powell’s speech. Powell reiterated that it is still too early for rate cuts, citing persistently high inflation, which supported the U.S. dollar and pressured gold.
Technical Outlook:
As long as gold trades below the 3320–3310 zone, the bearish momentum is expected to continue, with the next target at 3285. A confirmed break and stability below 3285 could open the way toward 3255.
To regain bullish traction, the price must stabilize above 3320.
Support Levels: 3285 • 3255
Resistance Levels: 3333 • 3349

Copper: Trump Signs Tariffs on Imports Amid National Security...President Donald Trump signed a proclamation on Wednesday that imposes tariffs on copper imports, citing concerns over national security.
The White House announced that the new policy will introduce a 50% tariff on semi-finished copper products and other copper-derived goods that are highly dependent on the metal.
These tariffs are scheduled to come into effect on August 1, as outlined in a White House fact sheet.
In terms of market dynamics, copper is currently within a monthly demand zone, with a daily demand area also identified for setting pending orders. The potential impact on prices could be twofold: a possible upward movement driven by the discount effect on the metal, or continued decline following President Trump's announcement.
What are your thoughts on how these tariffs might influence copper prices moving forward?
✅ Please share your thoughts about HG1! in the comments section below and HIT LIKE if you appreciate my analysis. Don't forget to FOLLOW ME; you will help us a lot with this small contribution.

Gold Showing Signs of Reversal After Hitting Key ResistanceHello Guys.
Gold has reached a major resistance zone around 3439–3425, which has already acted as a strong ceiling in the past. The price tapped into this area again, forming a clear divergence, and failed to break higher.
Here’s what stands out:
Divergence signals a weakening bullish momentum at the top.
The price rejected the resistance and is now breaking structure to the downside.
A minor pullback may occur before continuation, as shown in the projected moves.
First target: 3259.792
Second target (if support breaks): 3136.869, a deeper zone for potential bounce or further drop.
This setup hints at a bearish trend building up. Stay cautious on longs unless the price structure changes again.

XAUUSD: Market Analysis and Strategy for July 31stGold Technical Analysis:
Daily chart resistance: 3351, support: 3250
4-hour chart resistance: 3335, support: 3270
1-hour chart resistance: 3315, support: 3290.
Gold was trading sideways between 3320 and 3333 yesterday before the New York market. During the US trading session, the release of US ADP employment figures and PCE price data was bearish for gold, causing it to plummet below Monday's low of 3301. The Federal Reserve held interest rates steady, and Powell's hawkish speech sent gold plummeting to around $3268.
Affected by the news, gold prices fell rapidly yesterday, reaching a low near the lower Bollinger band on the daily chart. It rebounded in the Asian session today, reaching a high near 3315. Selling is recommended in the sideways range between 3310 and 3320. The US PCE data will be released in the New York market, so avoid the news release period.
BUY: near 3290
SELL: near 3270

GOLD - Monthly breakout retest may confirm multi-year bull cycleHello everyone, what are your thoughts on the long-term outlook for XAUUSD?
Looking at the monthly chart (1M), we can clearly see that XAUUSD has broken out of the long-standing ascending channel that has held since 2015 — a major signal suggesting the start of a new bullish cycle. Price is now retesting the previously broken trendline, hinting at the possibility of a fresh upward leg to resume the longer-term bullish trend we've seen recently.
Personally, I'm targeting $3,600 in the medium term, and potentially $4,000 by 2026–2028 if institutional capital continues to rotate back into safe-haven assets like gold.
What about you — do you think BTC/USD will rise or fall in the coming years?
And what’s your target for it?

GOLD Local Short! Sell!
Hello,Traders!
GOLD made a retest
Of the horizontal resistance
Of 3313$ and we are already
Seeing a bearish reaction and
We will be expecting a further
Bearish move down
Sell!
Comment and subscribe to help us grow!
Check out other forecasts below too!
Disclosure: I am part of Trade Nation's Influencer program and receive a monthly fee for using their TradingView charts in my analysis.

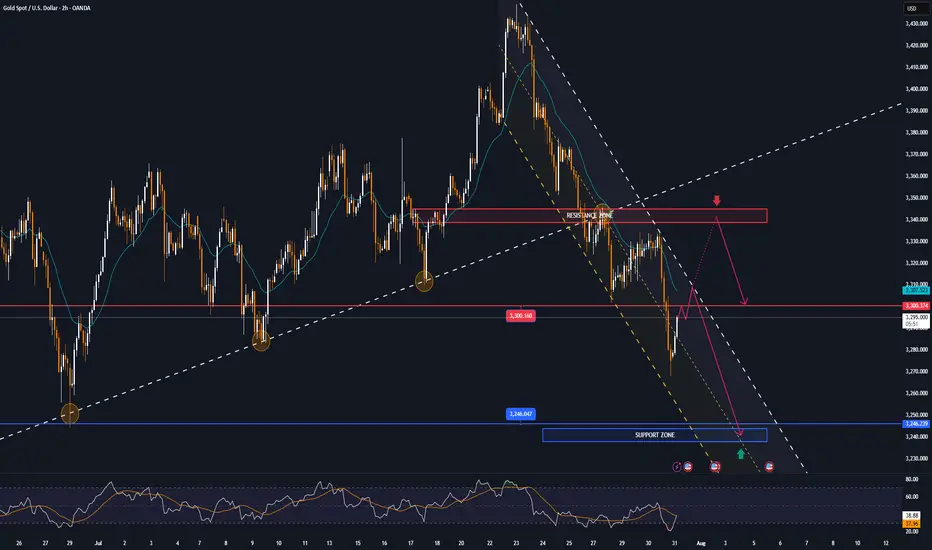
Gold is Falling Sharply – Will It Keep Falling?Hello dear traders, what’s your view on XAUUSD?
Yesterday, XAUUSD continued its strong downtrend and is now trading around 3,296 USD.
The recent drop in gold is largely due to the strengthening U.S. dollar, following the Federal Reserve’s decision to hold interest rates steady as expected — despite sharp criticism from President Donald Trump.
Technically speaking, after breaking below the rising trendline, gold failed to retest successfully and plunged further, confirming that the bearish trend is now in control. Price is currently moving below key moving averages, and the structure has clearly formed a sequence of lower highs and lower lows — reinforcing the likelihood of continued downside.
If a pullback occurs before the next leg down, the Fibonacci 0.5 and 0.618 retracement zone — which aligns with the EMA 34 and 89 and a major resistance level — will be a key area to watch. This could present a prime opportunity for breakout and trend-following traders.
Looking ahead, the next key support sits near 3,220 USD. If this level breaks, gold may head toward the 3,162 USD zone.
What do you think? Will gold keep falling, or will buyers step in? Drop a comment and hit follow to catch the next big move!

Close out the Week STRONGLooks like price has found its bottom and is ready to push from here. We are looking for a strong forceful break out from this zone so we can go for the higher levels. Everything looks right from here and value keeps shifting up. I know we should get a solid entry but waiting for it to line up with time.

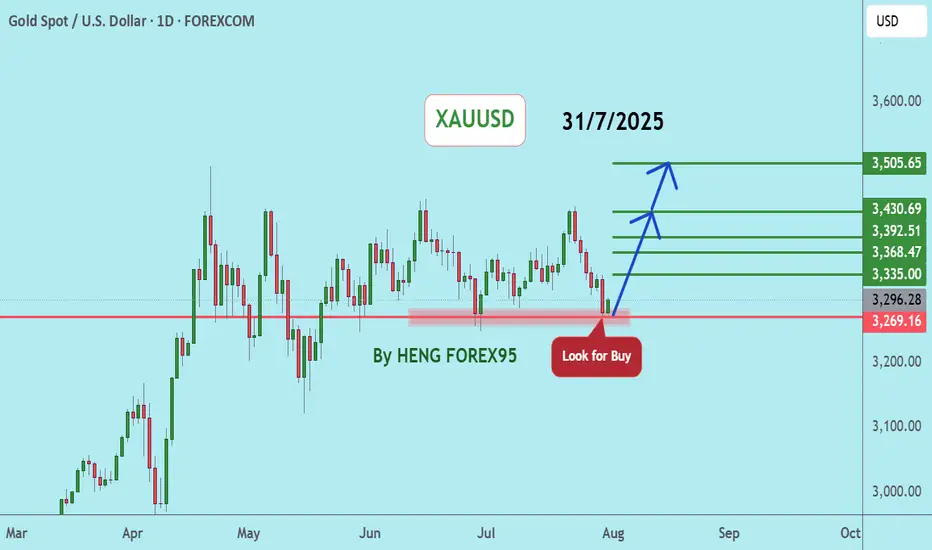
XAUUSDUpdate:
Gold Price Trend: As per our previous analysis on July 28, 2025, the price has now tested the support at 3,269. We expect that if the gold price can hold above 3,249, the gold price trend will remain bullish. We recommend considering buying in the red zone.
🔥Trading futures, forex, CFDs and stocks carries a risk of loss.
Please consider carefully whether such trading is suitable for you.
>>GooD Luck 😊
❤️ Like and subscribe to never miss a new idea!