SILVER ( XAGUSD ): Still Bullish! Take The Buy Setups!In this Weekly Market Forecast, we will analyze the XAGUSD (SILVER) for the week of July 21-25th.
Silver remains a Strong Buy rating. There is no technical reason to look for shorts. Only buys right now, until we see a bearish break of structure. Then sells can be considered.
That having been said, like Gold, there is a 4H +FVG that we are watching. If it holds, higher prices will ensue. If it fails, the lows become the draw on liquidity.
We'll soon see how it plays out.
Enjoy!
May profits be upon you.
Leave any questions or comments in the comment section.
I appreciate any feedback from my viewers!
Like and/or subscribe if you want more accurate analysis.
Thank you so much!
Disclaimer:
I do not provide personal investment advice and I am not a qualified licensed investment advisor.
All information found here, including any ideas, opinions, views, predictions, forecasts, commentaries, suggestions, expressed or implied herein, are for informational, entertainment or educational purposes only and should not be construed as personal investment advice. While the information provided is believed to be accurate, it may include errors or inaccuracies.
I will not and cannot be held liable for any actions you take as a result of anything you read here.
Conduct your own due diligence, or consult a licensed financial advisor or broker before making any and all investment decisions. Any investments, trades, speculations, or decisions made on the basis of any information found on this channel, expressed or implied herein, are committed at your own risk, financial or otherwise.
Metals

GOLD ( XAUUSD ): Watching For A Short Term Buy ConfirmationIn this Weekly Market Forecast, we will analyze the Gold (XAUUSD) for the week of July 21-25th
Gold has been in consolidation for a couple of weeks now. The price action hasn't allowed for very many FVGs... until last week. There is a +FVG I am keeping an eye on, as it will be very telling how price reacts to it upon contacting this POI.
If it holds, higher prices will ensue.
If it fails, to the lows of the consolidation we go.
We'll soon see how it plays out.
Enjoy!
May profits be upon you.
Leave any questions or comments in the comment section.
I appreciate any feedback from my viewers!
Like and/or subscribe if you want more accurate analysis.
Thank you so much!
Disclaimer:
I do not provide personal investment advice and I am not a qualified licensed investment advisor.
All information found here, including any ideas, opinions, views, predictions, forecasts, commentaries, suggestions, expressed or implied herein, are for informational, entertainment or educational purposes only and should not be construed as personal investment advice. While the information provided is believed to be accurate, it may include errors or inaccuracies.
I will not and cannot be held liable for any actions you take as a result of anything you read here.
Conduct your own due diligence, or consult a licensed financial advisor or broker before making any and all investment decisions. Any investments, trades, speculations, or decisions made on the basis of any information found on this channel, expressed or implied herein, are committed at your own risk, financial or otherwise.

XAUUSD 24-Hour Technical Analysis Forecast - UTC+4 Current Price: $3,350.095 (Close: Friday, July 18th, 2025) UTC+4
Analysis Period : Next 24 Hours (July 21-22, 2025) UTC+4
Market Status: Weekend - Preparing for Monday Open 02:00AM 21st July 2025
EXECUTIVE SUMMARY - 24H OUTLOOK
Primary Bias: Neutral to Bearish (Short-term)
Key Resistance: $3,375 - $3,390
Critical Support: $3,285 - $3,300
Expected Range: $3,300 - $3,380
Volatility Level: Moderate to High
CANDLESTICK PATTERN ANALYSIS
Friday's Close Formation
Pattern: Doji-like formation at resistance zone
Significance: Indecision after testing $3,350+ levels
Volume: Moderate - no strong conviction breakout
Context: Failed to close decisively above $3,375 resistance
Expected 24H Patterns
Monday Gap: Potential gap down to $3,320-3,330 area
Reversal Patterns: Watch for hammer/doji at support levels
Continuation Signals: Break below $3,300 could trigger bearish continuation
HARMONIC PATTERN ANALYSIS
Current Harmonic Setup
Primary Pattern: Potential Bearish Bat completing
X: $3,285 (previous low)
A: $3,390 (recent high)
B: $3,320 (61.8% retracement)
C: $3,375 (78.6% projection - current area)
D (Target): $3,300-3,285 (88.6% completion zone)
Fibonacci Levels (24H Focus)
Golden Ratio Resistance: $3,375 (current test area)
61.8% Support: $3,320
78.6% Support: $3,300
88.6% Critical Support: $3,285
Pattern Completion Probabilities
Bearish Bat Completion: 70% probability targeting $3,285-3,300
Bullish Cypher Setup: 30% if break above $3,390
ELLIOTT WAVE THEORY - 24H COUNT
Primary Wave Count
Macro Structure: Wave 5 of larger impulse possibly topping
Current Sub-wave: Wave (c) of corrective structure
Mini Count: 5-wave decline from $3,390 high in progress
24-Hour Wave Projection
Wave 1: $3,390 → $3,320 (Completed)
Wave 2: $3,320 → $3,360 (Completed - 50% retrace)
Wave 3: $3,360 → $3,285 (In Progress - Target Area)
Wave 4: $3,285 → $3,310 (Projected)
Wave 5: $3,310 → $3,260 (Extended target)
Critical Levels
Wave 3 = 1.618 × Wave 1: $3,285 (Primary target)
Invalidation: Above $3,390 (Wave 2 high)
WYCKOFF THEORY - 24H PHASE
Current Market Phase
Phase Assessment: Distribution Phase C (Testing Supply)
Composite Operator Action: Testing demand at $3,350 area
Volume Analysis: Declining volume on recent rallies (bearish)
Expected 24H Wyckoff Action
Phase Transition: Moving toward Phase D (Markdown begins)
Supply Test: Failed test at $3,375 confirms distribution
Target: Initial markdown to $3,285-3,300 area
Key Wyckoff Signals (24H)
No Demand: Expected at current levels
Selling Climax: Possible if break below $3,285 with high volume
Automatic Rally: Dead cat bounce to $3,320-3,330
W.D. GANN THEORY - 24H ANALYSIS
Square of Nine Analysis
Current Position: 3350° on Gann wheel
Next Cardinal Point: 3375° (90° angle - strong resistance)
Support Angles: 3300° (natural support), 3285° (critical angle)
Geometric Progression: $3,285 = perfect square root relationship
Time Theory - 24H Cycle
Natural Time Window: 24-hour cycle from Friday's high
Critical Time: 14:00-16:00 UTC Monday (historical turning point)
Lunar Influence: New moon phase approaching (bearish for commodities)
Angle Theory
45° Line: Currently at $3,320 (rising support)
63.75° Line: $3,285 (steep support angle)
26.25° Line: $3,375 (resistance angle)
Price Forecasting (Gann Methods)
Primary Target: $3,285 (Square root of 81²)
Secondary Target: $3,240 (Square root of 80²)
Resistance: $3,375 (Square root of 82.5²)
Time Forecasting
Turn Time 1: 06:00 UTC Monday (18 hours from Friday close)
Turn Time 2: 14:00 UTC Monday (26 hours from Friday close)
Major Turn: 22:00 UTC Monday (34 hours - Fibonacci time)
MULTI-TIMEFRAME INTRADAY ANALYSIS
5-Minute Chart Analysis
Trend: Bearish momentum building
Pattern: Lower highs, lower lows since Friday high
Key Levels:
Resistance: $3,360-3,365
Support: $3,330-3,335
RSI: Approaching oversold (35-40 range)
Volume: Increasing on down moves
15-Minute Chart Analysis
Structure: Bearish flag formation
Breakdown Level: Below $3,340
Target: $3,300-3,310 (flag pole projection)
Moving Averages: Price below EMA 20 ($3,358)
MACD: Bearish crossover confirmed
30-Minute Chart Analysis
Primary Trend: Corrective phase active
Chart Pattern: Descending triangle
Apex: Around $3,335-3,340
Breakout Direction: 65% probability downward
Volume Profile: Heavy selling at $3,350-3,375
1-Hour Chart Analysis
Major Structure: ABC correction in progress
Current Position: C-wave development
Fibonacci Target: $3,285 (127.2% extension)
Bollinger Bands: Price touching lower band
Stochastic: Oversold but no divergence yet
4-Hour Chart Analysis
Macro Trend: Still bullish above $3,200
Correction Depth: 23.6% retracement maximum expected
Support Zone: $3,280-3,300 (confluences)
Resistance Zone: $3,375-3,390 (proven strong)
Ichimoku: Price approaching cloud support
TECHNICAL INDICATORS MATRIX
Momentum Indicators
RSI (4H): 42 (Neutral-Bearish)
RSI (1H): 35 (Oversold approaching)
Stochastic: %K: 28, %D: 35 (Oversold)
Williams %R: -75 (Strong oversold)
Trend Indicators
MACD (4H): Bearish crossover pending
ADX: 28 (Moderate trend strength)
Parabolic SAR: $3,365 (Sell signal if broken)
Volume Indicators
OBV: Declining (distribution pattern)
Volume Rate of Change: Negative
Accumulation/Distribution: Slight distribution
KEY SUPPORT & RESISTANCE LEVELS (24H)
Immediate Resistance Levels
R1: $3,365 (Previous support turned resistance)
R2: $3,375 (Major psychological & Gann resistance)
R3: $3,390 (Recent swing high)
R4: $3,410 (Extended resistance)
Critical Support Levels
S1: $3,330 (Immediate support)
S2: $3,300 (Psychological & Fibonacci)
S3: $3,285 (Major harmonic & Gann target)
S4: $3,260 (Extended support)
24-HOUR TRADING SCENARIOS
Scenario 1: Bearish Breakdown (60% Probability)
Trigger: Break below $3,330 with volume
Target 1: $3,300-3,310
Target 2: $3,285-3,290
Extended Target: $3,260-3,270
Stop Loss (Shorts): Above $3,370
Scenario 2: Range-Bound Consolidation (25% Probability)
Range: $3,320-3,375
Strategy: Fade extremes
Buy Zone: $3,320-3,330
Sell Zone: $3,365-3,375
Breakout Confirmation: Volume spike
Scenario 3: Bullish Reversal (15% Probability)
Trigger: Break above $3,375 with volume
Target 1: $3,390-3,400
Target 2: $3,410-3,420
Invalidation: Below $3,285
RISK FACTORS & CATALYSTS (24H)
Bearish Catalysts
US Dollar strength continuation
Risk-off sentiment from geopolitical tensions
Profit-taking ahead of weekend
Technical breakdown confirmation
Bullish Catalysts
Safe-haven demand surge
US Dollar weakness
Central bank buying speculation
Technical oversold bounce
High-Impact Events (Next 24H)
Asian market opening sentiment
US Dollar Index movement
Cryptocurrency correlation effects
Weekend gap analysis
TRADING RECOMMENDATIONS (24H)
For Scalpers (5M-15M)
Strategy: Fade bounces to resistance
Entry: $3,355-3,365 area
Target: $3,335-3,340
Stop: $3,375
Risk/Reward: 1:2
For Swing Traders (1H-4H)
Primary Setup: Short on retracement
Entry Zone: $3,350-3,360
Target 1: $3,300
Target 2: $3,285
Stop Loss: $3,385
Conservative Approach
Wait for: Clear breakdown below $3,330
Entry: $3,325 (confirmation)
Target: $3,285-3,290
Stop: $3,345
CONFLUENCE FACTORS
Bearish Confluence at $3,285
Harmonic Bat pattern completion (88.6% level)
Gann Square of Nine critical angle
Elliott Wave 3 = 1.618 × Wave 1 target
Fibonacci 78.6% retracement level
Previous significant support area
Wyckoff markdown initial target
Resistance Confluence at $3,375
Gann 90-degree angle resistance
Harmonic pattern resistance
Elliott Wave corrective high
Previous breakout level
Psychological round number
FINAL 24H FORECAST SUMMARY
Expected Price Action: Controlled decline toward $3,285-3,300 support zone with potential for brief consolidation before further weakness.
Primary Targets (Downside):
First: $3,300-3,310
Second: $3,285-3,290
Extended: $3,260-3,270
Key Invalidation: Sustained break above $3,375 would shift bias bullish toward $3,390-3,410.
Risk Management: Position sizing should be conservative due to high volatility expectations and weekend gap risks.
Probability Assessment:
60% - Bearish scenario
25% - Sideways consolidation
15% - Bullish reversal
Disclaimer: This analysis is for educational purposes only. Gold trading involves substantial risk. Always use proper risk management and never risk more than you can afford to lose.
Volume profile resistance

Looking Over Gold Expectations for the coming Week!Last week had a solid play of moves. Ultimately closing out around 50% of its overall movement. Looking for price to continue with more bullish activity as we come into a new week. Keeping in tune to find areas I can take advantage and get active.

Monday market forecast, pay attention to the 3339 retracement📰 News information:
1. The Trump administration puts pressure on the Federal Reserve to cut interest rates
2. The continued impact of tariffs and the responses of various countries
📈 Technical Analysis:
This week's basic judgment and forecast on the gold market trend were consistent, but on Friday, the overall gold fluctuations were not large. The overall trend of the daily line fluctuated around 3345, and the 3345 line also became a short-term long-short watershed. Although prices are likely to rise more easily than fall in the short term, it should be noted that the three-month adjustment cycle is coming to an end while the fundamentals of the bull market have not changed. It is recommended that you focus on preventing risks from short position operations next week. At the same time, the overall strong shock pattern, the anti-pulling momentum has not reached the top suppression position, and the area around 3339 below is the previous intensive trading area, which constitutes a certain support in the short term. If the market fails to effectively break below next week, it will greatly boost the bullish momentum, and it is not ruled out that there will be a possibility of refreshing the high point near 3380 next week.
On the whole, the short-term focus next week is the 3345-3335 area below. If it falls back to this point, you can consider arranging long orders. The short-term target is 3355-3365, and the strong trend is expected to continue to touch 3375-3385.
🎯 Trading Points:
BUY 3345-3335
TP 3355-3365-3375-3385
In addition to investment, life also includes poetry, distant places, and Allen. Facing the market is actually facing yourself, correcting your shortcomings, confronting your mistakes, and strictly disciplining yourself. I hope my analysis can help you🌐.
TVC:GOLD PEPPERSTONE:XAUUSD FOREXCOM:XAUUSD FX:XAUUSD OANDA:XAUUSD FXOPEN:XAUUSD

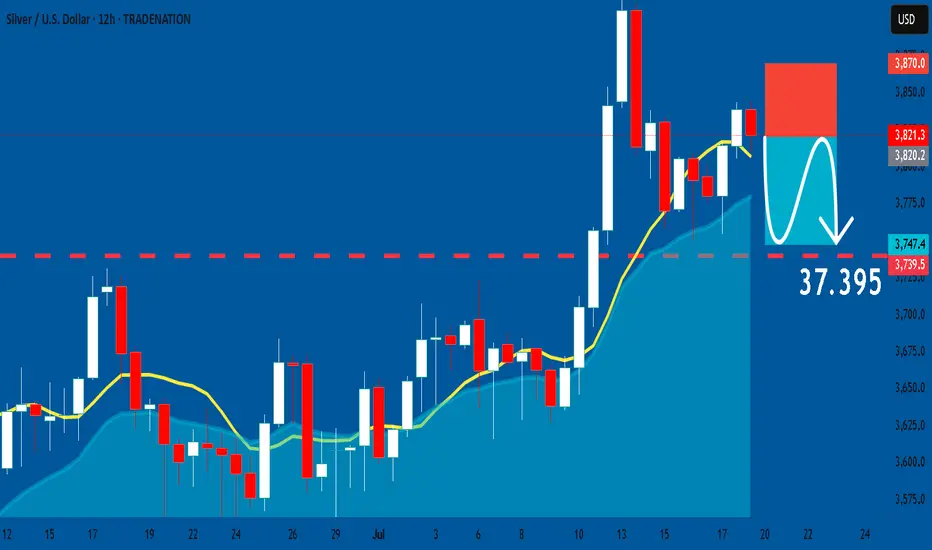
SILVER: Short Trade with Entry/SL/TP
SILVER
- Classic bearish setup
- Our team expects bearish continuation
SUGGESTED TRADE:
Swing Trade
Short SILVER
Entry Point - 38.213
Stop Loss - 38.700
Take Profit - 37.395
Our Risk - 1%
Start protection of your profits from lower levels
Disclosure: I am part of Trade Nation's Influencer program and receive a monthly fee for using their TradingView charts in my analysis.
❤️ Please, support our work with like & comment! ❤️
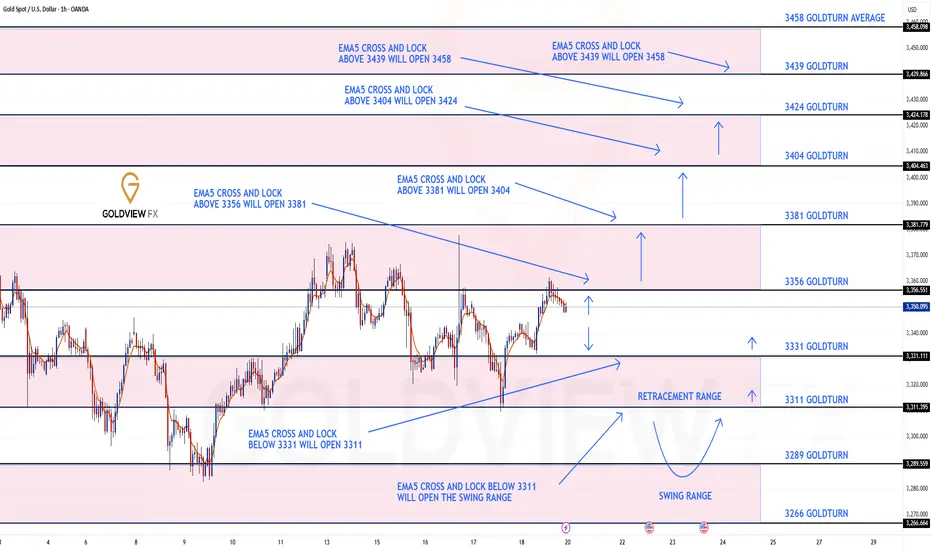
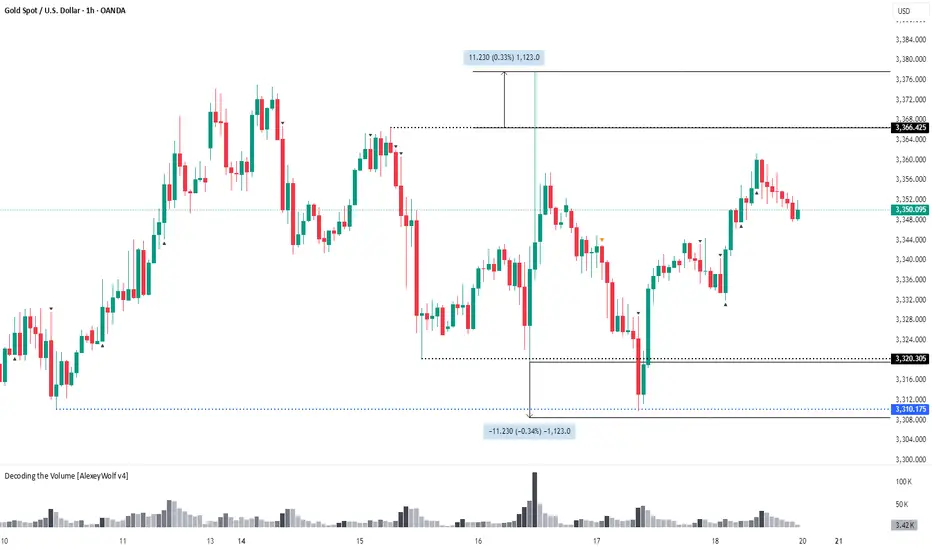
GOLD 1H CHART ROUTE MAP UPDATE & TRADING PLAN FOR THE WEEKHey Everyone,
Please see our updated 1h chart levels and targets for the coming week.
We are seeing price play between two weighted levels with a gap above at 3356 and a gap below at 3331. We will need to see ema5 cross and lock on either weighted level to determine the next range.
We will see levels tested side by side until one of the weighted levels break and lock to confirm direction for the next range.
We will keep the above in mind when taking buys from dips. Our updated levels and weighted levels will allow us to track the movement down and then catch bounces up.
We will continue to buy dips using our support levels taking 20 to 40 pips. As stated before each of our level structures give 20 to 40 pip bounces, which is enough for a nice entry and exit. If you back test the levels we shared every week for the past 24 months, you can see how effectively they were used to trade with or against short/mid term swings and trends.
The swing range give bigger bounces then our weighted levels that's the difference between weighted levels and swing ranges.
BULLISH TARGET
3356
EMA5 CROSS AND LOCK ABOVE 3356 WILL OPEN THE FOLLOWING BULLISH TARGETS
3381
EMA5 CROSS AND LOCK ABOVE 3381 WILL OPEN THE FOLLOWING BULLISH TARGET
3404
EMA5 CROSS AND LOCK ABOVE 3404 WILL OPEN THE FOLLOWING BULLISH TARGET
3424
EMA5 CROSS AND LOCK ABOVE 3424 WILL OPEN THE FOLLOWING BULLISH TARGET
3458
BEARISH TARGETS
3331
EMA5 CROSS AND LOCK BELOW 3331 WILL OPEN THE FOLLOWING BEARISH TARGET
3311
EMA5 CROSS AND LOCK BELOW 3311 WILL OPEN THE SWING RANGE
3289
3266
As always, we will keep you all updated with regular updates throughout the week and how we manage the active ideas and setups. Thank you all for your likes, comments and follows, we really appreciate it!
Mr Gold
GoldViewFX
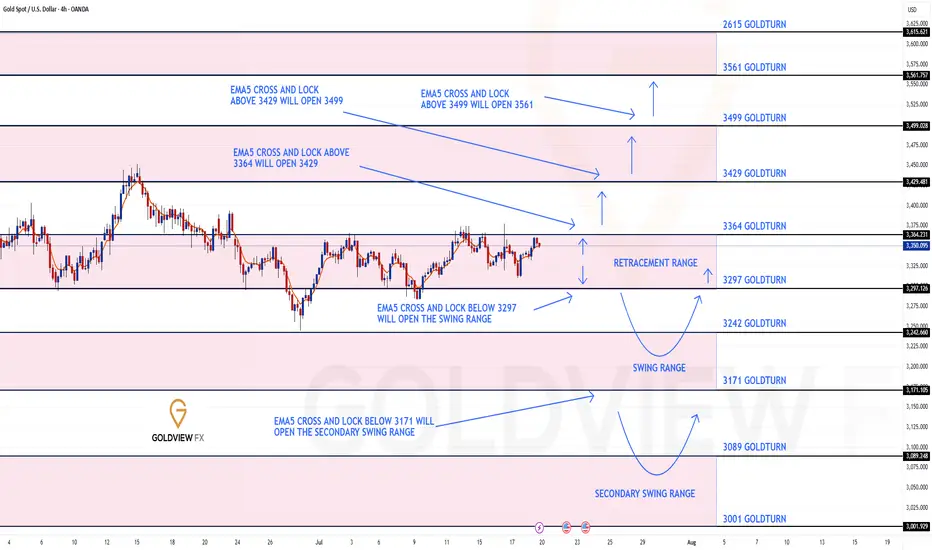
GOLD 4H CHART ROUTE MAP UPDATE & TRADING PLAN FOR THE WEEKHey Everyone,
Please see our updated 4h chart levels and targets for the coming week.
We are seeing price play between two weighted levels with a gap above at 3364 and a gap below at 3297. We will need to see ema5 cross and lock on either weighted level to determine the next range.
We will see levels tested side by side until one of the weighted levels break and lock to confirm direction for the next range.
We will keep the above in mind when taking buys from dips. Our updated levels and weighted levels will allow us to track the movement down and then catch bounces up.
We will continue to buy dips using our support levels taking 20 to 40 pips. As stated before each of our level structures give 20 to 40 pip bounces, which is enough for a nice entry and exit. If you back test the levels we shared every week for the past 24 months, you can see how effectively they were used to trade with or against short/mid term swings and trends.
The swing range give bigger bounces then our weighted levels that's the difference between weighted levels and swing ranges.
BULLISH TARGET
3364
EMA5 CROSS AND LOCK ABOVE 3364 WILL OPEN THE FOLLOWING BULLISH TARGETS
3429
EMA5 CROSS AND LOCK ABOVE 3429 WILL OPEN THE FOLLOWING BULLISH TARGET
3499
EMA5 CROSS AND LOCK ABOVE 3499 WILL OPEN THE FOLLOWING BULLISH TARGET
3561
BEARISH TARGETS
3297
EMA5 CROSS AND LOCK BELOW 3297 WILL OPEN THE SWING RANGE
3242
3171
EMA5 CROSS AND LOCK BELOW 3171 WILL OPEN THE SECONDARY SWING RANGE
3089
3001
As always, we will keep you all updated with regular updates throughout the week and how we manage the active ideas and setups. Thank you all for your likes, comments and follows, we really appreciate it!
Mr Gold
GoldViewFX
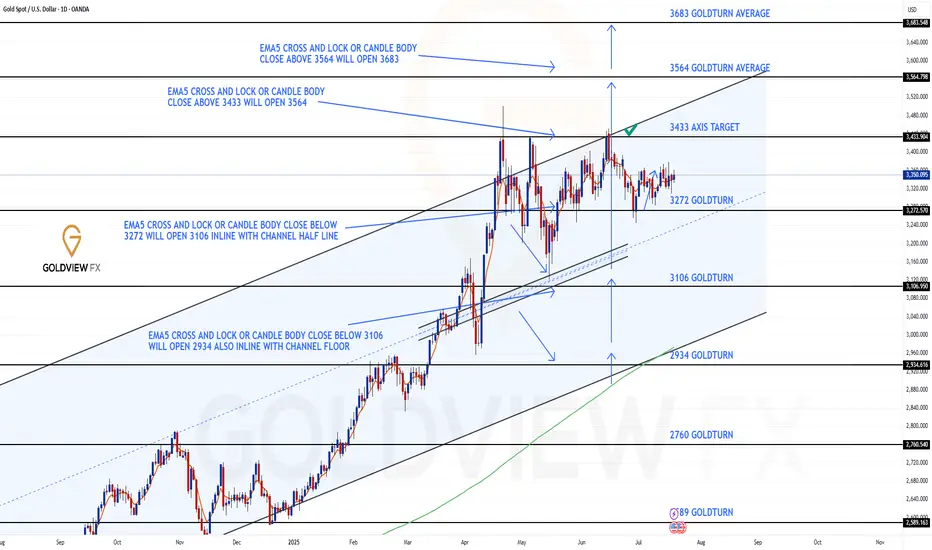
GOLD DAILY CHART ROUTE MAPHey Everyone,
Daily Chart Follow-Up – Structure Still in Full Control
Just a quick update on our daily structure roadmap. Price continues to respect our Goldturn levels with surgical precision.
After the previous bounce off 3272, we saw over 800 pips of upside follow through. That level once again proved its weight, holding beautifully as support and launching price firmly back toward the upper boundary.
Since last week’s update, nothing has changed structurally – the range remains intact and fully respected. Price is still trading between the well defined 3272 support and the untested 3433 resistance. We’ve yet to revisit 3433, which remains our key upside target and a potential inflection point.
Here’s what we’re focusing on next:
🔹 Range scenario active:
Until price breaks out cleanly, we anticipate continued swings between 3433 resistance and 3272 support. This remains the active range setup.
🔹 EMA5 cross and lock:
We’re still watching for a decisive EMA5 break and lock. Without that, we expect more range-bound action rather than a breakout.
🔹 Structure remains intact:
No EMA5 breakdown off 3272 during the recent retest means buyers are still in control. Dips into 3272 remain valid long entries within this structure.
Key Levels This Week
📉 Support – 3272
Proven bounce zone. Continues to hold structure. As long as this holds, the bias remains constructive.
📈 Resistance – 3433
Open gap + channel top confluence. Still untested. Watching for a reaction or breakout confirmation here.
Thanks again for all the continued support, your likes, comments, and follows mean the world.
Wishing you another focused and profitable week ahead!
Mr Gold
GoldViewFX
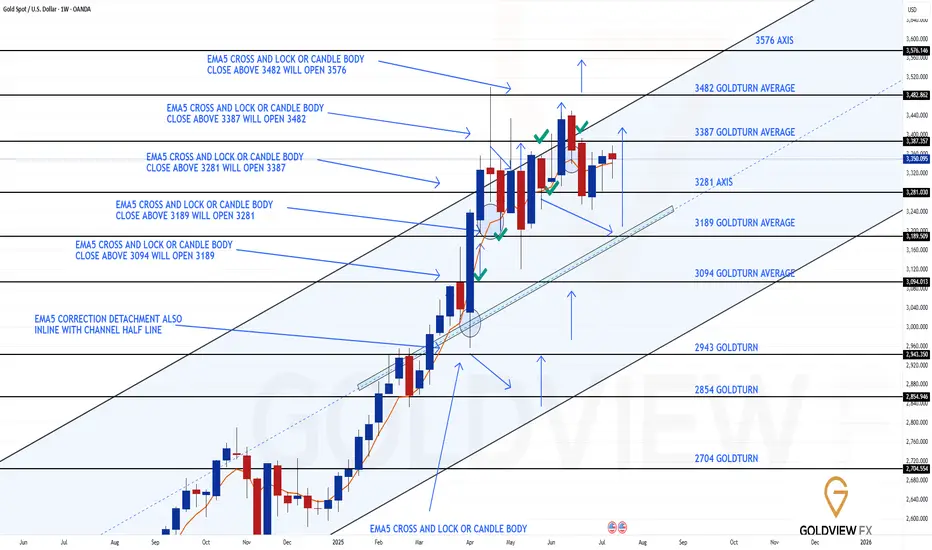
GOLD WEEKLY CHART MID/LONG TERM ROUTE MAPHey Everyone,
Please see update on our Weekly Chart idea.
As of now, nothing has changed structurally, the framework remains fully intact, and price continues to trade cleanly within the defined range.
After delivering a rejection at the channel top, price pulled back into 3281 support, where buyers once again stepped in decisively. That level held firm on a weekly closing basis, validating it as a reliable pivot and launching price back into bounce mode.
Despite the progress, we’ve yet to test the 3387 gap, which continues to act as a short term magnet. The longer range gap at 3482 also remains open and in focus as the larger objective.
Key takeaways from the current structure:
🔹 Structure unchanged:
The rising channel remains orderly. EMA5 still hasn’t locked bearishly, and the mid-line continues to climb beneath price, maintaining a constructive bias.
🔹 Support confirmed – 3281:
Held for a second time, reaffirming its significance in the broader structure.
🔹 3387 gap still in play:
While price is gravitating toward this zone, it has not yet been tested. Expect a reaction on first contact.
Updated Levels to Watch:
📉 Immediate Support – 3281
Held again, reinforcing its status as the key structural axis.
📈 Resistance 1 – 3387
Still untested. Remains the active near term target.
📈 Resistance 2 – 3482
Unfilled weekly gap and broader objective.
Plan:
As long as 3281 continues to hold, the bias remains for a measured grind higher toward 3387 and, eventually, 3482. If 3281 fails, we’ll reassess at the rising mid line for the next structured long opportunity.
As always, we will keep you all updated with regular updates throughout the week and how we manage the active ideas and setups. Thank you all for your likes, comments and follows, we really appreciate it!
Mr Gold
GoldViewFX
Gold-Bullish Leg to ContinueGold is Bullish. a minor pullback may happen before it continues its leg up. Looking at uncertainty at global level, Gold might push to 3400.
Gold. 3310 reaction & will Buyers reach their remaining targets?Hi traders and investors!
The 3310 level worked out perfectly. We can see a familiar buy pattern forming.
If the buyer fails to push the price higher and the seller returns to the 3310 level, it's likely that the price will continue to decline on the daily timeframe toward the next nearest targets — 3244, or more likely, 3154.
For now, however, we still expect the buyer to pursue the remaining unmet targets at 3393 and 3403.
This analysis is based on the Initiative Analysis concept (IA).
Wishing you profitable trades!
HelenP I. Gold will little correct and then rise to top of wedgeHi folks today I'm prepared for you Gold analytics. If we look at the chart, we can see a clear ascending wedge pattern that has been guiding the price action. The structure is well-defined by a lower trend line providing consistent support and an upper resistance line. I believe that the key area to watch right now is the support zone between 3310 and 3295 points. The logic is that after the recent push, the price may undergo a small, healthy correction to test this zone's strength. The condition for our bullish scenario to unfold is a successful hold of this support; a bounce or signs of buyer interest in this area would be the confirmation we are looking for. Once this condition is met, I believe that gold will have enough momentum to continue its upward movement within the confines of the wedge. Therefore, the main goal for this scenario is set at 3415 points. This target is not arbitrary; it directly coincides with the resistance line of the wedge, which represents a logical point for the current upward swing to conclude. If you like my analytics you may support me with your like/comment.❤️
Disclaimer: As part of ThinkMarkets’ Influencer Program, I am sponsored to share and publish their charts in my analysis.

GOLD (XAUUSD): Sticking to the Plan
Update for my last Sunday's post for Gold.
Previously, we spotted a cup & handle pattern on a daily time frame.
It turned into an ascending triangle pattern - another bullish formation this week.
I am sticking to the same plan - our strong bullish signal is a breakout
of a neckline of the pattern and a daily candle close above 3378.
It will confirm a strong up movement.
❤️Please, support my work with like, thank you!❤️
I am part of Trade Nation's Influencer program and receive a monthly fee for using their TradingView charts in my analysis.

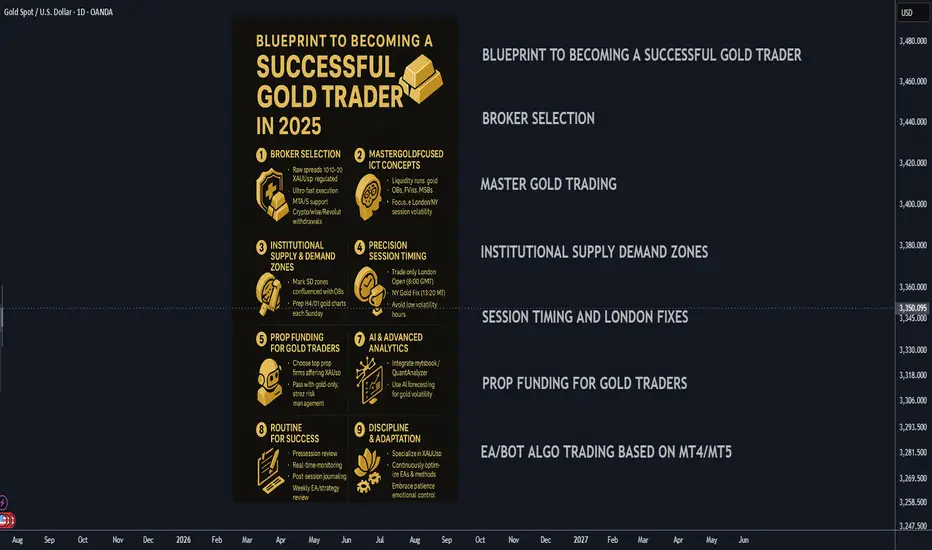
Blueprint to Becoming a Successful Gold Trader in 2025🚀 Blueprint to Becoming a Successful Gold Trader in 2025
A strategic, step-by-step plan to master gold trading by combining institutional concepts, cutting-edge automation, and the best prop funding opportunities for XAUUSD.
________________________________________
🏦 Broker Selection (Gold-Specific)
• 🔍 Choose Brokers Offering Raw Spread XAUUSD Accounts:
Seek brokers with raw/zero spread gold trading or tight gold spreads (0.10-0.30 average) with deep liquidity.
• ⚡ Prioritize Ultra-Fast Execution for Metals:
Confirm broker servers are in NY4/LD4 and latency is optimized for gold volatility spikes.
• 🛡️ Verify Regulation & Execution:
ASIC, FCA, FSCA preferred; check for proof of XAUUSD execution quality (Myfxbook/FXBlue verified).
• 📊 MetaTrader 4/5 Gold Support:
Ensure MT4/5 platform offers tick-chart precision for gold and supports custom EAs/indicators.
• 💳 Flexible Withdrawals/Payouts:
Crypto, Wise, and Revolut compatibility for fast, secure funding.
________________________________________
🎯 Gold Trading Strategy (ICT + Supply/Demand Zones)
• 🧠 Master Gold-Adapted ICT Concepts:
o Liquidity runs and stops at London/NY session highs/lows
o XAUUSD-specific Order Blocks (OBs), FVGs, and Market Structure Breaks (MSB)
• 📍 Map Institutional Supply-Demand Zones:
Gold reacts violently to these—align SD zones with ICT Order Blocks for best confluence.
• 📐 Precision Entries:
Only enter after liquidity sweeps at key XAUUSD levels (H4/D1), avoiding choppy retail entries.
• 📈 Time & Price for XAUUSD:
Focus exclusively on London Open (8:00 GMT) and NY Open/Gold Fixing (13:20 GMT)—peak volatility windows.
• 📆 Weekly Preparation:
Annotate D1/H4 gold charts every Sunday with clear OBs, liquidity points, and SD zones for the week.
________________________________________
💰 Prop Funding for Gold Trading
• 🥇 Select Firms Offering XAUUSD with Tight Rules:
Choose FTMO, The Funded Trader, MyFundedFX, or similar with high leverage and XAUUSD trading enabled.
• 📑 Pass Evaluation with Gold-Only Strategy:
Use high-probability, low-frequency XAUUSD trades—1-3 setups per week, strict risk parameters.
• 🎯 Risk Management:
Max 1% risk/trade, stop trading after 2 consecutive losses—protect account and pass evaluations.
• 📊 Analytics Monitoring:
Use prop dashboards (FTMO Metrics, FundedNext stats) to review XAUUSD trade stats and adjust.
• 📚 Diversify Funded Accounts:
Split funded capital among multiple firms to hedge against firm-specific risk and maximize payouts.
________________________________________
⚙️ Automating Gold Trading (MT4/5 EAs & Bots)
• 🛠️ Hire MQL4/5 Developers for XAUUSD EAs:
Code bots focused on gold-specific ICT (OBs, FVGs, London/NY volatility).
• 🤖 Develop EAs for Gold:
o OB/FVG/Market Structure detection on XAUUSD
o Supply/Demand zone algo entries
o Gold breakout EAs for session openings
• 📌 Trade Management Automation:
o Entry, stop loss, partial TP, BE, trailing for gold’s high volatility
o Dynamic lot-sizing by daily ATR
• 📡 VPS Hosting Near Broker’s Gold Server:
Use NY4/LD4 VPS for lowest latency (ForexVPS, Beeks).
• 📈 Quarterly Forward-Testing:
Optimize EAs in demo before live trading, retest on every major gold volatility shift (FOMC, CPI).
________________________________________
📲 Leveraging Bots & AI in 2025
• 📊 Integrate with MT4/5 Analytics Tools:
Use myfxbook, QuantAnalyzer for detailed gold trade breakdowns.
• 🔮 AI-Based Gold Forecasting:
Layer in machine learning models (e.g., TensorTrade, TradingView AI) to anticipate session volatility and direction.
• 🔔 Real-Time Alert Bots:
Set up Telegram/Discord bots for instant notification of ICT-based XAUUSD signals.
• 🧑💻 Manual Oversight:
Always review high-impact news (NFP, CPI, FOMC) and override automation when macro risk spikes.
• 🔄 Continuous Bot Updates:
Retrain your EAs monthly on latest XAUUSD price action to maintain edge.
________________________________________
🗓️ Daily Gold Trader Routine
• 🌅 Pre-Session (30 mins):
Review annotated gold charts, key session highs/lows, OB/FVG/SD levels, and upcoming news.
• 💻 During Session:
Monitor bot execution, validate setups manually, manage risk during NY/London overlap.
• 📝 Post-Session (15 mins):
Journal gold trades, note reasoning for entry/exit, emotional state, and lessons learned.
• 📆 Weekly Review:
Assess overall gold trading stats and EA performance, adjust strategy as needed.
• 📚 Continuous Learning:
Stay updated on ICT, gold market fundamentals, and new trading tech.
________________________________________
📌 Final Success Advice for 2025
• 🔍 Specialize in XAUUSD/Gold—Don’t Diversify Randomly:
Depth > Breadth—become a true gold trading expert.
• 🚩 Keep Adapting Your Gold Trading EAs:
Markets change—so must your bots and playbooks.
• 🧘 Stay Patient, Disciplined, and Selective:
Gold rewards precision and patience, not overtrading.
• 💡 Embrace AI & Automation:
Leverage every tool: AI, analytics, and custom EAs for a real 2025 trading edge.
XAUUSDgold has played over a week and finally took a long as we know it will fly on wednesday but trap with seller.. i am looking for continue long on gold, as i have drw simple line reason is clear w pattern,, and the (bos) .. lets see is it flying without fvg, or lit a bit to fill the fuel..what are your thought let me know in the comment.

GOLD SNIPER PLAN – July 21, 2025Hey, GoldMinds! 🔥
This isn’t just another range day — it’s the type of market that separates disciplined snipers from impulsive chasers. If you want an edge, you need a plan that’s both sharper and more refined than what most see on their charts.
After a week full of fake breakouts, confusing swings, and whipsaw price action, gold is giving us the gift of clarity — but only for those patient enough to let the market reveal itself. Here’s how you cut through the noise and focus on the only zones that actually pay.
🚩 SELL ZONES
1. Primary Supply: 3358–3370
This is the fortress where real sellers pushed back hard. The structure here is crystal clear: last week’s failed breakout, sharp rejection, and a textbook H1/M30 order block. You want the sniper entry? Wait for price to tap here and only short if you see an instant, aggressive bearish response on M15/M5 — not just a slow drift.
2. Upper Liquidity Trap: 3380–3395
Classic trap for late buyers. This is where price loves to sweep stops and trigger emotional FOMO — but the real professionals are only interested if the move fails hard. Watch for a fake breakout and sudden reversal; this is the sniper zone for “fade and run” shorts.
⚪ DECISION ZONE (Neutral / Pivot)
Pivot Range: 3335–3345
Forget this level — it’s where amateurs get chopped up. There’s no order block, no real fair value gap, just confusion and false hope. A true sniper waits here, watching, not acting.
🟢 BUY ZONES
1. Main Demand: 3326–3332
This is the engine room for bulls: a refined order block, evidence of real absorption, and a history of sharp reversals. Don’t try to anticipate — let price come here and look for a snapback move on M15/M5. This is where patient buyers take their shot.
2. Deep Demand: 3311–3320
Where the fear turns to opportunity. This zone sits under recent lows, home to panic sweeps and emotional selling. Only consider a long if you see a powerful, impulsive bounce. The risk is high, but the reward for perfect timing is even higher.
BIAS & EXECUTION
Bias: Neutral, but watch for range expansion — the market is coiling for a bigger move.
Execution:
– Only act at the true edges, never in the middle.
– Let M5/M15 price action prove your setup — the market owes you nothing.
– If a zone breaks with momentum, do not fight the flow; stand aside or prepare for the next edge.
FINAL SHOT
This is where discipline pays.
Sniper trading is about letting the market come to you and striking only when your zone lights up with confirmation. Every other move is just noise, meant to shake out the impatient. Drop a comment below with the zone you’re watching most , follow and🚀🚀🚀 GoldFxMinds for daily sniper maps, and remember: in gold, only real structure pays.
Disclosure: Charts powered by Trade Nation. Educational content only.
BTC/USD Fake out before Pump | Bullish Flag formationBTC/USDT (1D) Market Outlook – July 1, 2025
Introduction
BTC is currently consolidating within a bullish flag pattern after printing a swing high at 108.9K and a recent swing low at 98K. The price sits just below a major supply zone.
Context 1: Key Zones
Supply: 104.6K – 112.1K
Demand: 74.4K – 82.5K
Fair Value Gaps (FVG): 3 zones below price, with one near 88–90K
Context 2: Technical Confluence
Liquidation Zone: 106.2K
Golden Pocket (Fib 0.618): 102.1K
Psychological Levels: 105K and 110K
Context 3: Market Structure
Pattern: Bullish flag
Trend (LTF): Sideways/consolidation
Volume Profile: Heavy activity near 105K–110K
Bullish Scenario
Breaks above 106.2K (liq zone)
Pulls back to 102.1K (golden pocket), forms higher low
Retests resistance for continuation
Alt scenario: clean breakout above resistance → ATH retest
Bearish Scenario
Breaks below 106.2K and flag support
Fills FVG, breaks prior low at 98K
Triggers macro downtrend toward 88–90K zone
Summary
BTC is at a decision point inside a bullish flag, facing supply. A break above 106.2K favors upside continuation, while rejection and a lower low could trigger a deeper retracement. Watch key levels closely.

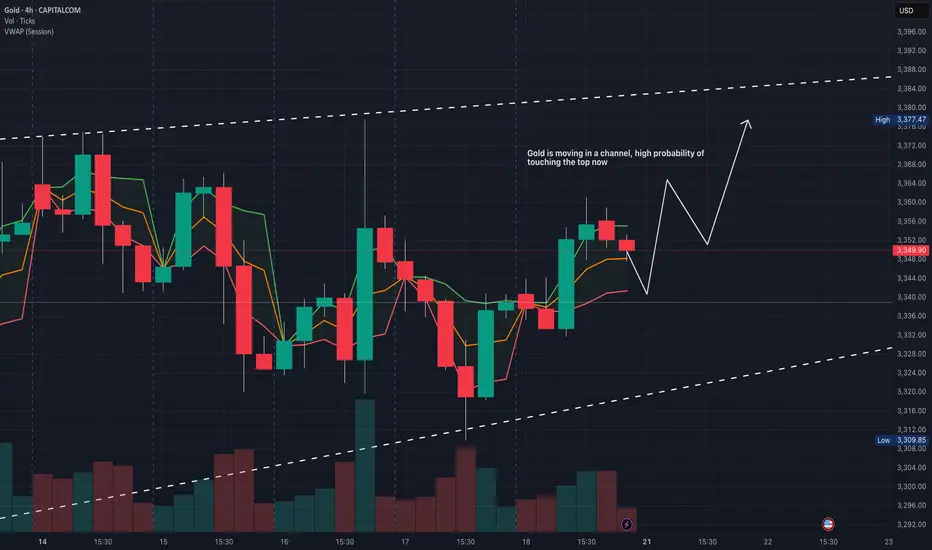
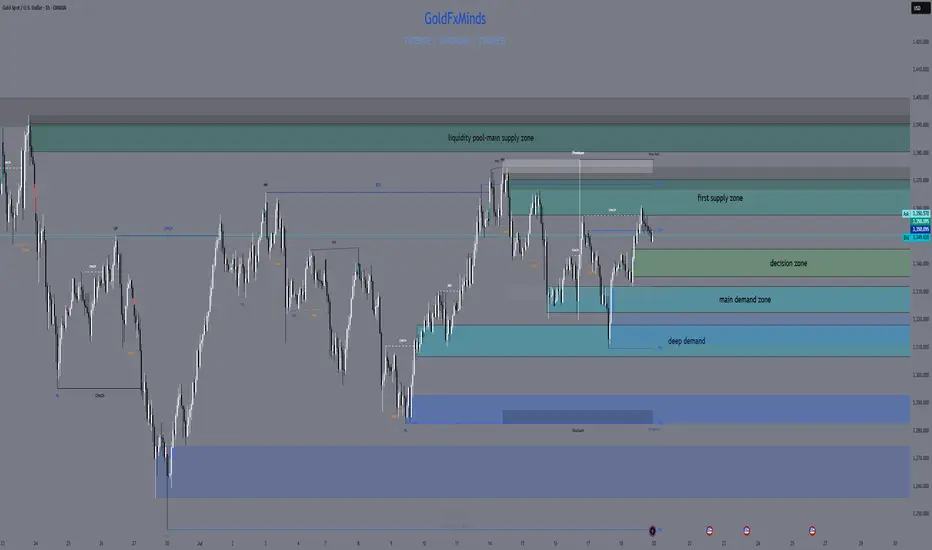
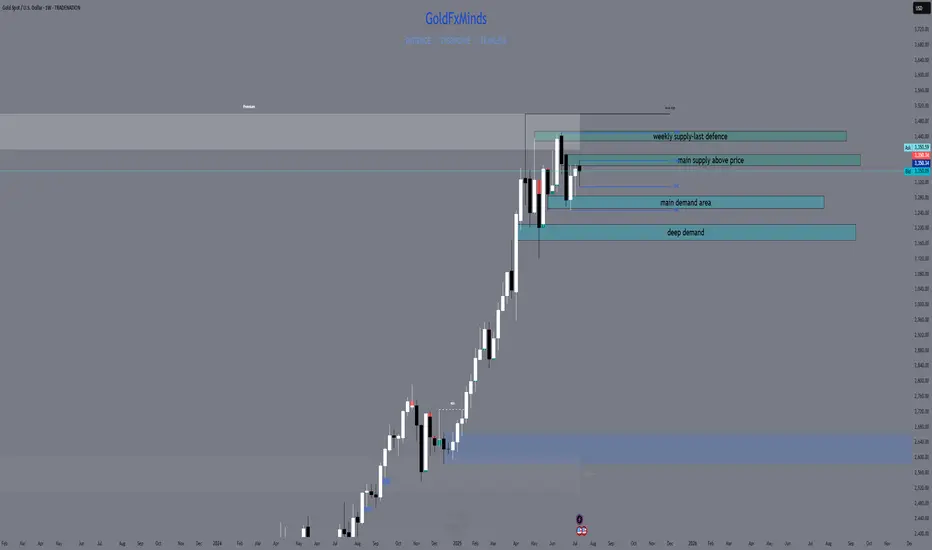
XAUUSD H4 Outlook – Full Structure & Macro | July 21, 2025Hello, GoldMinds! 💙
After a volatile week, gold remains caught in a wide H4 range, ping-ponging between structural supply and demand. Let’s break down the current picture so you can navigate the next big moves with confidence.
🌍 Macro & Bias
Macro context:
Last week’s US CPI print triggered a temporary rally, but gold failed to hold above resistance and quickly reversed as the dollar strengthened. Next week brings Fed Chair Powell’s testimony, global PMI numbers, and jobless claims—all catalysts for new volatility.
Bias:
Neutral on H4:
Gold is consolidating inside a broad sideways range.
The market is waiting for a catalyst to break above 3375 or below 3310 before showing a real trend.
🔸 Structural Key Supply Zones (Above Price)
1️⃣ 3357–3375 | Main H4 Supply
Why it matters:
Aggressive NY and CPI rallies have been sold off here; price rejected every attempt to close above 3375. OB, liquidity cluster, inducement—this is the first real ceiling above price.
Trade logic:
Watch for M15/H1 reversal or exhaustion. No clean break = supply remains active.
2️⃣ 3384–3400 | Macro Supply
Why it matters:
All failed breakouts from early summer were stopped in this block. Liquidity pool and macro OB; every test led to sharp pullbacks.
Trade logic:
Avoid FOMO—only short with confirmation of rejection.
3️⃣ 3410–3425 | Extreme Supply
Why it matters:
The final upper ceiling for now. Any spike here is likely to see big profit-taking and volatility.
🔹 Structural Key Demand Zones (Below Price)
1️⃣ 3330–3310 | Main H4 Demand
Why it matters:
All major dips last week bounced here—bulls are active in this OB. It’s the base of the current “micro-range,” with clear LTF inducement and high volume.
Trade logic:
Look for bullish reversal (M15/H1) before trusting any long from here.
2️⃣ 3295–3275 | Swing Demand / Discount Zone
Why it matters:
The main structure support for July. Strong OB, historic liquidity sweeps—each deep flush has brought responsive buyers.
Trade logic:
Watch for reaction, but don’t knife-catch without a clear structure break.
3️⃣ 3250–3225 | Extreme Demand / HTF Liquidity Pool
Why it matters:
The “final line” for bulls. This zone has absorbed all major liquidations and created swing reversals since early spring.
📊 H4 Structure Logic
Current play:
Gold is stuck in a structural cage between 3375 and 3310.
Until price closes outside these edges, every spike is likely a liquidity hunt.
Pro move:
Only react to confirmation in these zones—don’t force trades in the mid-range!
🧠 Game Plan
Set alerts at each supply & demand zone.
Wait for confirmation: M15/H1 CHoCH, BOS, wicks, or volume.
Let the news come to you: Powell & PMI will likely force a test of an edge; be patient.
💬 What’s your bias for the week? Drop it below and tag a friend!
🚀🚀🚀 and Follow GoldFxMinds for sniper-level gold planning and deep-dive SMC education.
Posted using the Trade Nation broker feed as part of their influencer program for using their TradingView charts in educational content.
— GoldFxMinds 💙
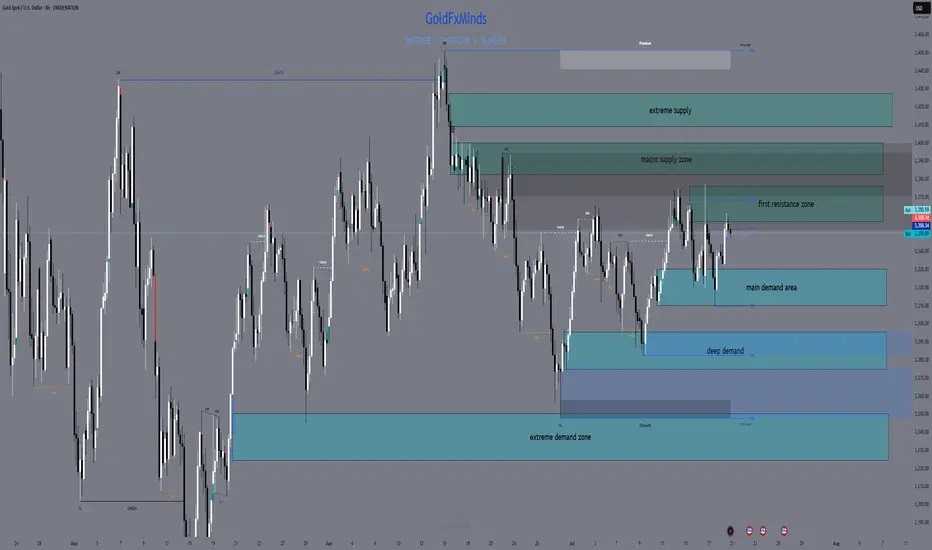
XAUUSD Daily Outlook – July 21, 2025Hey traders 💙
Gold continues to move inside a high timeframe range, with both bulls and bears defending structure at the edges. Price remains stuck between supply and demand — and only the strongest levels matter now. Here’s how the chart truly looks:
🔸 Key Supply Zones
1. 3380–3405: Main Daily Supply / Liquidity Pool Above
This is the top wall of the current range and the zone with the highest supply. Multiple failed breakouts, long upper wicks, and a clear cluster of liquidity just above. Unless we get a solid daily close above 3405, this area remains a trap for late buyers and a magnet for liquidity grabs.
2. 3355–3375: Internal Supply / Inducement Block
This zone has acted as an internal ceiling since the last CPI event. Here, price repeatedly failed to close above, and every return has produced quick rejections or fake breakouts. It often works as an inducement, catching breakout buyers and flipping the market lower.
🔹 Key Demand Zones
1. 3312–3300: Internal Demand / Mid-range Reaction
Here we see a clear reaction point where buyers have defended aggressively after CPI and NY session moves. It’s an internal demand area, often working as a temporary bounce or a place for stop hunts before larger moves.
2. 3275–3250: Main Daily Demand / Liquidity Pool Below
This is the base of the range, holding as support multiple times this month. Every dip into this zone has triggered large bounces, but the liquidity sitting below is also a key magnet for potential sweeps. Only a full daily breakdown here would flip the higher timeframe bias bearish.
📊 Technical Structure & Strategy
We are stuck between Main Supply (3380–3405) and Main Demand (3275–3250).
Every “middle” move is either inducement or a set-up for liquidity collection — not a real trend.
No daily close above 3405 → no bullish continuation.
No breakdown below 3250 → no clean bearish momentum.
Your edge: Only act when price confirms a reaction at a major zone with CHoCH/BOS, strong OB, or a liquidity sweep.
🧠 Takeaway:
This is not the time to guess direction — let the market show its intent at the edges. Use TradingView alerts on your key levels, be ready for volatility from macro news, and don’t get trapped in the mid-range games.
💬 Comment your bias or questions below.
Follow GoldFxMinds for more advanced XAUUSD updates and sniper-level education.
Stay patient, stay precise, and let structure work for you!
Posted using Trade Nation broker feed. As a participant in the Trade Nation Influencer program, I receive a monthly fee for using their TradingView charts in my educational content.
— GoldFxMinds 💙
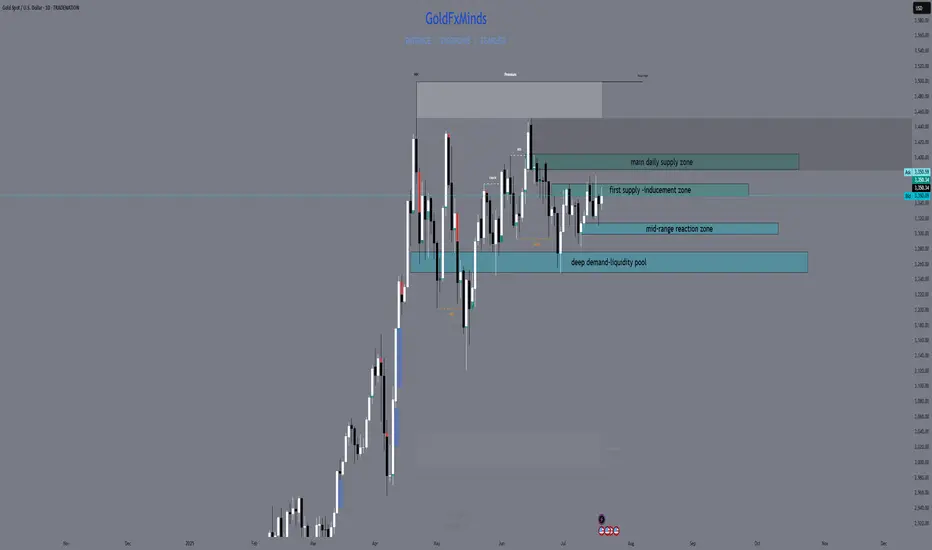
Weekly XAUUSD Outlook | July 21–25GoldFxMinds | Structure-Based HTF Plan
Hello traders,
This week we’re back in key HTF territory. Price is compressing inside a premium structure zone, between clean supply and demand areas. Trend is still bullish, but momentum is weakening — so we focus on structure to guide us.
🟨 Weekly Bias: Neutral | Range Structure in Play
We currently have no confirmed bullish or bearish bias on the weekly timeframe.
Gold remains trapped in a macro range between:
🟥 Upper Resistance Zone: 3355–3380
🟦 Lower Demand Zone: 3280–3240
Last week’s movement created a wick grab near 3375 followed by a strong push down, but without a clean break of structure — meaning we’re still inside a distribution–accumulation trap.
📌 Until we see a clear breakout (above 3380 or below 3280), the weekly bias remains neutral.
This is not a time to force directional trades on the weekly.
Instead, we wait for Daily and H4 confirmation, and position ourselves around the edges of this weekly range.
🔹 Last Week Recap
Weekly candle created a wick into 3377, rejecting just under previous week’s high. No BOS, no liquidity sweep with continuation — just a clear rejection inside supply, confirming premium trap.
Weekly candle closed with a top wick and small body — price is compressing under resistance. Still bullish structure, but not impulsive.
🔹 Weekly Key Structure Zones
🔸 3365–3390 (Supply)
→ Reason: Rejection from prior weekly high (3377), aligned with clean OB and FVG left behind from June breakout.
→ Structure context: No bullish BOS above 3375. This is now an unbroken supply zone with strong wick rejections. Liquidity sits above.
→ Use: Wait for price to tap back in → look for M15–H1 reaction for possible sell if no BOS above 3390.
🔸 3430–3450 (Supply - Last Line)
→ Reason: Unmitigated impulsive candle OB from prior macro swing high. This zone marks the final structure before a full continuation toward new highs.
→ Structure context: If this breaks with a strong BOS, macro structure flips bullish again.
→ Use: Only engage if price clears 3390 with strong volume and closes → watch this for last reaction zone.
🔸 3285–3260 (Demand)
→ Reason: Last bullish OB + FVG combo from early July, unmitigated. Price never retraced to this base since the rally.
→ Structure context: No BOS down yet, so this is still valid bullish origin.
→ Use: If price pulls back aggressively this week, watch this zone for LTF confirmation (CHoCH or BOS bullish). This would be a clean discount buy.
🔸 3210–3180 (Deep Demand)
→ Reason: Higher timeframe CHoCH origin zone, aligns with Fibonacci 61.8% retracement from entire May–July swing.
→ Structure context: Only in play if 3260 fails and we get clean BOS down on Daily.
→ Use: This is your swing buy zone if market breaks structure lower. Strong confluence for reaction.
🔹 HTF Structure Recap
Weekly trend: Still bullish (no BOS down), but compression under resistance
Structure range: Between 3390 and 3260 — price inside premium, no breakout yet
EMA Flow: Bullish but extended. Space for retracement.
RSI: Divergence above 3350 — supporting possible retrace.
🔹 Macro Events This Week
Tuesday: Powell speaks 🗣️ (volatility risk)
Thursday: Flash PMIs (usually directional)
Friday: Durable Goods & Home Sales 🏡
⚠️ Be patient on high-impact days. Let price come into your marked zones — don’t chase inside noise.
🔹 Summary & Plan
We are inside a macro range between 3390 (supply) and 3260 (demand). Structure is not broken — so we play both sides:
Sell Setup: If price taps back into 3365–3390 with no BOS → watch for reaction
Buy Setup: If price retraces into 3285–3260 → look for clean bullish CHoCH to validate
Middle area = chop. Wait for price to get to structure zones — don’t guess.
Thanks for reading 💛
We’ll drop daily and intraday outlooks once price moves closer to one of these structure zones. Until then:
🎯 Trade the reaction, not the prediction.
🔥 If you want these levels and sniper plans every day, follow , like 🚀🚀🚀 and drop a comment if you caught the move!
Stay focused, stay sharp, and never force a trade.
GoldFxMinds
EURJPY Hits Major Weekly Supply | Is the Bull Run Over?EUR/JPY – Institutional Macro Context (COT)
EUR (Euro)
Non-commercials net longs increased by +16,146 → strong buying.
Commercials added +25,799 long positions.
✅ Bias: Moderately bullish.
JPY (Japanese Yen)
Non-commercials decreased longs by -4,432.
Commercials cut -20,405 long contracts.
❌ Bias: Bearish pressure remains on JPY.
Conclusion (COT): EUR remains fundamentally strong, JPY structurally weak. Institutional flows favor long EUR/JPY, but positioning is stretched.
Seasonality (July)
EURJPY shows strong bullish seasonality in July, especially over the 2Y and 5Y averages (+1.03% and +0.66% respectively).
✅ Seasonality bias: Bullish.
Retail Sentiment
89% of traders are short on EUR/JPY.
Contrarian bias = bullish confirmation.
Technical Analysis (Weekly View)
Price is pushing into a major weekly supply zone around 172.50–173.00.
RSI still elevated but showing signs of weakening momentum.
Potential double top structure forming in confluence with liquidity grab.
First downside target sits around 169.50 (daily demand zone).
Awaiting a reaction in supply and confirmation for short.
Trading Plan (Top-Down)
Wait for price to reject the 172.50–173.00 area
Watch for bearish confirmation on Daily (engulfing or lower high)
Target: 169.50 zone
Risk: tight above 173.20 (invalidating supply zone)

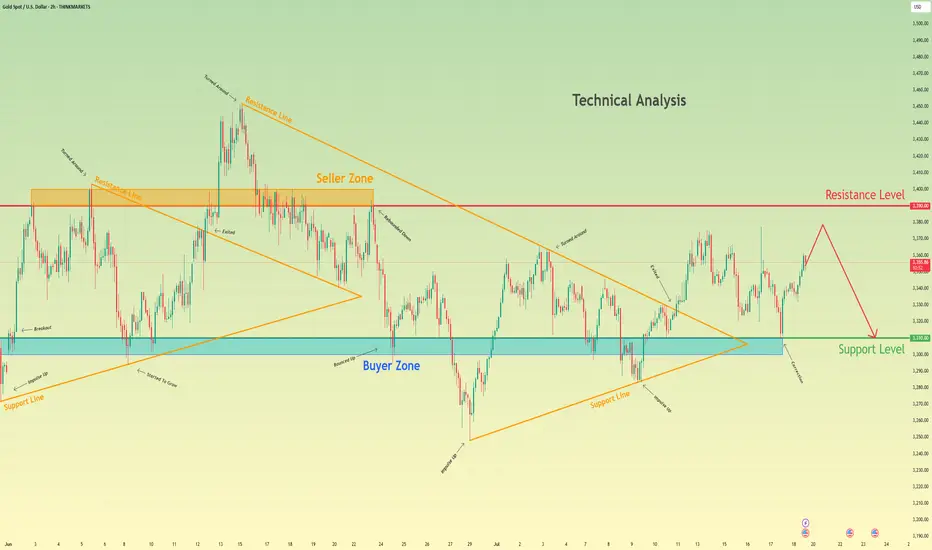
Gold may rise a little and then drop to support levelHello traders, I want share with you my opinion about Gold. Initially, gold was trading within a large consolidating pennant, showing both upward and downward impulses as it moved between the converging trend lines. The price eventually saw a breakout from this pattern, followed by a strong impulse up, but this momentum stalled as it approached the major horizontal resistance level at 3390. This level, which corresponds with the upper seller zone, has proven to be a significant barrier for buyers, rejecting the price and confirming a strong seller presence in that area. Currently, the market is in a corrective phase after being rejected from the highs. The price is drifting upwards once again in what appears to be a final retest of the aforementioned seller zone. This slow upward movement lacks the impulsive strength of the previous trend, suggesting that buyers are losing control and sellers are preparing to defend the 3390 resistance level once more. I expect this corrective move to fail upon reaching the seller zone around 3390. After this retest, I anticipate a sharp reversal and the beginning of a new downward trend. The logical target for this move is the major support level at 3310, an area that has historically acted as a strong buyer zone. That is why my TP is set at 3310. Please share this idea with your friends and click Boost 🚀
Disclaimer: As part of ThinkMarkets’ Influencer Program, I am sponsored to share and publish their charts in my analysis.