HelenP. I Gold may continue to decline to support levelHi folks today I'm prepared for you Gold analytics. After dropping from the support zone, the price of Gold found temporary support near the trend line and started to rise again. The upward movement was sharp and even created a gap while breaking through the previous support level, which then acted as resistance. For some time, the price hovered around this resistance area but failed to gain enough strength to break higher. Eventually, Gold pulled back to the trend line and began consolidating within a triangle pattern. Inside this structure, it managed to break above the resistance zone again, but this breakout turned out to be false. The price quickly reversed and dropped, breaking through the resistance level and exiting the triangle to the downside. This breakdown also shows that the bullish momentum has weakened significantly. Now, Gold is trading near the trend line again, showing hesitation and a lack of strong bullish continuation. Given this technical behavior, I expect a small rise toward the trend line, followed by a continued drop toward the support level at 3320. That’s the area I’m watching as my current goal. If you like my analytics you may support me with your like/comment ❤️
Disclaimer: As part of ThinkMarkets’ Influencer Program, I am sponsored to share and publish their charts in my analysis.
Metals

GOLD: Next Move Is Down! Short!
My dear friends,
Today we will analyse GOLD together☺️
The market is at an inflection zone and price has now reached an area around 3,303.99 where previous reversals or breakouts have occurred.And a price reaction that we are seeing on multiple timeframes here could signal the next move down so we can enter on confirmation, and target the next key level of 3,285.33..Stop-loss is recommended beyond the inflection zone.
❤️Sending you lots of Love and Hugs❤️

XAU/USD: Gold's Critical Decision Point! FOR JUNE 06, 2025 📊 CURRENT SNAPSHOT
---
🎯 THE SETUP: "Golden Triangle Breakout"
Gold is sitting at a CRITICAL JUNCTURE - trapped between major support and resistance levels, forming what I call the "Golden Pressure Cooker" pattern.
🔍 KEY LEVELS TO WATCH
🔴 RESISTANCE ZONE (The Ceiling)
* LWH (Last Week High): \$3,403.55 - Ultimate target
* LWL (Last Week Low): \$3,297.94 - Immediate resistance
* 4H FVG: \$3,350 area - Major supply zone
🟡 CURRENT BATTLEFIELD
* Price Action: Consolidating in tight range
* PWL (Previous Week Low): \$3,245.28 - Key pivot
🔴 DANGER ZONE (The Floor)
* DIE ZONE: \$3,121.70 - Critical support
* Break below = Major bearish signal
---
📈 MARKET STRUCTURE ANALYSIS
What the Chart is Telling Us:
1. 📊 Consolidation Phase: Gold has been ranging for several sessions
2. ⚡ 4H FVG Above: Acting as a magnet for price
3. 🎯 Triple Test: Price respecting the PWL level multiple times
4. 📉 Volume Decline: Typical before major moves
---
🚀 TRADING SCENARIOS
SCENARIO 1: "Golden Rocket" 🚀 (BULLISH)
IF price breaks above \$3,297.94 (LWL):
* Target 1: \$3,330- +1.2% gain
* Target 2: \$3,350(FVG) - +3.9% gain
* Stop Loss: \$3,280 - Risk: -0.5%
Risk/Reward: 1:1.8 ⭐⭐⭐
SCENARIO 2: "Golden Avalanche" 📉 (BEARISH)
IF price breaks below \$3,245.28 (PWL):
* Target 1: \$3,200 (Psychological level)
* Target 2: \$3,121.70 (Die Zone)
* Stop Loss: \$3,297.94 (LWL)
---
💡 SIMPLE TRADING PLAN
🎯 FOR BULLS (Buy Setup):
```
ENTRY: Break above $3,298 with volume
STOP: $3,285
TARGET 1: $3,330
TARGET 2: $3,360
🎯 FOR BEARS (Sell Setup):
```
ENTRY: Break below $3,245 with volume
STOP: $3,298 (LWL)
TARGET 1: $3,200
TARGET 2: $3,122 (Die Zone)
---
⚠️ RISK MANAGEMENT RULES
1. Position Size: Risk only 1-2% of account
2. Wait for Confirmation: Don't jump early
3. Volume is Key: Breakouts need volume
4. Time Limit: Close if no movement in 2 days
---
🔥 WHY THIS SETUP MATTERS
Gold is at a crossroads! The tight consolidation suggests big players are accumulating positions. When this range breaks, expect explosive movement in either direction.
Smart Money Clues:
* Multiple tests of PWL = Strong support
* 4H FVG above = Price magnet effect
* Low volume = Calm before the storm
---
📊 MARKET CONTEXT
* Dollar Weakness: Could fuel gold rally
* Economic Uncertainty: Safe haven demand
* Technical Setup: Clean breakout pattern
* Timeframe: Perfect for swing trades
---
🎯 MY VERDICT
Gold is COILED and ready to EXPLODE!
The setup favors the bullish scenario due to:
✅ Strong support holding at PWL
✅ 4H FVG acting as price magnet
✅ Multiple failed attempts to break lower
✅ Overall uptrend structure intact
But remember: Respect the levels and trade the breakout, not your bias!
---
🚨 ACTION ITEMS
1. Set Alerts: \$3,298 (bull trigger) & \$3,245 (bear trigger)
2. Watch Volume: Breakouts need confirmation
3. Be Patient: Wait for clean breaks
4. Have Both Plans: Ready for either direction
---
Trade Smart, Stay Safe! 🥇💰
The market rewards patience and punishes impatience.

GOLD - WAVE 5 BULLISH TO $3,734 (VIDEO UPDATE)Here’s an updated video analysis, as ‘Minor Wave 2’ is still forming & pulling back deeper into the $3,285 zone which I mentioned for you all last week.
We’ll be keeping an eye around this zone for a slow down in bearish momentum & if we get it, we’ll enter a buy trade. If momentum doesn’t slow down, we will let it go towards $3,245 & invalidate bullish structure. That way we know to look for sell’s 📉
TP1: $3,374
TP2: $4,300

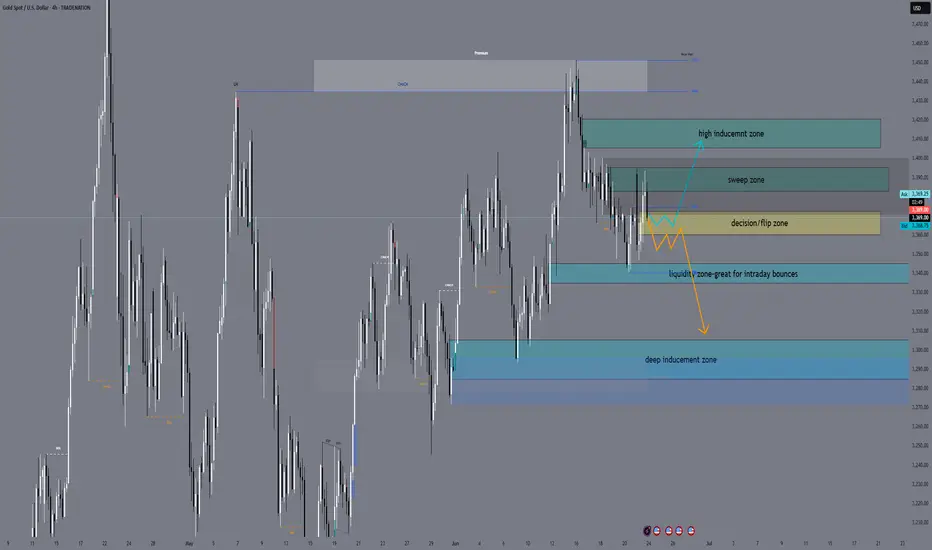
XAUUSD Daily Sniper Plan – June 24, 2025“Snipers wait. Structure tells the story.”
Hello traders! The market is stuck between the FOMC high at 3452 and the confirmed low at 3340. Price is compressing under H1 supply and above a key liquidity pocket. Here's your full plan with all sniper zones — now including a decision zone for intraday confirmation.
📰 Macro + Fundamental Context
Powell Testimony + multiple FOMC speeches today → high potential for dollar-driven volatility.
Inflation concerns and hawkish tone expected → short-term gold bearish pressure unless structure reclaims 3415+.
Smart money likely hunting liquidity both below 3340 and above 3400.
🔸 HTF Structure Summary (D1 → H4 → H1)
D1: Consolidation between 3452 and 3340. No new BOS.
H4: LL formed at 3340. LH not confirmed. Market is compressing under resistance.
H1: CHoCH + BOS confirmed. Current price sits in mid-range.
🔍 Sniper Entry Zones
🟥 Sell Zone 1: 3382–3395
H1 supply zone with previous rejection.
Includes order block + FVG.
Valid for new short entries if price returns and rejects.
🟥 Sell Zone 2: 3406–3420
High-risk spike zone from FOMC.
Only valid during fast, news-driven price movement.
Not a default entry unless confirmed rejection.
🟨 Decision Zone (Flip Area): 3360–3372
This is the key intraday flip level.
If price stays below, sell zones remain valid.
If price closes above, short bias is invalid and market may aim higher.
Use this zone to confirm bias before entering from either side.
🟩 Buy Zone 1: 3335–3345
Strong demand under equal lows.
OB + small imbalance on M15.
Valid for intraday long setups if confirmed with bullish price action.
🟦 Buy Zone 2: 3305–3285
H4 demand zone with major liquidity below.
Deep reversal area — only valid if price breaks 3340.
Smart money may be waiting here.
📌 Key Levels Summary
Zone Type Price Range Explanation
🔺 Premium OB 3450–3480 Daily supply zone
🟥 Sell Zone 1 3382–3395 Active H1 supply
🟥 Sell Zone 2 3406–3420 FOMC wick inducement
🟨 Flip Zone 3360–3372 Decision area — confirm bias
🟩 Buy Zone 1 3335–3345 Demand under equal lows
🟦 Buy Zone 2 3305–3285 H4 demand + deep liquidity
📣 Final Notes
📌 The market is at a critical moment. The flip zone (3360–3372) will decide tomorrow’s control: bear continuation or deeper retracement.
Watch price at the zone. Let the structure speak. Trade only where the logic is clean.
👁 Good luck in the market tomorrow, traders!
— GoldFxMinds
🟨 Disclosure: I am part of TradeNation’s Influencer Program and receive a monthly fee for using their TradingView charts in educational work.
GOLD: Long Signal Explained
GOLD
- Classic bullish formation
- Our team expects pullback
SUGGESTED TRADE:
Swing Trade
Long GOLD
Entry - 3306.4
Sl - 3294.6
Tp - 3332.6
Our Risk - 1%
Start protection of your profits from lower levels
Disclosure: I am part of Trade Nation's Influencer program and receive a monthly fee for using their TradingView charts in my analysis.
❤️ Please, support our work with like & comment! ❤️

Hanzo Drex | 15-Min Bullish Reversal Setup – 300 Pips in Sight🔥 Gold – 15 Min Scalping Analysis
⚡️ Objective: Precision Reversal Execution
Time Frame: 15 -Minute Warfare
Entry Mode: Only after verified Reversals
👌Bullish Reversal : 3397
Price must break liquidity with high volume to confirm the move.
☄️ Hanzo Protocol: Dual-Direction Entry Intel
➕ Zone Activated: Strategic liquidity layer detected — mapped through refined supply/demand mechanics. Volatility now rising. This isn’t noise — this is bait for the untrained. We're not them.
🦸♂️ Tactical Note:
The kill shot only comes after the trap is exposed and volume betrays their position.

XAUUSD: Market strategy and analysis on June 24Gold technical analysis
Daily chart resistance 3400, support 3286
4-hour chart resistance 3345, support 3304
1-hour chart resistance 3335, support 3315
B2 bombing was carried out over the weekend, the scale of the war expanded, and the ceasefire was directly stopped on Monday. The news is changing at any time. Now the market risk aversion has subsided, and the gold price has fallen rapidly!
The 3400 mark has been under pressure for many times and failed to break through. With the news of the ceasefire agreement, the short-term correction pressure has increased.
Today, gold directly fell below the 3340 support. The loss here means that the shorts will further develop momentum downward. Next, gold will focus on the second highest point of the 1-hour line rebound 3357 as a defense point. If it continues to fall and test the 3300 integer mark, you can try to buy.
SELL:3340near
BUY:3300near

Gold Challenges 2025 Trendline – Are We Breaking Lower?Following renewed Middle East ceasefire hopes and signs of exhausted buying momentum on the gold chart, the yellow metal has pulled back toward a key trendline—connecting higher lows since December 2024—currently near the 3,300 level.
If gold holds above 3,300 and continues to respect this broader trend support, the bullish trajectory may re-align, with potential upside targets at 3,400, 3,450, and 3,500.
However, a decisive close below 3,300 could signal a deeper corrective move. In that case, further downside may unfold toward 3,150, 3,050, 2,950, and 2,800, in line with the 1.272 and 1.618 Fibonacci extension levels derived from the April 2025 high, May 2025 low, and June 2025 high.
- Razan Hilal, CMT

Trade Idea: XAUUSD Short (SELL LIMIT) 1. Trend Alignment: H1 shows a clear down-trend — lower highs at 3446 → 3397 → 3347. SMAs on H1/M15 have turned down.
2. High-Probability Pullback: Price has broken the 3340 support twice and pulled back. Resistance here is offering a tight stop and plenty of room to TP.
3. Structural SL: Stop sits just above the prior swing high (~3350–3352)
Entry
Sell Limit @ 3340.37
Prior day low (now resistance) on H1 & M15
Stop Loss
3352.00
Just above the swing high around 3350–3351
Take Profit
3293.07
Invalidation
15 min candle close < 3310
Time Expiry
8:30 AM PST
Cancel if not triggered by then
FUSIONMARKETS:XAUUSD

GOLD falls after Trump's statement, but skepticism remainsOn Tuesday (June 24) in the Asian market, spot OANDA:XAUUSD continued to decline. The current price of gold is around 3,340 USD/ounce, down sharply by about 30 USD. Gold traders are awaiting congressional testimony from Fed Chairman Jerome Powell as the ceasefire between Iran and Israel takes place.
On Monday evening local time, US President Trump announced that Israel and Iran have reached a complete agreement to achieve a comprehensive ceasefire. After Trump announced the news, spot gold prices fell sharply by more than 30 USD in the early morning trading session in Asia on Tuesday, which lasted until the time of writing.
Federal Reserve Chairman Jerome Powell will deliver his semiannual monetary policy report before the House Financial Services Committee on Tuesday.
Looking ahead, all eyes will be on Federal Reserve Chairman Jerome Powell’s two-day congressional testimony starting on Tuesday for fresh clues on the timing of the next rate cut.
The market is now pricing in a 21% chance of a Fed rate cut next month, up from a 14.5% chance on Friday, according to CME Group’s FedWatch tool.
Additionally, markets will continue to closely monitor the Iran-Israel conflict to see if the ceasefire can hold. The Israeli military continues to report that Iran has launched ballistic missiles into Israel.
Technical Outlook Analysis OANDA:XAUUSD
Gold is down and operating around the EMA21 moving average and technically, gold is currently in the best support area. Specifically, gold is operating at the EMA21, the technical indicator is noted as an important support for the short-term uptrend, followed by the horizontal support of 3,320 USD. Combined with the price action position, the Relative Strength Index (RSI) is above 50, and 50 is now acting as a support in terms of momentum for the possibility of price increase.
However, if gold sells below the 0.382% Fibonacci retracement level, it could be bearish, with the next target being the 0.50% Fibonacci retracement level at $3,228. Therefore, the area of the $3,300 base point is a very important support area for the long-term uptrend.
Intraday, with the current position, gold can still increase in price with the short-term target at $3,371 followed by the $3,400 base point.
Notable positions will also be listed as follows.
Support: $3,300 – $3,292
Resistance: $3,350 – $3,371
SELL XAUUSD PRICE 3407 - 3405⚡️
↠↠ Stop Loss 3411
→Take Profit 1 3399
↨
→Take Profit 2 3393
BUY XAUUSD PRICE 3304 - 3306⚡️
↠↠ Stop Loss 3300
→Take Profit 1 3312
↨
→Take Profit 2 3318

High Probability BUY Zone at The Edge📍 XAUUSD – High Probability BUY Zone at The Edge
Gold is currently reacting at a high probability BUY area, supported by multiple technical confluences:
✅ $3,300 Round Number: Psychological level and historical reaction zone
✅ Completion of 2nd Bearish Leg: A classic two-leg correction often signals exhaustion
✅ Retest of Uptrend Boundary: Long-term ascending trendline that has supported price since March
📌 Entry: Current price zone
🎯 TP1: Local highs ($3,353)
🎯 TP2: Mid-channel or upper resistance zone ($3,398)
❌ SL: 3263
This is a textbook trend continuation setup — the structure remains bullish unless proven otherwise.
Wait for confirmation or manage your risk accordingly.
—
#XAUUSD #Gold #ForexTrading #MJTrading #TechnicalAnalysis #BuyZone #SwingTrade #SupportZone #TrendlineSupport #SmartMoney #PriceAction #ForexSignals #CommodityTrading #MarketStructure #RiskReward #ChartSetup #ForexCommunity

GOLD BUY BIAS • Demand Zone (Grey Box):
Price tapped into a clear demand/support zone around 3300–3310, showing rejection wicks and slowing bearish momentum.
• Reversal Expectation:
Bullish projection drawn on the chart suggests a potential rally if price holds above this zone.
• Upside Targets:
• First target: ~3390 (previous structure high)
• Next: ~3410–3440 (liquidity sweep area)

Everybody loves Gold Part 5Keeping it steady and reasonable
Part 5 weekly path is as shown.
Here's a breakdown of trading dynamics:
1. Expecting price to break past green line, level of significance (LOS) for continuation down
2. Price might bounce back for which; will be looking for a continuation from +50/+100 or +150pips to the downside
3. Will be looking for double tops/bottom along the way: Last week saw classic double top formed around level of significance (LOS)
As always price action determines trades

GoldKey Data Points:
Current Price: 3,309.065 USD
Open: 3,358.435 USD
High: 3,363.900 USD
Low: 3,307.295 USD
Change: +1.77% (+59,760 points)
Volume: Not explicitly stated but implied by "1B" (likely 1 billion units).
Price Action & Technical Observations:
Trend:
The price is currently below the open (3,309.065 vs. 3,358.435), suggesting a pullback after an intraday high of 3,363.900.
The +1.77% daily gain indicates overall bullish momentum, but the candle shows rejection near highs (wick formation).
Support/Resistance Levels:
Resistance:
Immediate: 3,362–3,375 USD (previous highs/profit targets).
Strong: 3,406–3,425 USD (key profit levels).
Support:
Immediate: 3,288–3,265 USD (labeled "Entity" and "Profit" zones).
Strong: 3,250 USD (psychological level).
Profit Targets:
The chart marks three profit-taking levels:
3,323 USD (minor), 3,362 USD (mid), 3,406 USD (major).
This suggests traders are eyeing these levels for potential reversals or take-profit actions.
Volume & Momentum:
The "+59,760" change with "1B" volume implies strong buying interest, but the long upper wick hints at selling pressure near highs.
Potential Scenarios:
Bullish Continuation:
If price holds above 3,288–3,265 USD, a retest of 3,362–3,406 USD is likely.
Bearish Reversal:
A break below 3,265 USD could trigger a drop toward 3,250–3,225 USD.


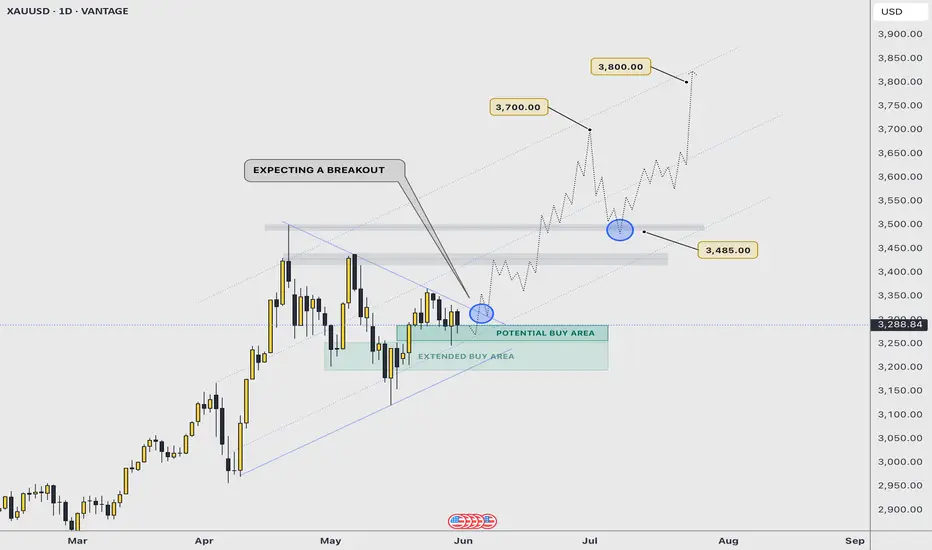
BREAKOUT SOON | $3700 - $3800 As illustrated, I’m visualising the next potential bullish continuation impulse that would take gold near the $4000 projected price.
In this idea, the path projected is based on the breakout of a rising symmetrical triangle that price formed; a strong bullish pattern that tends to be very effective when price successfully breaks out with strength.
On a fundamental aspect, things continue to hold the yellow metal on a positive route to maintain its bullish momentum and direction. Fed rates decision is getting close, and that is just the tip of the iceberg that’s going to move gold to record highs within weeks.
A key and major pivot area is near the $3200 - $3250 price range; so it’s possible we have one more attempt to break $3200.
—
GOOD LUCK
persaxu
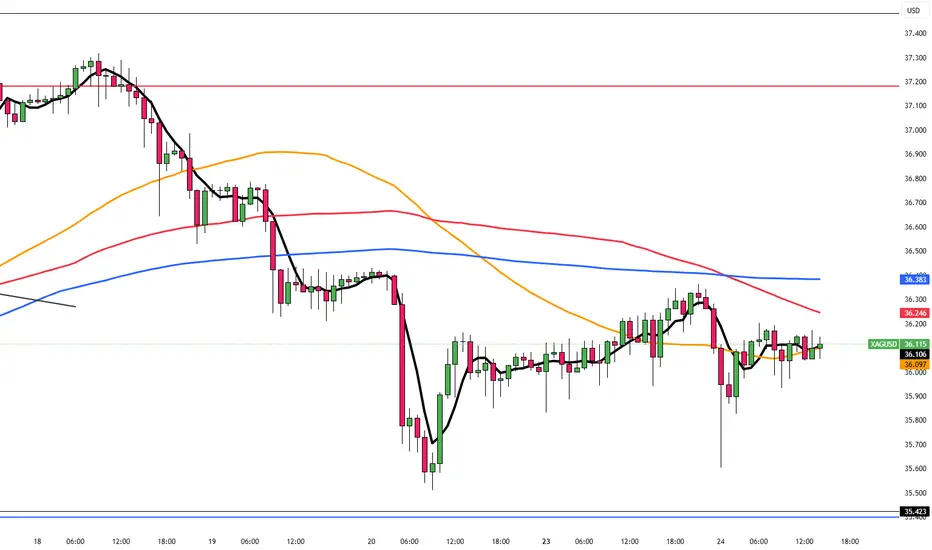
Silver Steady at $36 as Rate Cut Bets RiseSilver steadied around $36.10 during the Asian session, paring earlier losses after the geopolitical jolt. While the ceasefire cooled nerves, markets remain alert after Iran’s limited strike on a US base. Fed commentary also weighed in: Bowman and Waller leaned dovish, though Powell’s tone remains cautious ahead of his testimony.
The first resistance is seen at 37.50, while the support starts at 35.40.
Gold Falls to Two-Week Lows Gold fell to around $3,350 per ounce on Tuesday, its lowest level in two weeks, as the ceasefire reduced geopolitical stress. The truce announcement, set to begin with Iran immediately and Israel 12 hours later, cooled safe-haven demand. The metal’s recent run paused despite lingering tensions in the region.
Resistance is seen at $3,355, while support holds at $3,285.

War breaks out again? The latest analysis and layout of gold📰 Impact of news:
1. The ceasefire agreement reached earlier did not take effect, and Trump believed that both sides violated the agreement
2. Federal Reserve Chairman Powell delivered a speech 3 hours later
📈 Market analysis:
At the 4H level: the Bollinger Band opening is enlarged, the MACD indicator double-line death cross is downward, the short-selling force is strengthened, but the RSI indicator rebounds after being oversold. Overall, there are obvious signs of a rebound in gold prices. At the hourly level: the gold price is in a downward channel, the Bollinger Bands are expanding, the MACD indicator is dead cross and the red bars are converging, and the short momentum has weakened. The RSI indicator rebounds from oversold, and the demand for spot gold rebounds is obvious. Therefore, we still hold long orders near 3320 in the short term. Short-term operation suggestion: go long when it stabilizes at 3325-3315, pay attention to the resistance range of 3370-3380 on the upside, and consider shorting when encountering resistance and pressure.
🏅 Trading strategies:
BUY 3325-3315
TP 3335-3345-3365
SELL 3370-3380
TP 3340-3330
If you agree with this view, or have a better idea, please leave a message in the comment area. I look forward to hearing different voices.
OANDA:XAUUSD FX:XAUUSD FOREXCOM:XAUUSD FXOPEN:XAUUSD TVC:GOLD

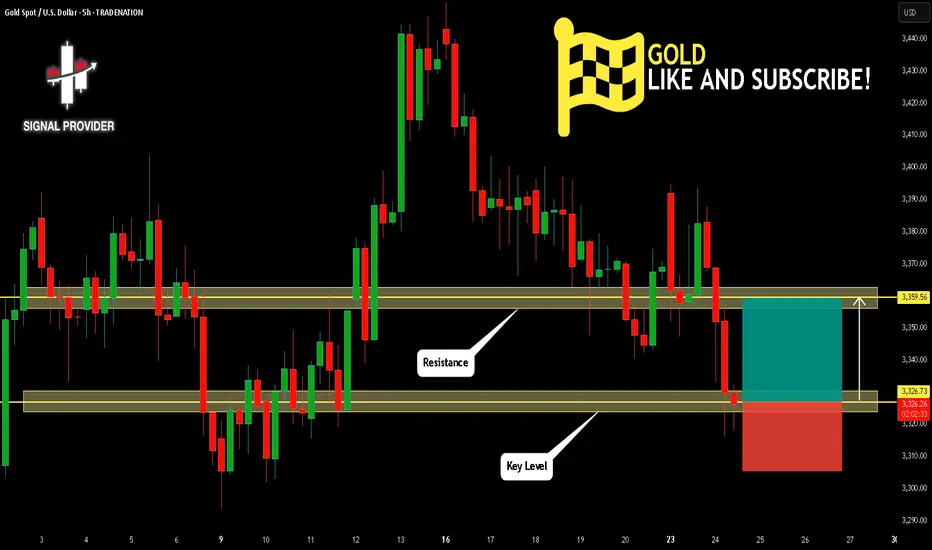
GOLD Will Go Higher! Long!
Here is our detailed technical review for GOLD.
Time Frame: 5h
Current Trend: Bullish
Sentiment: Oversold (based on 7-period RSI)
Forecast: Bullish
The market is trading around a solid horizontal structure 3,326.73.
The above observations make me that the market will inevitably achieve 3,359.56 level.
P.S
We determine oversold/overbought condition with RSI indicator.
When it drops below 30 - the market is considered to be oversold.
When it bounces above 70 - the market is considered to be overbought.
Disclosure: I am part of Trade Nation's Influencer program and receive a monthly fee for using their TradingView charts in my analysis.
Like and subscribe and comment my ideas if you enjoy them!
SILVER SELLERS WILL DOMINATE THE MARKET|SHORT
SILVER SIGNAL
Trade Direction: short
Entry Level: 3,612.8
Target Level: 3,572.6
Stop Loss: 3,639.3
RISK PROFILE
Risk level: medium
Suggested risk: 1%
Timeframe: 2h
Disclosure: I am part of Trade Nation's Influencer program and receive a monthly fee for using their TradingView charts in my analysis.
✅LIKE AND COMMENT MY IDEAS✅
