GOLD Long Inside The Range! Buy!
Hello,Traders!
GOLD is stuck in a local
Range while still trading
In a strong long-term uptrend
So we think that this is an
Accumulation before the
Next leg up and as we are
Bullish biased we will be
Expecting a retest and a
Rebound from the horizontal
Support below around 3259$
With the target of retesting
The horizontal resistance
Above around 3354$
Buy!
Comment and subscribe to help us grow!
Check out other forecasts below too!
Disclosure: I am part of Trade Nation's Influencer program and receive a monthly fee for using their TradingView charts in my analysis.
Metals

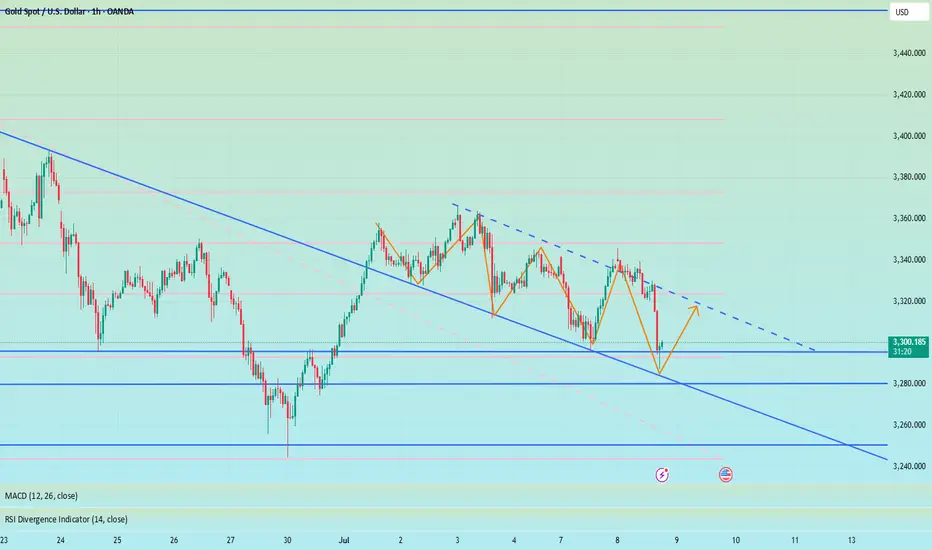
XAU/USD) bearish Trand analysis Read The captionSMC trading point update
Technical analysis of (XAU/USD) on the 3-hour timeframe, projecting further downside after rejection from a resistance zone aligned with a descending trendline.
---
Analysis Summary
Trend Bias: Bearish
Current Price: ~$3,301.96
Structure: Price is respecting a descending channel, with multiple rejections from the upper boundary and key resistance zone.
---
Key Technical Insights
1. Resistance Zone & Downtrend Line:
Price was rejected from a resistance block near the EMA 200 (~$3,331) and descending trendline.
This level has repeatedly triggered strong downside moves (highlighted with red arrows).
2. EMA 200 Reaction:
The EMA 200 at $3,331.10 is acting as dynamic resistance.
Each time price reaches or crosses above this line, selling pressure increases.
3. Bearish Price Projection:
After recent rejection, the chart anticipates a pullback to the support zone between $3,248.26 and $3,245.71.
A deeper drop toward $3,159.13 is projected as a next major target, consistent with previous price moves.
4. RSI Indicator:
RSI at 40.24 suggests bearish momentum is still in play but not yet oversold—indicating room for more downside.
---
Bearish Trade Idea
Element Level / Description
Entry Zone Below resistance: $3,310–$3,320
Target 1 $3,248.26–$3,245.71 (support zone)
Target 2 $3,159.13 (channel base / next support)
Stop-Loss Above $3,335 (above resistance zone)
---
Risk Considerations
Fundamental catalysts: Gold is sensitive to USD strength, interest rate decisions, and macroeconomic data.
Invalidation: A strong breakout and close above the descending trendline and EMA 200 would negate the bearish outlook.
---
Summary
This analysis outlines a bearish setup for XAU/USD, supported by trendline resistance, EMA rejection, and RSI momentum. If current structure holds, a move toward the $3,245 and $3,159 levels is likely.
Please support boost 🚀 this analysis)

Gold will continue to fall today.Gold continued to fall in the US market after hitting a high on Tuesday and hit a recent low. Currently, there is a fierce competition between long and short positions. The repeated swings in the US tariff policy have caused fluctuations in risk aversion sentiment, and the probability that the Federal Reserve will maintain interest rates above 95% in July has supported the US dollar. Technically, we need to focus on the key support of 3260 and the strong resistance range of 3320 above. The hourly chart shows that the short-term moving average diverges downward, and the K-line is under pressure, showing short-term fatigue, suggesting that there is still a need for a correction today.
Thank you for your likes and support!
I will continue to share my views.
I wish you a smooth trading!

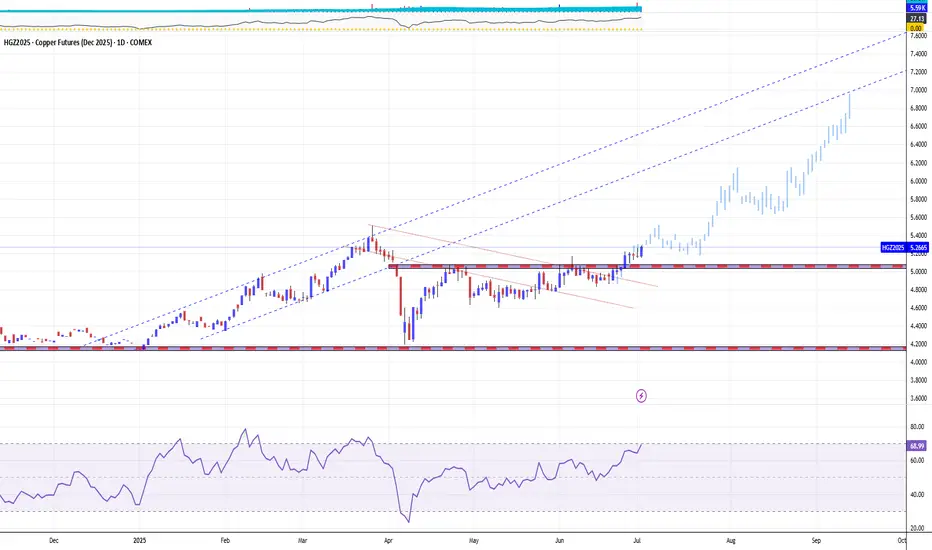
MR. COPPER GOES FUN. WITH DONALD TRUMP — IT IS A BULL RUNCopper prices in 2025 are up about 27 percent year-to-date, driven by a complex interplay of technical and fundamental factors, with geopolitical events such as the Trump administration's tariff policies and the escalation of geopolitical tensions in the Middle East having a significant impact.
Fundamental Outlook:
The main driver of copper prices in 2025 is the ongoing global surge in demand driven by the transition to clean energy. Copper is essential for electric vehicles (EVs), renewable energy infrastructure, and grid upgrades, all of which require extensive use of copper due to its superior electrical conductivity.
For example, EVs use about 2-4 times more copper than traditional vehicles, and renewable installations such as wind turbines contain several tons of copper each. This structural growth in demand underpins the optimistic outlook for copper in the medium to long term.
On the supply side, however, copper production is growing. The International Copper Study Group (ICSG) forecasts a global copper surplus of 289,000 tonnes in 2025, more than double the 2024 surplus. This surplus is driven by rising production, particularly from new or expanded operations in the Democratic Republic of Congo, Mongolia, Russia and elsewhere.
Capacity increases in these regions, coupled with smelter growth, could contribute to a supply glut despite strong demand.
Conversely, geopolitical tensions in the Middle East could disrupt bauxite and alumina supply chains, a region that is a strategically important supplier of raw materials.
Impact of Trump Tariffs:
The Trump administration’s threats and actions to impose tariffs on U.S. copper imports have added volatility and complexity to the market. The tariff announcement triggered a sharp sell-off in early April 2025 as concerns about the impact on US manufactured demand and global trade flows grew. London Metal Exchange (LME) copper prices fell to one-month lows following China’s retaliatory tariffs, before partially recovering after some tariff exemptions and reductions were announced.
The tariffs also distorted physical supply chains. Traders rushed to deliver copper to the US ahead of the tariffs, reducing copper availability in other regions such as China. This arbitrage resulted in a significant widening of the price differential between US CME copper contracts and LME copper prices, with US prices trading at a premium of over 10% to London. This premium reflects the tariff risk embedded in the US copper price and expectations of temporary domestic market tensions.
Technical Outlook:
Technically, copper prices have shown resilience despite the tariff shocks. Copper prices sold off after peaking in late March 2025 before the tariffs were announced, but have since begun to recover.
Long-term trendlines and moving averages remain supportive, with the 100-week and 200-week moving averages trending higher and forming a bullish crossover earlier in the year.
Long-term copper prices are once again attacking the 18-year resistance around $4.50/lb ($10/kg) that capped the upside in 2008 and again in the 2010s and first half of the 2020s, with a 1.5x rally in the next 1 to 3 years.
The technical main chart of the COMEX December 2025 copper futures contract COMEX:HGZ2025
points to the possibility of an upside move, all the way to the $7 mark (around $15/kg) as early as H2 2025.
Conclusion
Going forward, copper prices are expected to remain volatile but supported by long-term structural demand growth, with the impact of tariffs likely to cause episodic disruptions rather than a sustained suppression of increasingly hot prices.
--
Best wishes,
@PandorraResearch Team😎
CHF is the new gold? Safe-haven flows keep pressure on USDCHFBank of America argues that the Swiss franc has reasserted itself as the true safe-haven hedge.
BofA says the trend of the CHF being used more like gold, and a hedge against problems like rising US debt, could continue. Unlike the yen, which has lost much of its appeal as a pure haven.
Technically, recent candles might indicate buyers are attempting to build a base, but there’s no decisive reversal yet.
Should price fail to reclaim the 0.8030–0.8050 region soon, the broader bearish structure could resume - possibly testing fresh lows. Meanwhile, rallies in USD/CHF may face pressure as the franc’s macro backdrop continues to attract inflows.

Bullish reversal off major support?The Gold (XAU/USD) has bounced off the pivot and could rise to the 1st resistance which is an overlap resistance.
Pivot: 3,301.09
1st Support: 3,280.12
1st Resistance: 3,343.92
Risk Warning:
Trading Forex and CFDs carries a high level of risk to your capital and you should only trade with money you can afford to lose. Trading Forex and CFDs may not be suitable for all investors, so please ensure that you fully understand the risks involved and seek independent advice if necessary.
Disclaimer:
The above opinions given constitute general market commentary, and do not constitute the opinion or advice of IC Markets or any form of personal or investment advice.
Any opinions, news, research, analyses, prices, other information, or links to third-party sites contained on this website are provided on an "as-is" basis, are intended only to be informative, is not an advice nor a recommendation, nor research, or a record of our trading prices, or an offer of, or solicitation for a transaction in any financial instrument and thus should not be treated as such. The information provided does not involve any specific investment objectives, financial situation and needs of any specific person who may receive it. Please be aware, that past performance is not a reliable indicator of future performance and/or results. Past Performance or Forward-looking scenarios based upon the reasonable beliefs of the third-party provider are not a guarantee of future performance. Actual results may differ materially from those anticipated in forward-looking or past performance statements. IC Markets makes no representation or warranty and assumes no liability as to the accuracy or completeness of the information provided, nor any loss arising from any investment based on a recommendation, forecast or any information supplied by any third-party.

XAUUSD NY SESSION FLOW – JULY 8→ 9 , 2025"Structure doesn’t lie. Price answered exactly where we expected it to."
Hey traders 👋
Let’s set the record straight after today’s precision bounce. We saw textbook price action across all sessions — Asia triggered the short from our 3344–3351 HTF supply, and both London and New York followed through with no hesitation, driving price down to 3287.
But here’s the key point:
🧨 3287 was just 10 pips above our clean 3286–3280 buy zone.
No mitigation. Just a front-run.
That’s what real liquidity does — grabs what it needs before the crowd gets in. Our zone is still valid… just untouched.
🔍 HTF BIAS & STRUCTURE UPDATE
📆 Daily Bias:
Structure is still bearish — lower highs, CHoCH, and soft RSI.
EMAs 5/21 are flat. No power for bulls unless 3351 breaks.
⏰ H4 Bias:
New lower high confirmed after rejection from our 3344–3351 zone.
Trend is still bearish unless we reclaim 3330+ with conviction.
Liquidity is driving movement, not news.
🕐 H1 Flow:
Bounce from 3287 = engineered reaction before real demand
Price now hovering above 3306, forming mid-structure
No trade in the middle. Let’s work the edges.
🎯 TODAY’S SNIPER ZONES
🔻 SELL ZONES
1. 3325–3330
Nearest short trap. OB + inefficiency + H1 rejection base.
If price returns, watch M15/M30 for CHoCH or BOS → entry.
2. 3344–3351
Our major HTF supply. Asia already reacted from top half.
If revisited, this zone remains the high-probability rejection zone.
3. 3380–3394
Premium OB + imbalance pocket.
Untouched zone far above — if tapped late in the week, watch for liquidity sweep → clean reversal potential.
🟢 BUY ZONES
1. 3297–3300
NY session bounce zone. Price tapped 3297 → pushed to 3306.
Still live for intraday reentry if price retests and confirms with BOS.
2. 3286–3280
Our true demand base. Price front-ran it by 10 pips — didn’t mitigate.
Still valid, still reactive. Don’t delete this zone.
3. 3263–3255
Last line of support. Deep zone — only comes into play if 3280 fails with conviction.
✅ EXECUTION REMINDERS
Price is hovering mid-range → don’t force entries
Only act if structure reacts at the edges (3325 or 3286)
3380–3394 may be a late-week trap if bulls get overconfident
📌 If this breakdown helped, hit 🚀 and drop a comment:
👉 Are you stalking 3325… or waiting for 3286 to finally wake up?
Let structure talk. You just execute.
GoldFxMinds 💭🔥
📢 Disclosure:
This analysis is based on the Trade Nation TradingView feed. I’m part of their Influencer Program and receive a monthly fee.
⚠️ Educational content only — not financial advice.

XAUUSD 15M Smart Money Sell SetupGold is showing classic Smart Money Concepts (SMC) behavior with liquidity engineering and premium mitigation.
🧠 SMC Breakdown:
Price swept buy-side liquidity above 3,355 and failed to close above the zone.
Supply zone (red) at 3,350–3,360 was previously unmitigated and now tapped.
Clean mitigation candle formed inside the supply with a sharp rejection.
Sell pressure expected from institutions looking to fill short positions after engineered liquidity.
📌 Sell Idea:
We anticipate a bearish reaction from the 3,350–3,360 zone down to the demand area.
🎯 Trade Plan:
📍 Entry Zone: 3,350–3,360 (inside red supply zone)
🛑 SL: 3,365 (above the liquidity wick)
✅ TP: 3,300 zone (green demand block)
📊 Why This Trade?
Structure is bearish from higher timeframes.
This is a sell in premium after liquidity sweep.
Imbalance left behind during the move up still unfilled.
Expecting internal CHoCH on M1/M5 to confirm entry.
🧲 Liquidity Map:
Engineered highs above 3,355 swept.
Clean equal lows sitting at 3,300 – perfect magnet for price.
⚠️ Note: Patience is key. Let price come into your zone and show a reaction before entering.
#XAUUSD #SmartMoneyConcepts #SupplyAndDemand #GoldSellSetup #SMC #TradingView #InstitutionalTrading #LiquiditySweep #PriceAction #Forex

Bullish reversal off major support?XAU/USD has bounced off the support level which is an overlap support that lines up with the 76.4% Fibonacci projection and could rise from this level to our take profit.
Entry: 33,295.00
Why we like it:
There is an overlap support level that lines up with the 76.4% Fibonacci projection.
Stop loss: 3,278.48
Why we like it:
There is a pullback support level that aligns with the 100% Fibonacci projection.
Take profit: 3,338.86
Why we like it:
There is a pullback resistance level.
Enjoying your TradingView experience? Review us!
Please be advised that the information presented on TradingView is provided to Vantage (‘Vantage Global Limited’, ‘we’) by a third-party provider (‘Everest Fortune Group’). Please be reminded that you are solely responsible for the trading decisions on your account. There is a very high degree of risk involved in trading. Any information and/or content is intended entirely for research, educational and informational purposes only and does not constitute investment or consultation advice or investment strategy. The information is not tailored to the investment needs of any specific person and therefore does not involve a consideration of any of the investment objectives, financial situation or needs of any viewer that may receive it. Kindly also note that past performance is not a reliable indicator of future results. Actual results may differ materially from those anticipated in forward-looking or past performance statements. We assume no liability as to the accuracy or completeness of any of the information and/or content provided herein and the Company cannot be held responsible for any omission, mistake nor for any loss or damage including without limitation to any loss of profit which may arise from reliance on any information supplied by Everest Fortune Group.

Copper Cup & Handle Formation - Confirmed by Half-Yearly CloseIn a recent interview, Kevin Warsh, a former Member of Board of Governors Federal Reserve said: “External shocks like wars, pandemics, and supply chain disruptions may cause a spike in prices, that's not inflation. That's more like the weather. Inflation's more like the climate.
Weather refers to the day-to-day state of the atmosphere. A storm may come, but it will eventually pass.
Climate is the long-term average of weather patterns, typically measured over 30 years or more. If the underlying causes of climate change are not addressed, they are likely to affect future weather — for example, storms may become more unpredictable, occur more frequently, and intensify when they happen.
Going back to the financial markets. Have we address the underlying causes of inflation climate today? If not, then with every war or rumors of war or tariff or any unwelcome surprises.
They are likely to become even more volatile than before, some more bullish and the others more bearish.
What is the real cause of inflation climate the world is facing? Debt. At every pit stop, I will keep checking if there’s any chance that U.S. debt might start trending downward. If it does, my existing strategies would have to change. But for now, I’m maintaining these strategies. Here are some examples:
With fears of inflation still in sight, stocks have become more volatile. Since inflation hit a high of 9% in 2022, we’ve seen stock market swings widen.
With fears of inflation, bonds are under pressure. The drop in U.S. bonds wasn't triggered by the “Liberation Day” tariff announced on 2nd April alone. In fact, bonds peaked in 2020 and broke below their main uptrend support when inflation hit 9%.
With fears of inflation are also driving commodities higher — from “weather” to “weather,” so to speak. I’ve been covering gold, bitcoin, silver, and soybean oil. Today, copper looks interesting to me. Let’s dive into the technical. I find the half-year chart particularly interesting.
On this half yearly chart. We can see as the close on 30th June, copper settled firmly, closed above its $4.44 resistance that has been tested for years. This study indicates that copper could be at the beginning of an uptrend. I will be looking out for buying-on-dips opportunities whenever they arise.
What Began Well, Grew Risky — Yet Opportunity Awaits. Besides debt, there are two other key elements that may trigger fears of inflation from time to time. What do you think they are?
I would like to hear your thoughts on this.
Video version:
Mirco Copper Futures
Ticker: MHG
Minimum fluctuation:
0.0005 per pound = $1.25
Disclaimer:
• What presented here is not a recommendation, please consult your licensed broker.
• Our mission is to create lateral thinking skills for every investor and trader, knowing when to take a calculated risk with market uncertainty and a bolder risk when opportunity arises.
CME Real-time Market Data help identify trading set-ups in real-time and express my market views. If you have futures in your trading portfolio, you can check out on CME Group data plans available that suit your trading needs www.tradingview.com

Goldman Says $4K – My Chart Says Sell💥📉 Gold Analysis – Divergences, Resistance, and a Short Bias 🪙⚠️
Hey Traders,
As promised in the latest video, here's the official chart update for Gold – and the message is clear: I'm short.
📊 What I See on the Chart
We're now well below the 3,446 resistance, with early signs of weakness showing up across multiple timeframes. I’ve laid out both the 2-Day and 4H charts in this post, and here’s what I’m tracking:
⚠️ Technical Warning Signs:
🔻 2D chart: Six bearish divergences
– RSI, Stochastic, CCI, OBV, MFI, and MACD all flashing red
📉 1D chart: Same thing — six divergences, telling me momentum is fading
⏳ 4H chart: Price action breaking trendlines, and support at 3,237 looks shaky
🚨 If that breaks, my main support zone is at $3,000 – and that’s where I believe we’re heading.
This is not just a pullback. This is the kind of confluence you can’t ignore if you trade technically.
🔁 Sentiment Shift
Back in December '22 and again earlier this year, I was long Gold – and it was the right call. But now?
📌 This chart has gone from momentum to exhaustion.
📌 I see less demand, softer momentum, and strong bearish divergence stacking across every major timeframe I watch.
🎯 Trade View
✅ I’m short Gold.
🎯 Targeting the $3,000–3,050 zone.
📉 Invalidated if we reclaim and close above $3,446 with strength.
It’s that simple. Nothing personal – just structure, divergence, and flow.
🧠 The Chart vs. The Narrative
Recently, I saw a note from Goldman Sachs forecasting $4,000 Gold. Maybe they’re right.
But I’ll be honest with you – I don’t buy the media hype.
I'm not here for the headlines.
I'm a chart guy. Always have been. Always will be.
The chart is the map to the treasure – and that’s the only thing I follow.
🧠 I cover this and the broader macro setup (Dollar, BTC, DAX, Tech, BTC.D, and more) in the full 20-min video just dropped. If you haven’t watched it yet, go catch up — it explains the logic and why this isn’t just a gold story.
One Love,
The FXPROFESSOR 💙
Disclosure: I am happy to be part of the Trade Nation's Influencer program and receive a monthly fee for using their TradingView charts in my analysis. Awesome broker, where the trader really comes first! 🌟🤝📈

30M Insight: EURUSD Buy Limit ReadyGood Mornıng Traders;☀️
Based on a 30-minute analysis, I’ve identified a shift in EURUSD market structure. I’ll be waiting for price to reach my level with a buy limit order.
📥 BUY LIMIT ORDER: 1.17180
🛑 STOP LOSS: 1.16946
🎯 TP1: 1.17275
🎯 TP2: 1.17412
🎯 TP3: 1.17649
📊 Risk / Reward Ratio: 2.00
Patience meets precision. Let the market come to you.
🧠 Master your mindset with iron discipline.
Never fear the trade—let the trade fear you.
Keep your motivation high and your focus sharper than ever.
-----
Your likes and support are what keep me motivated to share these analyses consistently.
Huge thanks to everyone who shows love and appreciation! 🙏

How to solve the problem of order being trapped in a loop📊 Gold Day Trading Strategy (Recommendation index ⭐️⭐️⭐️⭐️⭐️)
📰 News information:
1. The lasting impact of new tariffs
2. The impact of geopolitical conflicts
3. The Fed’s interest rate cut
📈 Technical Analysis:
The recent market conditions have been volatile. Many brothers have reported that they have been trapped recently. They have just been released from short positions, but have fallen into the situation of being trapped by long orders again. I have also encountered such a situation recently. Brothers who follow me must know that I have been trapped, but in the process of being trapped, I still share my trading ideas for the brothers who are trapped to check, so that we can all get out of the trap.
Gold fell as expected and hit the lowest point of 3287 before rebounding. The current 3300-3290 range given at the bottom has certain support. At present, I have answered it. As long as it does not fall below 3285, we can still go long and look for rebound correction. TP can temporarily look at 3305-3310. At present, the short-term upper watershed is near the 3321 line. As time goes by, the medium-term point can be seen at 3345. Only when the price stands above 3345 can the upward momentum continue to touch the 3380 line, or even 3400. In the short term, you can go long if you look at the support below. In the short term, pay attention to the resistance above 3315-3320. If it encounters resistance under pressure, it will fall back. On the contrary, after breaking through the first level of resistance, the upward trend will continue.
🎯 Trading Points:
BUY 3300-3290-3285
TP 3305-3315-3320-3345
SELL 3315-3321
TP 3300-3290
In addition to investment, life also includes poetry, distant places, and Allen. Facing the market is actually facing yourself, correcting your shortcomings, facing your mistakes, and exercising strict self-discipline. I share free trading strategies and analysis ideas every day for reference by brothers. I hope my analysis can help you.
TVC:GOLD OANDA:XAUUSD FXOPEN:XAUUSD FX:XAUUSD FOREXCOM:XAUUSD PEPPERSTONE:XAUUSD
GOLD - SHORT TO $2,800 (UPDATE)Another beautiful, bearish rejection from our resistance zone on Gold. Our 1st resistance zone of $3,350 is still holding.
If buyers take out this level, another zone to watch out for is the $4,006 - $4,022 zone as there is a lot of pending liquidity sitting around that zone.

Gold 1H Intra-Day Chart 07.07.2025Option 1: Gold rejects from CMP & drops towards $3,286.
Option 2: Gold keeps moving higher into another strong demand zone of $3,416.
Which scenario do you find more likely?

GOLD - SHORT TO $2,800 (UPDATE)Gold has started the week extremely bearish, down 450 PIPS since last night at market open. This puts our 'Sell Trade' in 480 PIPS profit so far. Great start to the week.

Gold: Potential Correction on the Horizon?Gold has long been regarded as a safe haven asset, drawing the attention of investors during periods of economic uncertainty. In recent years, gold prices have reached historic highs, fueled by inflation concerns, geopolitical tensions, and shifts in monetary policy. However, as with any asset experiencing a prolonged rally, the question arises: Is a correction in gold prices imminent?
Understanding the Recent Gold Rally
Several factors have contributed to gold’s impressive performance:
Inflation Hedge: Persistent inflation has driven investors toward gold as a store of value.
Geopolitical Risks: Ongoing conflicts and global tensions have increased demand for safe haven assets.
Monetary Policy: Central banks’ dovish stances and low interest rates have made non-yielding assets like gold more attractive.
Several scenarios could catalyze a correction in gold prices:
Unexpected Economic Recovery: Stronger-than-expected economic data could reduce demand for safe haven assets.
Aggressive Rate Hikes: Faster-than-anticipated interest rate increases could shift investor preference away from gold.
Resolution of Geopolitical Tensions: Any de-escalation in major geopolitical hotspots may dampen gold’s appeal.
#gold #commodity #commodities #metals #trading #portfolio

GOLD 4H CHART ROUTE MAP UPDATEHey Everyone,
Please see update on our 4H Chart route map, also playing out perfectly with our levels being respected, as analysed.
We have our bearish target hit at 3295 and currently testing for support and bounce. Ema5 cross and lock below this level will open the swing range and failure to lock will see price reject and head up for the Bullish target. The 1h chart route map from yesterdays update also has the swing range open, which we need to keep in mind when planning to buy dips.
We will keep the above in mind when taking buys from dips. Our updated levels and weighted levels will allow us to track the movement down and then catch bounces up.
We will continue to buy dips using our support levels taking 20 to 40 pips. As stated before each of our level structures give 20 to 40 pip bounces, which is enough for a nice entry and exit. If you back test the levels we shared every week for the past 24 months, you can see how effectively they were used to trade with or against short/mid term swings and trends.
The swing range give bigger bounces then our weighted levels that's the difference between weighted levels and swing ranges.
BULLISH TARGET
3364
EMA5 CROSS AND LOCK ABOVE 3364 WILL OPEN THE FOLLOWING BULLISH TARGETS
3429
EMA5 CROSS AND LOCK ABOVE 3429 WILL OPEN THE FOLLOWING BULLISH TARGET
3499
EMA5 CROSS AND LOCK ABOVE 3429 WILL OPEN THE FOLLOWING BULLISH TARGET
3499
EMA5 CROSS AND LOCK ABOVE 3499 WILL OPEN THE FOLLOWING BULLISH TARGET
3561
BEARISH TARGETS
3295 - DONE
EMA5 CROSS AND LOCK BELOW 3295 WILL OPEN THE SWING RANGE
3242
3171
EMA5 CROSS AND LOCK BELOW 3171 WILL OPEN THE SECONDARY SWING RANGE
3089
3001
As always, we will keep you all updated with regular updates throughout the week and how we manage the active ideas and setups. Thank you all for your likes, comments and follows, we really appreciate it!
Mr Gold
GoldViewFX

Macro Moves & Market Reversals: BTC-Metals-Tech-Dollar & more! 🤖📊 Macro Moves & Market Reversals: Bitcoin, Metals, Tech, Dollar & DAX Breakdown 🔥💹
Hey beautiful people,
FXPROFESSOR here with a massive market update to kick off the week. This one’s for my serious traders—those of you ready to read the market like a pro 📚💡
We’re in a critical transition. The Trump–Powell standoff, rate cut games, tariff escalations, and a surprising shift in risk appetite across bonds, metals, and equities are reshaping the entire trading landscape.
Let’s get into the full breakdown 👇
🧠 MACRO FIRST – THE FUNDAMENTAL PULSE
🟢 Interest Rates:
The Fed is keeping rates steady at 4.25%–4.50%, citing strong jobs data. 147K jobs added, unemployment at 4.1%. The market wanted bad news for rate cuts... didn’t get it.
🗓 September remains the most likely cut, but the Fed isn’t rushing. Strong labor = slow policy change.
⚠️ Tariffs Heating Up:
Trump just slapped 25–40% tariffs on imports from Japan, Korea, and others – effective August 1.
➡️ If no political resolution by July 9, prepare for a volatility wave.
Tariffs = supply chain risks + cost-push inflation.
💣 Geopolitics:
Middle East tensions remain background noise, but no major disruptions for now. Still, oil remains sensitive.
📈 Risk Appetite (Bonds):
U.S. Treasuries still lagging, but junk bonds and quality credit (LQD) have pumped. That’s a big clue: risk appetite is returning, even without a Fed pivot.
📉 DOLLAR INDEX (DXY) – "THE YEAR OF THE NORMALIZED DOLLAR"
We’ve followed this dollar short all year.
🔻 From rejection at 100.965, DXY dropped straight into our long-term 94–95 target zone.
📌 Now what? This level is MAJOR. A bounce could trap dollar bears.
🧭 No new short from me unless we re-tag 100+. The juice is squeezed.
Key takeaway:
The dollar already priced in rate cuts, and we didn’t even get them. That’s telling me the next macro move might not be so predictable.
💰 BITCOIN – STILL THE KING
📍 BTC at $115K resistance – a level I’ve charted for years, not weeks.
Three hits:
1️⃣ First rejection
2️⃣ Second rejection
3️⃣ And now... a decisive moment
🚨 Break 115K → BTC flies.
📉 Fail here → we could revisit $64K, yes, seriously. I’m ready for both outcomes.
This is not the time for hopium. It’s 50/50.
🪙 BTC DOMINANCE – THE ALTCOIN SWITCH
BTC.D is now above 65%. That means:
✔️ Capital flowing back into BTC
❌ Altcoins not ready yet
We don’t chase alts until BTC.D hits 71.3–72.9%. That’s the real “altseason trigger zone.”
🔒 I’m personally turned off from alts for now—too much noise, too many memes, not enough macro support.
🔩 PRECIOUS METALS – SHINING BRIGHT
💛 Gold (XAU/USD):
Reached near $3,500 highs
Now stalling
🛑 Taking profits here – caution warranted.
🤍 Silver (XAG/USD):
13-year high
Holding $36+ well
Potential breakout pending global inflation data
💿 Platinum (the sleeper):
+47% YTD
Beautiful long setup played out exactly as planned
Still bullish above $1,400 if supply squeeze continues
💡 ETFs in metals are seeing inflows – more institutions hedging as dollar weakens.
🚗🔌 TECH STOCKS – NVDA, TSLA & THE NASDAQ
📈 NVIDIA (NVDA)
Best trade of the year for me
Clean re-entry, now hitting ATH levels
AI demand + tight supply = rocket fuel
⚡ Tesla (TSLA)
Bounce off 4H trendline
Still lagging slightly – political tensions (Trump vs. Musk) not helping
But levels are working like a charm
📊 NASDAQ (QQQ)
Hit our “max pain” zone perfectly
Rebounded with textbook precision
Momentum intact – watching for new highs
🇩🇪 DAX INDEX – CHARTS DON’T LIE
All-time high. Boom. Called it weeks ago.
Despite:
No Russian energy
Industrial drag
ECB policy constraints
📌 But what worked?
➡️ Simple chart structure.
➡️ Market psychology.
➡️ Pure TA.
Now at resistance again. Watch carefully – support below is clearly defined.
🧾 FINAL THOUGHTS – THE PROFESSOR'S NOTES
🔹 The market’s narrative can change fast, especially with Trump in the mix. He’s Mr. Volatility.
🔹 Powell holds the real power – and right now, he’s not flinching.
🔹 Risk appetite is back – but not evenly. Bitcoin is leading, altcoins are lagging, metals are maturing.
🔹 If rate cuts materialize in September, expect massive rotation across all risk assets.
💭 Until then, I’m playing level-to-level. No FOMO. Just charts and logic. That’s how we survive, and thrive.
Let me know which chart you want next – and thank you for staying sharp 💪📚
One Love,
The FXPROFESSOR 💙
Disclosure: I am happy to be part of the Trade Nation's Influencer program and receive a monthly fee for using their TradingView charts in my analysis. Awesome broker, where the trader really comes first! 🌟🤝📈

GOLD: Move Up Expected! Long!
My dear friends,
Today we will analyse GOLD together☺️
The market is at an inflection zone and price has now reached an area around 3,298.60 where previous reversals or breakouts have occurred.And a price reaction that we are seeing on multiple timeframes here could signal the next move up so we can enter on confirmation, and target the next key level of 3,312.65.Stop-loss is recommended beyond the inflection zone.
❤️Sending you lots of Love and Hugs❤️

SILVER: Local Bearish Bias! Short!
My dear friends,
Today we will analyse SILVER together☺️
The price is near a wide key level
and the pair is approaching a significant decision level of 36.435 Therefore, a strong bearish reaction here could determine the next move down.We will watch for a confirmation candle, and then target the next key level of 36.336..Recommend Stop-loss is beyond the current level.
❤️Sending you lots of Love and Hugs❤️

XAU/USD : Gold is falling , When it Stops? (READ THE CAPTION)By analyzing the gold chart on the 4-hour timeframe, we can see that, in line with our latest analysis, the bearish momentum has continued—and even more strongly than expected. Gold has broken below the key $3300 level and is currently trading around $3294.
Given the strong momentum, further downside is likely. The next bearish targets are $3289, $3276, $3262, and $3254.
All key supply and demand zones are clearly marked on the chart.
(And if you're looking for more precise trading levels, just drop a comment and I'll guide you.)

US tariff deadline, GOLD expected to fluctuate very stronglyInvestors will be keeping an eye on tariff news from Washington this week as the temporary suspension of punitive import duties is set to expire. If trade tensions do not escalate further after Wednesday’s deadline, that could be good for the market, while downside risks are also a negative for OANDA:XAUUSD in particular.
News Around US Tariffs
To avoid higher tariffs, negotiators from more than a dozen major US trading partners are racing against time to negotiate with the Trump administration, trying to reach a deal before July 9. Trump and his team have continued to apply pressure in recent days.
Trump announced a deal with Vietnam to lower the 20% tariffs he had promised on many Vietnamese exports, while talks with Japan, the United States’ most important ally in Asia and sixth-largest trading partner, appeared to be stalled, even as Washington hinted it was close to a deal with India.
In data
Nonfarm payrolls data released Thursday showed the U.S. added 147,000 jobs in June, beating market expectations, and the unemployment rate fell to 4.1%.
Despite the slowdown in private-sector hiring, the overall strong report prompted markets to lower expectations for a Federal Reserve rate cut in July.
According to the CME FedWatch Tool, the probability of a rate cut has dropped sharply from 24% to 4.7%. Fed Chairman Powell reiterated that the central bank will not ease its stance until there are more signs of cooling in employment and inflation.
Personal Comments
The market is following a number of factors:
On the one hand, there is a countdown to Trump's "final blow" on tariffs, and on the other hand, the non-farm data has poured cold water once again. As the Fed's stance fluctuates, the US Dollar faces a tug-of-war between long and short positions, while gold continues to stabilize technically or has had significant price increases. July 9 of this month could be a key moment to really test the sustainability of gold in this recovery.
Technical Outlook Analysis OANDA:XAUUSD
Gold has recovered significantly over the past week, since finding support from the $3,250 area, but the temporary recovery is still limited by the EMA21 followed by the 0.236% Fibonacci retracement level.
However, sustained price action above the $3,300 raw price point should be viewed as a positive signal as it helps gold stabilize within the price channel.
If gold rises and breaks above the 0.236% Fibonacci retracement level, it will be eligible to continue rising with a short-term target of around $3,400 rather than a horizontal resistance of $3,430.
The indecision sentiment is shown by the RSI activity, which is mostly moving around the 50 level. RSI above 50 is considered a positive signal, while RSI below 50 is considered a negative signal, but gold is currently in the middle of this point.
Overall, gold has not yet had a short-term trend, but in the long-term, gold prices are still in an upward trend, which is noted by the price channel.
Finally, the notable positions will be listed as follows.
Support: 3,300 – 3,292 – 3,250USD
Resistance: 3,350 – 3,371 – 3,400USD
SELL XAUUSD PRICE 3334 - 3332⚡️
↠↠ Stop Loss 3338
→Take Profit 1 3326
↨
→Take Profit 2 3320
BUY XAUUSD PRICE 3275 - 3277⚡️
↠↠ Stop Loss 3271
→Take Profit 1 3283
↨
→Take Profit 2 3289
