GOLD ROUTE MAP UPDATEHey Everyone,
Great finish to the week!!
We will now finish off with the Daily chart update, after following the 1h and 4h chart throughout the week. This will now remind everyone, how we broke down the overall structure into play.
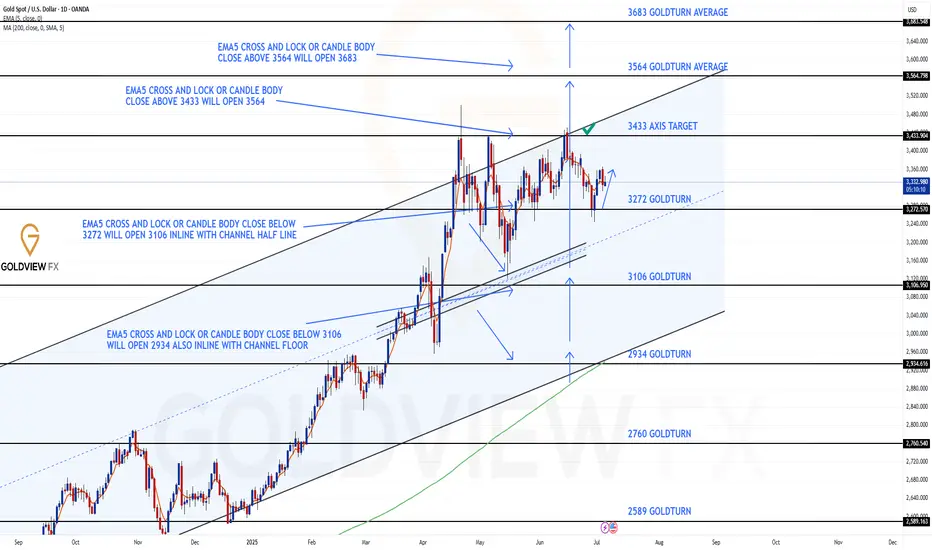
The bounce scenario off 3272 has now officially played out, just as outlined.
After the clean rejection at the channel top near 3433, price moved precisely into the 3272 Goldturn support, where we were watching closely for structure to hold. That level held beautifully, providing a solid base for this week’s strong push upward.
This reaction once again highlights the precision and reliability of the Goldturn levels - 3272 acted as a critical pivot, and the market respected it perfectly. We didn’t get an EMA5 cross and lock breakdown, confirming that buyers were still in control at this support, and that was our green light for bounce structure to unfold.
As price grinds its way back up the channel, we’ll continue to monitor reactions at key resistance zones. The measured structural move from 3272 reinforces our approach of trading level to level with patience and confirmation, not emotion.
We’ll be back Sunday with a full multi timeframe analysis to prepare for next week’s setups including updated views on the higher timeframes, EMA alignments, and structure expectations going forward.
Key Levels to Watch:
Resistance: 3433 (channel top)
Support: 3272 (confirmed bounce zone)
Thanks again for all your likes, comments, and follows.
Wishing you all a fantastic weekend!!
Mr Gold
GoldViewFX
Metals
Go short before breaking 3350, go long before falling to 3320📰 News information:
1. Geopolitical situation
2. Tariff implementation and interest rate cut bill
📈 Technical Analysis:
As I said, the US stock market closed early today, and the market will lack some momentum. It is difficult to have a large fluctuation. It is expected to fluctuate and consolidate. I also explained in the previous post that the upper pressure in the short term is at 3340-3350. If it is touched, we can try to short and defend 3360. If it falls back to 3323, we can try to go long for the first time. If it continues to fall, it is expected to reach 3315-3305. Therefore, if it first touches 3323, go long, SL 3316, and consider going long if it touches 15-05 below.
🎯 Trading Points:
SELL 3340-33350
TP 3330-3320-3310-3300
BUY 3323
TP 3333-3340-3350
BUY 3315-3305
TP 3325-3333-3340
In addition to investment, life also includes poetry, distant places, and Allen. Facing the market is actually facing yourself, correcting your shortcomings, confronting your mistakes, and strictly disciplining yourself. I hope my analysis can help you🌐.
TVC:GOLD OANDA:XAUUSD FX:XAUUSD FOREXCOM:XAUUSD PEPPERSTONE:XAUUSD FXOPEN:XAUUSD

Gold will exit from pennant and then rise to resistance levelHello traders, I want share with you my opinion about Gold. Recently, the price formed a pennant pattern after a sharp bullish impulse from the buyer zone (3275–3285 points). That upward movement started after the price bounced off the strong support level (3285) and broke out from the wedge structure formed earlier. This bullish momentum indicated strong demand near the lower boundary, reinforcing the current market structure. Now, the price is consolidating inside the pennant formation, slowly approaching its apex. At the same time, we are still above the support trendline and close to the upper border of the pattern. This suggests a possible breakout to the upside. I expect that gold will soon exit the pennant and start rising again toward the resistance level at 3385, which also matches the seller zone (3385–3395 points). This area previously acted as a major reversal zone, so if price reaches it, I will consider locking profits at that point. Given the breakout structure, recent bounce from the buyer zone, and current bullish consolidation, I remain bullish and expect GOLD to continue growing toward TP 1 at 3385. Please share this idea with your friends and click Boost 🚀
Disclaimer: As part of ThinkMarkets’ Influencer Program, I am sponsored to share and publish their charts in my analysis.

GOLD - SHORT TO $2,800 (UPDATE)Gold closing the week below our 'premium resistance zone', running roughly 170 PIPS in profit. Hope you all are in sells & running in profit like my Gold Fund investors as this was called live for you.
Don't forget we could also have a possible liquidity zone sitting just above $3,400 like I told you all earlier this week. Just something to be careful of & stay prepared in advance.

GOLD: Bearish Continuation & Short Signal
GOLD
- Classic bearish pattern
- Our team expects retracement
SUGGESTED TRADE:
Swing Trade
Sell GOLD
Entry - 3335.9
Stop - 3338.8
Take - 3330.1
Our Risk - 1%
Start protection of your profits from lower levels
Disclosure: I am part of Trade Nation's Influencer program and receive a monthly fee for using their TradingView charts in my analysis.
❤️ Please, support our work with like & comment! ❤️

SPY/QQQ Plan Your Trade End Of Week Update For 7-4Happy 4th of July
I've been very busy with projects and new tools for traders, as well as the new book I'm working on, and thought I would deliver an End Of Week update for everyone.
In this video, I cover the past Cycle Patterns and how they played out for the SPY/QQQ, Gold/Silver, and Bitcoin, as well as add some of my own insight related to the market trends.
All of my systems are still LONG and have not changed. I still believe this market is extremely overbought, and I believe it could roll over at any moment into a pullback - but we need to wait to see if/when that may/does happen.
Gold made a big move higher this week, and I believe that move could continue throughout July.
Bitcoin made a surprising Double-Top and is not rolling downward. Could be a breakdown in the markets as BTCUSD tends to lead the QQQ/NQ by about 3-5 days.
The SPY/QQQ rallied like a rocket all week. It was absolutely incredible to see the markets rally like this. But, I'm still cautious of a sudden rollover top.
I managed to catch some nice trades with options spreads this week, and my metals positions were on fire. I'm still trading from a "hedge everything" mode as I don't trust this rally, and I'm still watching for REJECTIONS near these new highs.
Stay safe and GET SOME.
DM me if you have any questions.
#trading #research #investing #tradingalgos #tradingsignals #cycles #fibonacci #elliotwave #modelingsystems #stocks #bitcoin #btcusd #cryptos #spy #gold #nq #investing #trading #spytrading #spymarket #tradingmarket #stockmarket #silver

Gold Consolidating Ahead of Next Move Gold Consolidating Ahead of Next Move – Is 3390 the Bull Target or a False Breakout Trap?
🧭 Fundamental Outlook
Gold has entered a tight consolidation phase following a wave of high-impact macroeconomic events:
The US House of Representatives has passed Trump's “Super Bill”, raising expectations of increased fiscal spending and long-term inflationary pressures. In theory, this is supportive of gold prices.
However, strong NFP and Unemployment Rate figures released recently have reinforced dollar strength in the short term, suggesting the Fed may delay rate cuts → a temporary headwind for gold.
With Independence Day in the US, liquidity across global markets is expected to drop, increasing the risk of false moves or stop-hunt volatility.
🟡 The lack of immediate upside doesn’t mean bullish momentum has disappeared. Price may simply be building energy before its next leg.
📉 Technical Overview – XAU/USD
Gold has broken out of a minor descending trendline and is now testing a key supply zone around 3344–3345, which could determine the intraday trajectory.
🔍 Key Levels
Resistance Zones: 3345 – 3362 – 3374 – 3388 – 3390
Support Zones: 3330 – 3312 – 3304 – 3302 – 3298
🟢 Bullish Scenarios (Buy Setups)
📍 Intraday Buy Zone:
3313 – 3311
Stop Loss: 3307
Take Profit: 3316 – 3320 – 3325 – 3330 – 3335 – 3340 – 3345 – 3350
📍 Deep Pullback Buy Zone:
3304 – 3302
Stop Loss: 3298
Take Profit: 3308 – 3312 – 3316 – 3320 – 3330 – 3340
These zones are ideal for trend-continuation entries, especially if supported by bullish candles or price action on lower timeframes.
🔴 Bearish Scenarios (Short-Term Only)
📍 Intraday Sell Zone:
3362 – 3364
Stop Loss: 3368
Take Profit: 3358 – 3354 – 3350 – 3346 – 3340 – 3335 – 3330
📍 High-Risk Sell Zone:
3388 – 3390
Stop Loss: 3394
Take Profit: 3384 – 3380 – 3376 – 3370 – 3365 – 3360
Bearish positions should be reserved for signs of exhaustion or rejection patterns at resistance levels.
🧠 Trading Bias for Today
With limited liquidity due to the US holiday, price may remain trapped in a sideways range between 3320 and 3340. Traders should stay nimble and avoid overexposure.
✅ Primary bias: Buy dips near major support
⚠️ Alternative view: Only short if price confirms reversal at resistance
💬 What’s Your Take on Gold Today?
Will gold break through the 3390 barrier this week?
Or are we looking at one more dip before a true bullish continuation?
👇 Share your thoughts and trading ideas in the comments!

XAUUSD: July 4, market analysis and strategyGold technical analysis
Daily chart resistance 3400, support 3300
4-hour chart resistance 3365, support 3306
1-hour chart resistance 3352, support 3322
Last night, NFP employment data caused gold prices to fall sharply by $40, and then rebounded to 3338. The energy of the shorts caused by the NFP data has been basically digested. Next, the bulls will start to exert their strength. Gold can still be bullish if it falls back today.
Yesterday, the gold price quickly fell to 3311 and then rebounded. The low point of the second retracement was 3322, which is the short-term support level. You can wait for a retracement near 3322 to buy bullish. The 1-hour resistance is 3352. Pay attention to the reaction here and look for selling opportunities.
Buy: 3322near
Sell: 3352near

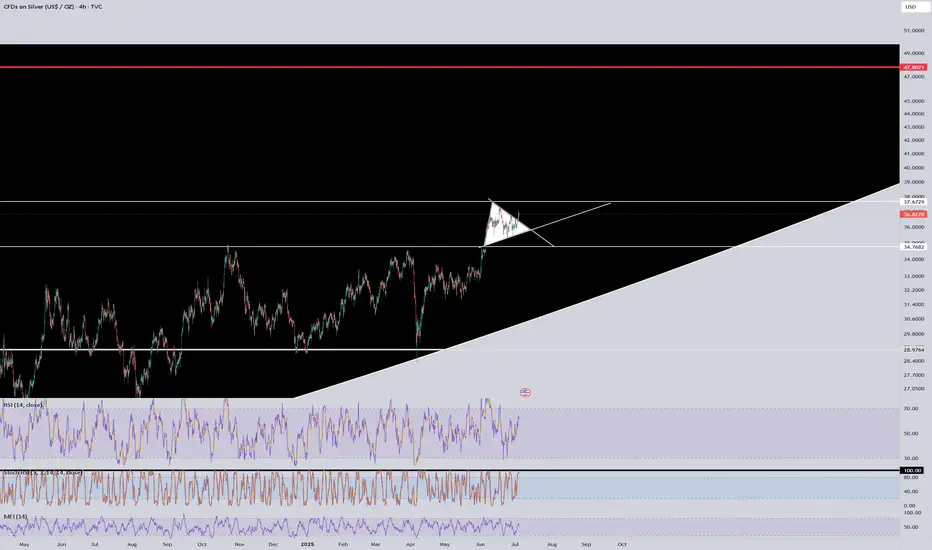
SILVER: The Market Is Looking Up! Long!
My dear friends,
Today we will analyse SILVER together☺️
The price is near a wide key level
and the pair is approaching a significant decision level of 36.830 Therefore, a strong bullish reaction here could determine the next move up.We will watch for a confirmation candle, and then target the next key level 36.903.Recommend Stop-loss is beyond the current level.
❤️Sending you lots of Love and Hugs❤️

GOLD: Bears Are Winning! Short!
My dear friends,
Today we will analyse GOLD together☺️
The in-trend continuation seems likely as the current long-term trend appears to be strong, and price is holding below a key level of 3,336.61 So a bearish continuation seems plausible, targeting the next low. We should enter on confirmation, and place a stop-loss beyond the recent swing level.
❤️Sending you lots of Love and Hugs❤️

DeGRAM | GOLD around $3350📊 Technical Analysis
● Bulls defended the 3 312 pivot where the rising-channel base and July trend-support intersect; successive higher-lows are squeezing price against 3 355—last week’s swing cap and channel median.
● A break of 3 355 completes a 1 : 1 wedge measured to 3 380, and the grey inner rail projects follow-through toward the prior range ceiling at 3 425.
💡 Fundamental Analysis
● Softer US ISM-Services prices and falling 2-yr real yields curb USD demand, while IMF data show central-bank gold purchases rising for a third straight month—both underpinning bullion.
✨ Summary
Long 3 330-3 345; confirmed close above 3 355 eyes 3 380 then 3 425. Bull view void on an H1 close below 3 312.
-------------------
Share your opinion in the comments and support the idea with a like. Thanks for your support!

GOLD 1H – Breakout Retest or a Fragile Bullish Hope?👆🚀Boost it if you like it... (Thank you) 🚀👆
Gold has finally broken out above the descending trendline that has capped price for weeks. We’ve already seen Leg 1, an impulsive rally from the strong support zone, and a textbook retest of the broken trendline.
If bulls hold this level, a Leg 2 continuation could unfold.
Key Factors to Watch:
✅ Strong demand zone fueling the first leg up
✅ Clean breakout and retest of descending resistance
✅ Price still hovering around EMAs (15/60)
⚠️ However, the structure is fragile – lack of follow-through could trap late buyers
⚠️ If price loses the retest area decisively, sellers may reclaim control
Trading Insight:
This is a fascinating setup for bulls—but don’t fall in love with it. Stay adaptive. The market doesn’t owe us a second leg higher. Manage risk carefully and remember: probabilities, not certainties.
Trade Safely...
#MJTrading
#Gold #XAUUSD #TradingView #TechnicalAnalysis #BreakoutTrading #SupportResistance #PriceAction

Gold Breakout and Potential RetraceHey Traders, in today's trading session we are monitoring XAUUSD for a selling opportunity around 3,350 zone, Gold was trading in an uptrend and successfully managed to break it out. Currently is in a correction phase in which it is approaching the retrace area at 3,350 support and resistance zone.
Trade safe, Joe.

BTCUSD| Bitcoin’s Historic Parabolic Pattern🔥 Parabolic Pattern | Institutional COINBASE:BTCUSD Demand Mirrors Gold ETF Era 🔥
COINBASE:BTCUSD vs SP:SPX vs TVC:GOLD
The market is whispering something big — and it's not retail noise this time. For the third straight quarter, listed corporations have outpaced ETFs in Bitcoin purchases, a seismic shift that echoes one key moment in history: the launch of the Gold ETF. Companies like NASDAQ:MSTR contiune to buy and others are following. Will NASDAQ:AAPL NASDAQ:META and NASDAQ:GOOG be next ? Let me know in the comments who you think will be next to buy?
Back then, companies rushed to gold as a hedge against inflation and a store of value as fiat cracks widened. Fast forward to now — we're seeing the same institutional footprints in Bitcoin. The buy-the-dip narrative isn't just alive — it's being driven by corporate balance sheets.
Rumors are circulating that the U.S. government plans to buy 1 million BTC — a move that would shake the global financial system to its core. If true, this isn’t just bullish — it’s historic. The last time governments got this aggressive with a hard asset was during the Gold Reserve buildup. Bitcoin isn’t just digital gold anymore — it’s becoming sovereign-level collateral. 📈💥
💬 Drop your thoughts below. Is this the beginning of the next parabolic era?
In this episode, we break down the parabolic pattern forming on the chart, why it may signal the next explosive leg up, and how history is repeating with BTC playing the role of digital gold.
📊 Technical breakdown. On-chain behavior. Smart money moves.
Don’t blink. Parabolas end in fireworks.
I've been trading for 17 years
👍 If you found this useful, drop a like.
💬 Got questions or thoughts? Leave a comment below — I always respond and happy to help.
👍
Best Regards
MartyBoots

THE KOG REPORT - Update & NFP analysis End of day update from us here at KOG:
We managed to get the move into the red box we wanted which should have been a enough for the day. However, the levels were so clean during NY that we managed to get another decent trade into the Excalibur target to complete the day.
With NFP tomorrow and a US holiday on Friday, we're going to share our levels and view but due to unforeseen circumstances, I won't be around for the rest of the week to see it through.
We've added the updated red boxes, the key levels and the potential move if they break. So far, we've had a good week, so these levels are simply for reference and unless there is a clean set up, our traders will stay away until Monday.
Red boxes:
Break above 3350 for 3355, 3362, 3373, 3375 and 3390 in extension of the move
Break below 3335 for 3320, 3316, 3310. 3306, 3298 and 3285 in extension of the move
The week so far:
KOG’s bias for the week:
Bullish above 3250 with targets above 3278✅, 3285✅, 3297✅ and above that 3306✅
Bearish below 3250 with targets below 3240, 3232, 3220 and below that 3212
RED BOX TARGETS:
Break above 3275 for 3279✅, 3285✅, 3289✅ and 3306✅ in extension of the move
Break below 3260 for 3255, 3251, 3240 and 3235 in extension of the move
As always, trade safe.
KOG

GOLD (XAUUSD): Potential Scenarios Explained
Here is my updated technical outlook for Gold with potential scenarios.
Bullish Scenario
The price is currently testing a significant daily resistance cluster.
Its bullish breakout and a daily candle close above 3368 will
provide a strong confirmation.
More growth will be expected then.
Bearish Scenario
For now, the market is consolidating on the underlined resistance.
The price is stuck within a horizontal range on a 4H time frame now.
Your bearish signal will be a breakout of its support and a 4H candle
close below 3310.
It will provide a strong bearish confirmation.
The market might be weak and remain within a 4H range today.
But, everything can happen, so watch carefully.
❤️Please, support my work with like, thank you!❤️
I am part of Trade Nation's Influencer program and receive a monthly fee for using their TradingView charts in my analysis.

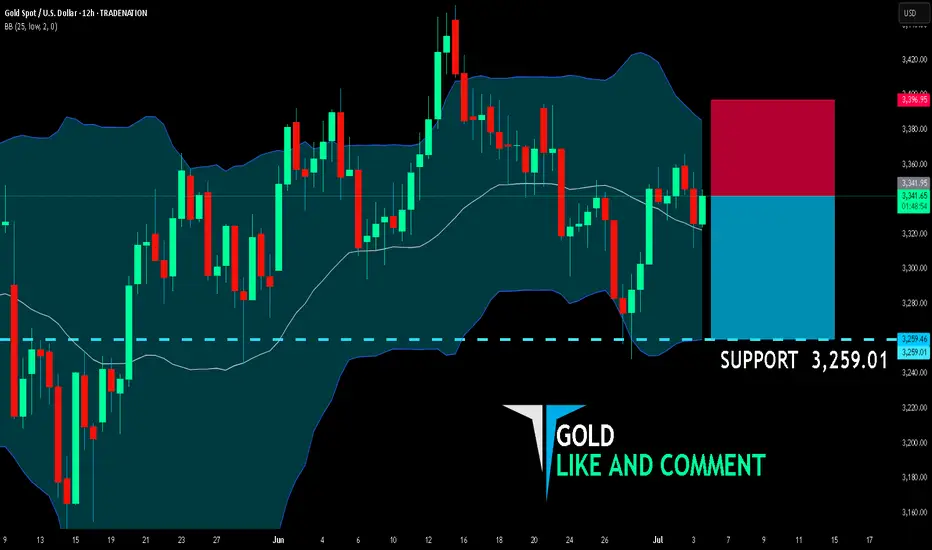
GOLD BEARS ARE STRONG HERE|SHORT
GOLD SIGNAL
Trade Direction: short
Entry Level: 3,341.95
Target Level: 3,259.01
Stop Loss: 3,396.95
RISK PROFILE
Risk level: medium
Suggested risk: 1%
Timeframe: 12h
Disclosure: I am part of Trade Nation's Influencer program and receive a monthly fee for using their TradingView charts in my analysis.
✅LIKE AND COMMENT MY IDEAS✅
MACRO 3-Drive Pattern on Bitcoin | Major Reversal Ahead?Is Bitcoin completing a massive 3-drive structure on the macro chart?
Three clear pushes higher, each with fading momentum, are flashing a major reversal signal.
This could be the final phase before a long-term shift — are you ready for what’s next?
📚 3-Drive Structure Trading Strategy — Full Breakdown
The 3-Drive Pattern is a powerful reversal-based price structure used to spot major turning points in trending markets. It works by identifying three consecutive drives (or pushes) in one direction, typically ending with exhaustion and a high-probability reversal.
Each drive forms a new high or low, but with weakening momentum — especially visible using RSI, MACD, or volume divergence.
🔍 What is the 3-Drive Pattern?
3 consecutive higher highs (or lower lows)
Each drive followed by a shallow pullback
Momentum weakens on each push (divergence forms)
Fibonacci symmetry often present:
- Drive extensions: 127.2%–161.8%
- Pullbacks: usually 61.8%
📉 Bearish 3-Drive (Reversal from Uptrend):
Drive 1: Price makes a higher high with strong momentum
Drive 2: Another higher high, weaker strength
Drive 3: Final high with clear divergence
Reversal: Entry when price breaks below structure
🎯Entry Criteria:
Wait for all 3 drives to form
Confirm with divergence on Drive 3
Use a confirmation candle or structure break
Stop-loss: just beyond the 3rd drive’s high
🎯 Targets:
Conservative: Return to Drive 2 base
Aggressive: Full trend reversal (50%–100% Fib retracement)
🧠 Pro Tips:
Best on 4H, 1D, 3D or 1w timeframes
Confirm with RSI, MACD, or volume divergence
Combine with key S/R or supply-demand zones
💡 Summary:
The 3-Drive pattern is one of the most reliable reversal structures when combined with divergence and Fibonacci symmetry. It's especially powerful at market exhaustion zones and works best with confirmation-based entries.

MarketBreakdown | USDJPY, USDCAD, BITCOIN, SILVER
Here are the updates & outlook for multiple instruments in my watch list.
1️⃣ #USDJPY daily time frame 🇺🇸🇯🇵
The market nicely respected a rising trend line
and bounced from that, forming a high momentum bullish candle.
I think that the pair will continue rising and reach 145.8 level soon.
2️⃣ #USDCAD daily time frame 🇺🇸🇨🇦
The price is currently approaching an important confluence
zone based on a falling trend line and a horizontal support.
I will expect a pullback from that.
3️⃣ #BITCOIN #BTCUSD daily time frame
The price successfully violated a resistance line of a bullish
flag pattern and closed above that.
It is a critical bullish signal. I believe that the price will test
a current high then and will violate that with a high probability.
4️⃣ #SILVER #XAGUSD daily time frame 🪙
The market broke a resistance line of a bullish flag.
Uptrend is going to continue, and the price is going to reach 37,14 level soon.
Do you agree with my market breakdown?
❤️Please, support my work with like, thank you!❤️
I am part of Trade Nation's Influencer program and receive a monthly fee for using their TradingView charts in my analysis.

BTC - Will the Bearish Channel continue?Market Context
After a strong impulsive rally earlier in the year, BTC has been trading within a descending channel on the daily timeframe. This corrective structure suggests a period of consolidation and redistribution, as price oscillates between the channel's boundaries. The repeated rejection from the upper trendline and the inability to break through key highs reinforce the bearish bias in this structure.
Buy Side Liquidity Sweep Potential
Price is currently positioned just beneath a relatively clean swing high, sitting above the mid-range of the channel. This high represents a clear area of Buy Side Liquidity—stop losses from short positions and pending breakout orders from longs are likely clustered there. An engineered sweep of this high would serve as a strategic move for larger participants to collect liquidity before driving price lower.
Fair Value Gap as a Pivot Point
Beneath current price lies a Fair Value Gap—a visible inefficiency formed during a fast upward move earlier in the structure. This Gap remains unfilled and offers a compelling target for price once the Buy Side Liquidity Sweep occurs. It represents a logical zone for price to rebalance before deciding on continuation or reversal. Should price break below the Gap cleanly, it would confirm the bearish intent and potentially accelerate toward the lower bounds of the channel.
Channel Continuation Structure
The overall geometry of the channel remains intact, and the price respecting both upper and lower boundaries strengthens the likelihood of a continuation toward the downside. If the Buy Side Liquidity Sweep and subsequent rejection occur, the market could be poised for another leg lower—possibly seeking the next structural support closer to 90,000 or even toward the lower extremities of the channel around 80,000–82,000.
Final Thoughts
This chart reflects classic price delivery behavior: corrective structure, engineered liquidity sweeps, and the magnetic pull of inefficiencies like Fair Value Gaps. Whether you’re actively trading or simply observing, this is a clean, educational setup to learn from.
If this breakdown helped you see the market a bit clearer, I’d really appreciate a like. And feel free to share your thoughts or counterviews in the comments—your insights make the analysis even more valuable.

Final Trading Day Outlook for GOLD – Friday Bias and Trade PlanAs we head into the last trading day of the week, here's my outlook for GOLD ( CAPITALCOM:GOLD ):
Bias and Expectation
I was expecting a retracement from the 75% Draw on Liquidity (DRT) level — not just because of the level itself, but also due to its confluence with a Fair Value Gap (FVG) and a Bearish Order Block. And that retracement did occur.
Thursday delivered that deep retracement, courtesy of economic data and news releases. That pullback tapped into a Daily FVG and is now trading above its Consequent Encroachment (CE) at the time of this analysis.
✅ If today’s candle closes above the midpoint of that FVG, it will further confirm my bullish bias.
✅ Even more convincing will be a close above the upper boundary of the FVG, suggesting strength and possible continuation.
Market Structure Across Timeframes
🔸 4H Chart:
Price has raided sell-side liquidity and formed relative equal highs, a sign that the market may seek to attack that zone next — possibly as a liquidity target.
🔸 1H Chart:
The market is currently trading in the premium zone of the FVG, and shows a clear inability to trade lower, further supporting the bullish outlook.
Trade Plan
My trade idea for Friday is as follows:
Wait for a purge (liquidity sweep) on the sell-side, ideally during a Kill Zone (London or NY).
Look for confirmation and confluence based on my model (e.g. displacement, market structure shift).
Enter long positions targeting the next liquidity pool, particularly the equal highs formed on the 4H timeframe.
⚠️ Reminder:
Trade with due diligence. This is not financial advice. Always align entries with your personal model and preferred session.
📌 Final Note
Today may present strong opportunities — but patience, timing, and context are everything. Let the market show its hand, then act.
Thanks for your support!
If you found this idea helpful or insightful, please drop a like 👍 and leave a comment — I’d love to hear your thoughts! 🚀
Follow me for more daily price action insights and trading strategies on XAUUSD and other key markets.
Let’s grow and trade smarter together! 📈
⚠️ Disclaimer
This content is for educational and informational purposes only and does not constitute financial or investment advice.
All trading involves risk. You are solely responsible for your own decisions, so always conduct proper research and due diligence before taking any trades.
Past performance is not indicative of future results. Trade responsibly.
May your final trades of the week be precise and profitable.

July 4 GOLD FIREWORKS!!!Gold bout to POP!!!! and it could be seriously huge! Im just patiently waiting for a area of entry. I have never traded a July 4th Holiday with this much clarity on what I see so this could get interesting.

Resistance at $37.60. After that, look out above. This could be the next leg up to get to $40 and above. Some resistance around $37.60 to break first.