Has gold Bottomed Out? Will the Bullishness continue from here?Looking for the bullish activity to continue from here but need to see a sweep and reject of the Previous daily Low before I want to get active. This would give confirmation that the price want to continue with this bullishness.
Metals

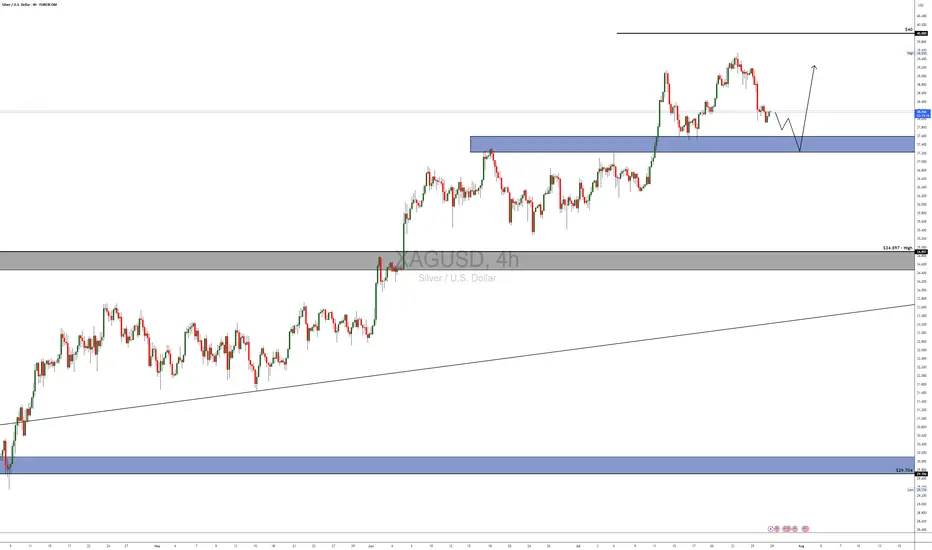
BUY TRADE SETUP ON XAGUSDCheck this buy trade setup i got on SILVER.
Anticipate a retest of the demands zone at 37.45 zone and plan for a buy entry there.
A Swing Trade Plan.
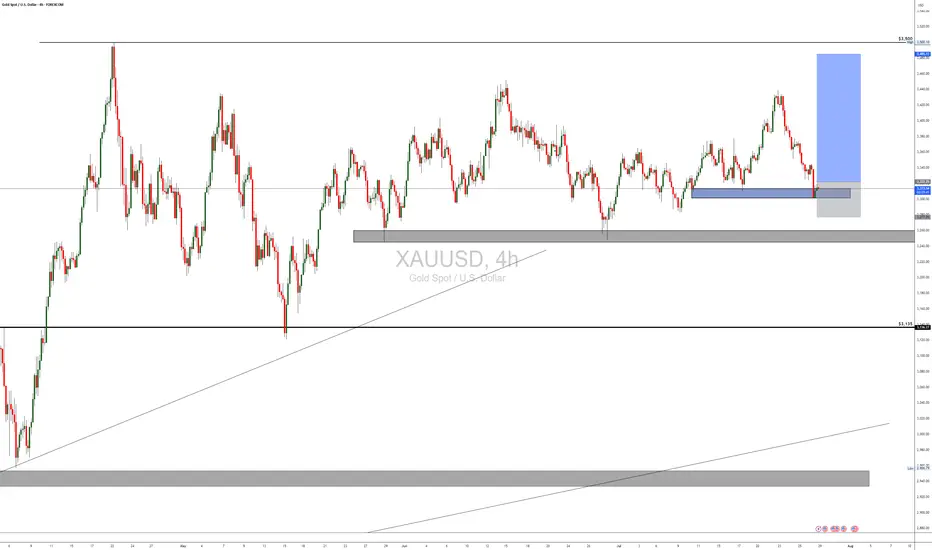
BUY TRADE SETUP ON XAUUSDA Quick Trade setup on Gold for Gold traders who are crazy about Gold!
Swing Trade.
Check it out!
GOLD Epic Trendline Breakout! Sell!
Hello,Traders!
GOLD was trading along
A long-term trend-line but
It is broken now and the
Breakout is confirmed so
We are bearish biased now
And we will be expecting a
Further bearish move down
Sell!
Comment and subscribe to help us grow!
Check out other forecasts below too!
Disclosure: I am part of Trade Nation's Influencer program and receive a monthly fee for using their TradingView charts in my analysis.

Gold Price Rally: Why Hedge Funds Are Making Their Biggest Bet Glimmer of Gold: Why Hedge Funds Are Making Their Biggest Bullish Bet in Months
In the complex and often turbulent theater of global finance, the movements of so-called "smart money" are watched with an eagle's eye. When these sophisticated players, particularly hedge funds, move in concert, it often signals a fundamental shift in market sentiment. Recently, a powerful signal has emerged from the depths of the commodities market: hedge funds have dramatically increased their bullish bets on gold, pushing their net long positions to a 16-week high. This aggressive positioning is not a random fluctuation; it is a calculated response to a potent cocktail of persistent geopolitical instability, simmering trade tensions, and a growing conviction that the global economic landscape is tilting in favor of the ultimate safe-haven asset.
The surge in bullish sentiment represents a significant vote of confidence in the yellow metal. It suggests that some of the world's most well-resourced and analytically driven investors are looking past the daily noise of equity markets and are instead positioning themselves for a future where security, stability, and tangible value take precedence. They are not merely dipping their toes in the water; they are making a decisive, leveraged bet that the forces buffeting the global economy will continue to drive capital towards gold's enduring allure. This move has sent ripples across the financial world, prompting investors of all stripes to ask a critical question: What does the smart money see that we should be paying attention to?
Decoding the Data: A Sharp Turn Towards Bullishness
To understand the magnitude of this shift, one must look to the weekly Commitments of Traders (COT) report published by the U.S. Commodity Futures Trading Commission (CFTC). This report provides a detailed breakdown of positions in the futures markets, separating traders into different categories, including "Managed Money." This category, which primarily consists of hedge funds and commodity trading advisors, is a key barometer for speculative sentiment.
The latest data reveals a sharp and decisive increase in bullish conviction. Hedge funds significantly ramped up their gross long positions—outright bets that the price of gold will rise. Simultaneously, they have been closing out their short positions—bets that the price will fall. The combination of these two actions has a powerful magnifying effect on the "net long" position, which is the difference between the number of long and short contracts.
Reaching a 16-week high is particularly noteworthy. It indicates a reversal of previous caution or bearishness and the establishment of a new, more aggressive bullish trend. For months, hedge funds may have been hesitant, weighing the prospects of higher-for-longer interest rates against emerging geopolitical risks. The current data shows that the scales have tipped decisively. This isn't a gradual accumulation; it's a forceful pivot, suggesting a high degree of conviction in the upside potential for gold. This influx of speculative capital acts as a powerful tailwind for the gold price, creating upward pressure as more funds chase the emerging momentum.
The Three Pillars of the Golden Thesis
The coordinated move by hedge funds is not based on a single factor but on a confluence of three powerful, interlocking macro-economic and geopolitical narratives. Each pillar reinforces the others, creating a compelling case for holding gold.
1. The Unsettled World: Geopolitical Risk as a Prime Catalyst
Gold has, for millennia, served as the ultimate barometer of fear. In times of peace and prosperity, its appeal can wane in favor of assets that offer growth and yield. But in an environment of escalating geopolitical tension, its value proposition becomes unparalleled. The current global landscape is rife with such tensions.
Persistent conflicts in key regions continue to create uncertainty, threatening to disrupt energy supplies, shipping lanes, and international relations. The risk of these conflicts widening or drawing in other powers keeps a floor under the demand for haven assets. Beyond active conflicts, the world is witnessing a broader realignment of global power. The rise of multi-polarity and the challenging of the post-Cold War order create a backdrop of systemic instability.
Furthermore, political uncertainty within major economies adds another layer of risk. Election cycles in dominant nations can lead to unpredictable policy shifts on everything from trade and taxation to international alliances. This policy uncertainty makes investors nervous, prompting them to allocate capital to assets that are insulated from the whims of any single government or political outcome. Gold, being a stateless monetary asset with no counterparty risk, is the natural recipient of these capital flows. Hedge funds are betting that these geopolitical undercurrents will not only persist but potentially intensify, making gold an essential portfolio hedge.
2. The Friction of Trade: A Drag on Global Growth
The era of seamless globalization has given way to a period of strategic competition and trade friction. The ongoing trade disputes between the world's largest economic blocs, most notably the United States and China, have moved beyond mere rhetoric and are now an entrenched feature of the global economy. Tariffs, export controls, and national security-driven industrial policies are disrupting long-established supply chains and creating a more fragmented and less efficient global marketplace.
This environment is a significant headwind for global economic growth. The uncertainty surrounding trade policy makes it difficult for businesses to make long-term investment decisions, dampening corporate spending and hiring. Slower global trade directly translates to slower economic growth, which in turn puts pressure on corporate earnings and equity valuations.
In this context, gold shines. As an asset that does not rely on economic growth to generate returns, it acts as a valuable diversifier in a portfolio dominated by stocks and bonds. When growth falters, gold's role as a store of value becomes more pronounced. Hedge funds are positioning for a scenario where persistent trade tensions continue to weigh on the global economy, making riskier assets less attractive and defensive assets like gold more appealing.
3. The Central Bank Pivot: Anticipating Looser Money
Perhaps the most powerful financial driver for gold is the outlook for monetary policy, particularly from the U.S. Federal Reserve. The price of gold has an inverse relationship with real interest rates (interest rates minus inflation). When real rates are high, the opportunity cost of holding a non-yielding asset like gold is also high, as investors can earn a handsome, risk-free return in government bonds. Conversely, when real rates are low or falling, the opportunity cost of holding gold diminishes, making it a more attractive investment.
For the past couple of years, central banks have been in a fierce battle against inflation, raising interest rates at an aggressive pace. However, the market is now increasingly looking ahead to the next phase of the cycle: rate cuts. While the timing is still a matter of debate, the consensus is that the next major policy move from the Fed and other major central banks will be to lower rates to support a slowing economy.
Hedge funds are front-running this anticipated pivot. They are accumulating gold now in expectation that falling interest rates in the future will provide a significant tailwind for its price. Even before the cuts materialize, the mere expectation of looser monetary policy is enough to fuel a rally. Furthermore, there is a persistent fear that central banks might make a policy error—either by keeping rates too high for too long and triggering a deep recession, or by cutting rates too soon and allowing inflation to become re-anchored. Either scenario is bullish for gold, which performs well during both economic downturns and periods of high inflation.
This speculative demand from hedge funds is layered on top of a powerful, long-term structural trend: voracious buying from the world's central banks. For several years, central banks, particularly those in emerging markets like China, India, and Turkey, have been steadily diversifying their foreign reserves away from the U.S. dollar and into physical gold. This "de-dollarization" trend is a strategic move to reduce dependence on the U.S. financial system and to hold a neutral reserve asset in an increasingly fractured world. This consistent, price-insensitive buying from official institutions creates a strong and stable floor of demand for gold, providing hedge funds with the confidence to build their own large, speculative positions on top of it.
Conclusion: A Resounding Vote for a Golden Future
The sharp increase in bullish gold bets by hedge funds is more than just a statistic; it is a story about risk, fear, and the search for security in an uncertain world. It reflects a growing consensus among sophisticated investors that the confluence of geopolitical turmoil, economic friction, and an impending shift in monetary policy has created a uniquely favorable environment for the precious metal.
These funds are acting as canaries in the coal mine, signaling a potential increase in market volatility and a flight to safety. Their aggressive positioning, backed by billions of dollars in capital, can become a self-fulfilling prophecy, driving prices higher and drawing in more waves of investors. As the world continues to grapple with deep-seated structural changes, the decision by the "smart money" to make its largest bullish wager on gold in months is a clear and resounding signal: in the quest for a safe harbor, all that glitters is, once again, gold.
BEAR TREND COMMING FOR GOLD trader in 28.july . 2025
XAUUSD : in my expectation and analysis i tend to see gold to make bear run for short to med term ,, target 2850 USD
good luck

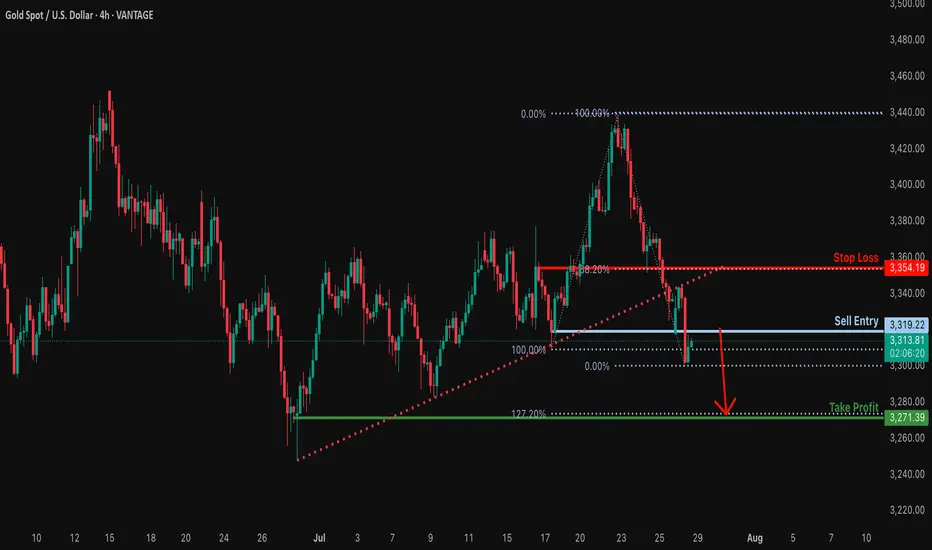
Bearish reversal?XAU/USD is rising towards the resistance level, which serves as a pullback resistance and could drop from this level to our take-profit target.
Entry: 3,319.22
Why we like it:
There is a pullback resistance.
Stop loss: 3,354.19
Why we like it:
There is a pullback resistance that aligns with the 38.2% Fibonacci retracement.
Take profit: 3,271.39
Why we like it:
There is a swing low support that lines up with the 127.2% Fibonacci extension.
Enjoying your TradingView experience? Review us!
Please be advised that the information presented on TradingView is provided to Vantage (‘Vantage Global Limited’, ‘we’) by a third-party provider (‘Everest Fortune Group’). Please be reminded that you are solely responsible for the trading decisions on your account. There is a very high degree of risk involved in trading. Any information and/or content is intended entirely for research, educational and informational purposes only and does not constitute investment or consultation advice or investment strategy. The information is not tailored to the investment needs of any specific person and therefore does not involve a consideration of any of the investment objectives, financial situation or needs of any viewer that may receive it. Kindly also note that past performance is not a reliable indicator of future results. Actual results may differ materially from those anticipated in forward-looking or past performance statements. We assume no liability as to the accuracy or completeness of any of the information and/or content provided herein and the Company cannot be held responsible for any omission, mistake nor for any loss or damage including without limitation to any loss of profit which may arise from reliance on any information supplied by Everest Fortune Group.
GOLD ROUTE MAP UPDATEHey Everyone,
Please see update on our 1H chart route map.
Gold continued its bearish momentum into today, hitting our bearish target at 3238, while leaving the 3348 bullish gap still open.
After a break below 3328, price followed through and hit 3305, entering our key retracement range, which gave the bounce to manage any premature positions on the top. We’re now watching closely for a reaction at this level.
A clean EMA5 cross and lock below 3305 will open the path toward the swing range.
However, failure to lock below this level could trigger a bounce from here.
This is a pivotal area for the next directional move.
We will keep the above in mind when taking buys from dips. Our updated levels and weighted levels will allow us to track the movement down and then catch bounces up.
We will continue to buy dips using our support levels taking 20 to 40 pips. As stated before each of our level structures give 20 to 40 pip bounces, which is enough for a nice entry and exit. If you back test the levels we shared every week for the past 24 months, you can see how effectively they were used to trade with or against short/mid term swings and trends.
The swing range give bigger bounces then our weighted levels that's the difference between weighted levels and swing ranges.
BULLISH TARGET
3348
EMA5 CROSS AND LOCK ABOVE 3348 WILL OPEN THE FOLLOWING BULLISH TARGETS
3369
EMA5 CROSS AND LOCK ABOVE 3369 WILL OPEN THE FOLLOWING BULLISH TARGET
3397
EMA5 CROSS AND LOCK ABOVE 3397 WILL OPEN THE FOLLOWING BULLISH TARGET
3422
BEARISH TARGETS
3328 - DONE
EMA5 CROSS AND LOCK BELOW 3328 WILL OPEN THE FOLLOWING BEARISH TARGET
3305 - DONE
EMA5 CROSS AND LOCK BELOW 3305 WILL OPEN THE SWING RANGE
3289
3267
As always, we will keep you all updated with regular updates throughout the week and how we manage the active ideas and setups. Thank you all for your likes, comments and follows, we really appreciate it!
Mr Gold
GoldViewFX

Analysis for the next week (XAUUSD) Hello Traders, Happy Weekend.
The market is going to open tonight, As you see the down trend is running, the price is falling like a waterfall.
Now the market is on the support area according to H1 & H4 TimeFrame.
The market is respecting the support area and there is a Trend line support according to D1 TimeFrame.
The market is respecting the Trend line and support area.
According to my analysis gold will drop till 3287 to 3271.
If gold fly, it can fly till 3350 then it will fall.
Stay tune for update.
Kindly share your views and leave positive comments here, Thanks.

SILVER: Strong Growth Ahead! Long!
My dear friends,
Today we will analyse SILVER together☺️
The in-trend continuation seems likely as the current long-term trend appears to be strong, and price is holding above a key level of 38.099 So a bullish continuation seems plausible, targeting the next high. We should enter on confirmation, and place a stop-loss beyond the recent swing level.
❤️Sending you lots of Love and Hugs❤️

GOLD: The Market Is Looking Down! Short!
My dear friends,
Today we will analyse GOLD together☺️
The price is near a wide key level
and the pair is approaching a significant decision level of 3,313.85 Therefore, a strong bearish reaction here could determine the next move down.We will watch for a confirmation candle, and then target the next key level of 3,298.60..Recommend Stop-loss is beyond the current level.
❤️Sending you lots of Love and Hugs❤️
Gold 1H Intra-Day Chart 28.07.2025We saw a perfect move towards our $3,310 target, hitting our TP. What's next?
Option 1: Gold now moves higher into the $3,385 area, before we can determine the next major move.
Option 2: Gold drops lower towards $3,265 next.
Which scenario do you find more likely?

GOLD falls on USD and trade talks, big data weekSpot OANDA:XAUUSD ended its rally this week on Friday (July 25) and closed down nearly 1%, mainly affected by the recovery of the US Dollar TVC:DXY and progress in trade negotiations that weakened safe-haven demand.
DXY recovered 0.27% on Friday to close at 97.642, ending a two-week low, making gold less attractive than its direct correlation.
Earlier, news of a US-Japan trade deal and a breakthrough in US-EU talks weakened the market's demand for safe-haven assets.
For the content of the US-Japan trade deal, readers can review it in the daily publications during the past trading week.
Data and Fed Expectations
The latest US jobless claims fell to a three-month low, suggesting the job market remains solid. This gives the Federal Reserve reason to maintain interest rates at 4.25%-4.50%, despite President Trump once again pressuring Powell to cut rates.
However, in the short term, the fundamental direction of gold may need to wait for the Federal Reserve to announce more policy signals at its meeting next week.
Speculative Longs Hit High Near April Peak
Data from the U.S. Commodity Futures Trading Commission (CFTC) showed that as of the week of July 22, the speculative net long position in COMEX gold rose by 27,211 lots to 170,868 lots, the highest level since April. This shows that as gold prices fall again, buyers are still actively deploying, waiting for more guidance from policy and data.
Last Week Review and This Week’s Fundamental Outlook
Last week, gold prices initially rose and then fell. Due to risk aversion and volatility in the US dollar, gold prices surpassed the $3,400/ounce mark at the start of the week, but as trade optimism increased and profit-taking emerged, gold prices fell back, trying to stay above $3,300/ounce.
Investors will face several major events this week:
Federal Reserve policy meeting (Wednesday): Markets expect interest rates to remain unchanged, but Powell’s speech could influence market expectations for a rate cut this year.
Macro data will be released in batches: including ADP employment data on Wednesday, PCE price index on Thursday and non-farm payrolls report on Friday. These data will determine the next move of gold.
Global central bank trends: The Bank of Canada and the Bank of Japan also hold policy meetings next week. Investors will be watching to see if their policy signals cause volatility in the US dollar and gold prices.
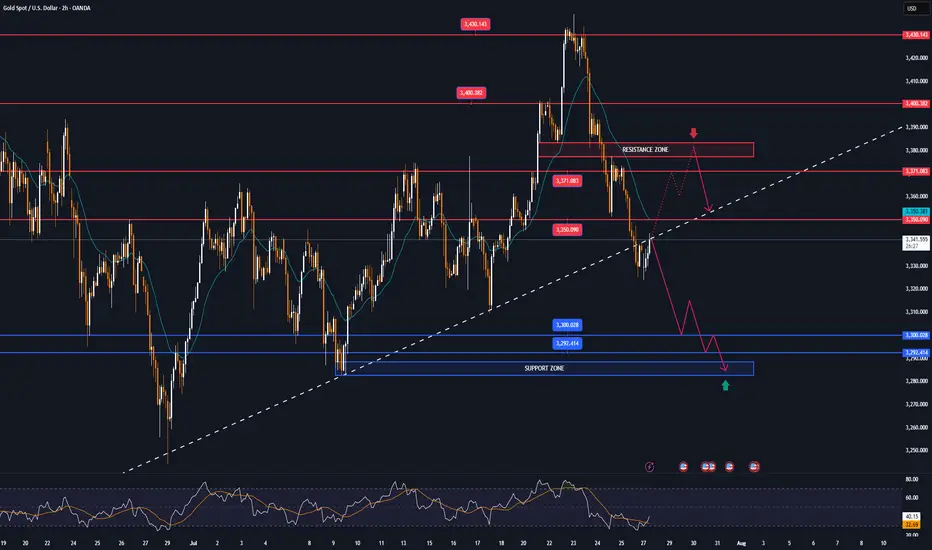
Technical Outlook Analysis OANDA:XAUUSD
On the daily chart, gold is in a rather important position after 3 consecutive corrective declines. However, the bearish momentum still keeps gold above the base price, which is an important psychological point for the bullish expectation of 3,300 USD.
In terms of position and indicators, gold has not completely lost the ability for a bullish outlook. Specifically, gold is still in a short-term rising channel and supported by the EMA21. On the other hand, it is still supported by the horizontal support level of 3,310 USD, followed by the psychological level of 3,300 USD and the 0.382% Fibonacci retracement.
Gold will only qualify for a bearish cycle if it sells below the 0.382% Fibonacci retracement level, then the target will be around 3,246 USD in the short term, more than the 0.50% Fibonacci level.
RSI is sloping down, but has not yet crossed the 50 level, and in the current case, the 50 level acts as a momentum support for the RSI. It shows that there is still room for an increase in price, and if RSI sloping up from 50, it will provide a bullish signal with relatively wide room.
If gold rises above the 0.236% Fibonacci retracement level (3,371 USD), it will be eligible for a new bullish cycle with a target of around 3,400 USD in the short term, more than 3,430 – 3,450 USD then the all-time high.
In the coming time, in terms of position and indicators, gold still has a technical outlook leaning more towards the upside and the notable points will be listed as follows.
Support: 3,310 – 3,300 – 3,292 USD
Resistance: 3,350 – 3,371 – 3,400 – 3,430 USD
SELL XAUUSD PRICE 3371 - 3369⚡️
↠↠ Stop Loss 3375
→Take Profit 1 3363
↨
→Take Profit 2 3357
BUY XAUUSD PRICE 3303 - 3305⚡️
↠↠ Stop Loss 3299
→Take Profit 1 3311
↨
→Take Profit 2 3317
3300 may fall below, possibly setting a new low#XAUUSD
From the daily chart perspective, gold has a tendency to form a converging triangle, and observing the technical indicators of the daily chart, the downward trend may have just begun📉.
So, how should we plan for the evening?📊 Now there are certainly many outside buyers who will continue to increase their positions and try to recover their losses💰. So, should we continue to be long?📈 My opinion is to wait and see.👀 If the daily chart does not fall below 3300 points, it will consolidate between 3300 and 3350 points in the future. If it falls below 3300 points, we will next focus on the support level of 3295-3285 points, and then consider whether to go long🤔.
If you are more aggressive, you can consider going long near 3305 points and exit after earning $10-20. All opinions have been informed and everyone can choose to adopt them according to their own circumstances.😄

How to plan for the evening, pay attention to the 3300 markAfter the shorts took profits, gold consolidated in the 3310-3300 area. Judging from the daily chart, the decline in gold seems to have just begun, with the middle track of the Bollinger Band at around 3345 and the lower track at 3285. The possibility of falling below the 3300 mark cannot be ruled out in the evening. If gold falls below the 3300 mark, it may first hit 3295. If the decline continues, it may even hit the low of 3285-3275 below. However, if the 3300 mark can be effectively defended, then the possibility of maintaining the consolidation of 3300-3345 in the evening may be maintained. Therefore, it is not recommended to easily participate in transactions at the current position in the evening. It is mainly advisable to wait and see and pay attention to the breakthrough of the 3300 mark.
My premium privileges are about to expire, and subsequent trading strategies and analysis will be published in the group.
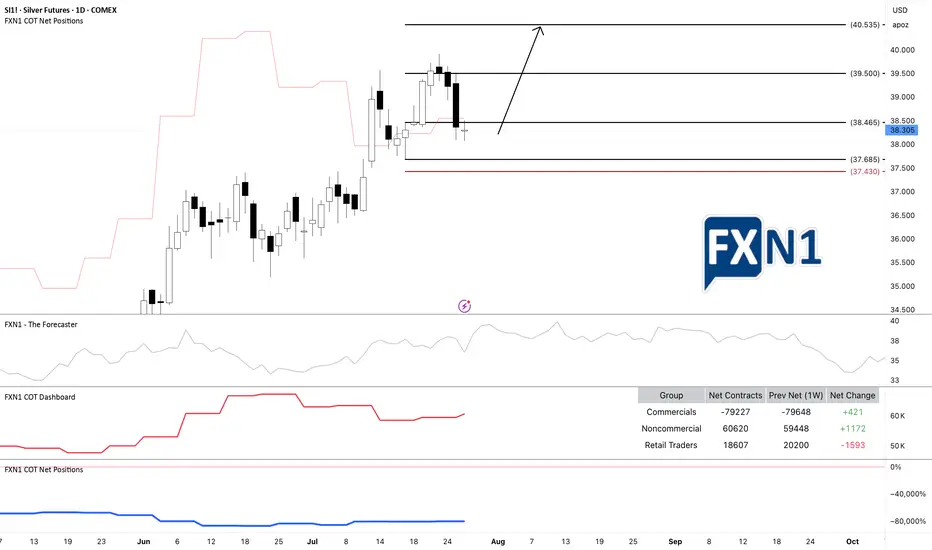
SI1!: Silver Demand Zone: Possible Bullish ContinuationI am currently observing a potential long-term continuation on SI1! Silver (XAG/USD), as the Commitment of Traders (COT) data indicates an increase in positions from both commercial and non-commercial traders. The price is approaching a demand zone on the daily chart, suggesting a possible bullish move.
The recent price action originated from an initial spike in the monthly supply zone, but there’s a possibility that the price could continue to rise further before reaching the next supply zone where a reversal might occur. Given the daily timeframe, I view this setup as suitable for a scalp trade. In my opinion, this presents an opportunity for short-term traders to capitalize on the potential upward movement.
✅ Please share your thoughts about SI1! in the comments section below and HIT LIKE if you appreciate my analysis. Don't forget to FOLLOW ME; you will help us a lot with this small contribution.
Waiting for Gold to Dump| Area Of OpportunityWe can clearly see the overall trend of Gold, which is bearish. As the price action we see bearish FVA (Fair Value Areas/Swing Lows) being run. The anticipation is to wait for the latest Swing low to be ran, before looking for entries.
Why?
Because, the path towards our nearest POI (Point Of Interest) will have a low resistance. Meaning price might expand lower smoothly.

Gold at a Crossroads: $100 Drop Ahead or New All-Time High?Gold is now sitting at a critical decision zone near the $3300 level — a key bank-level area. If we see a daily candle close below this level, I anticipate a minimum drop of 1,000 pips, with the first major support around the $3220–$3200 range. The $3200 level is extremely significant, and I’ll discuss its importance more in future updates if necessary.
On the flip side, if buyers step in and we get a daily close above $3300, I still believe it’s too early to jump into longs. The selling pressure remains quite obvious, and we’ve already seen multiple failed attempts to push beyond this level toward the $3500 all-time high. That tells me the orders at this level might be exhausted.
Personally, I’ll only consider a long position if we get at least a clean 4-hour candle close above $3350.
It’s going to be an exciting week ahead with high-impact data releases including ADP, Core PCE, the Federal Funds Rate — and most importantly, Friday’s NFP.
📌 Stay tuned for updates throughout the week!
Disclaimer: This is not financial advice. Just my personal opinion!!!

Monday market forecast and analysis ideas#XAUUSD
There will be a lot of data next week, such as the 8.1 tariff deadline that I have repeatedly emphasized, the Federal Reserve decision, NFP data, etc. It can be said that it is relatively difficult to analyze purely from a technical perspective, because there is uncertainty in many data, the data results are often non-linearly correlated with market reactions (good news does not necessarily lead to a rise, and bad news does not necessarily lead to a fall), and large fluctuations can easily form oscillating K-lines with long upper and lower shadows. Therefore, the first arrangement for next week is to participate in trading with a light position and avoid letting emotions control your thinking.
The closing price on Friday was near 3337, proving that the short-term judgment on the rebound momentum of gold is correct, so there are two possible situations on Monday.
1. The first thing we need to pay attention to is 3345-3350 to determine whether it constitutes a short-term pressure level. The weekly line closed with a negative cross star. Combined with the monthly line trend, in terms of support, focus on the trend line support near this week's low of 3325. If this position is not broken, the market is expected to usher in a wave of rebound; if it falls below 3325, the bottom may look to 3310 or even 3295 for support.
2. The rebound momentum of Friday continued on Monday, breaking through 3350 first, and then it is possible to reach the previous high resistance area of 3370-3380. If it encounters resistance here, gold will continue to fall and fluctuate, and the target may even be 3310. If the price remains strong and issues such as interest rate cuts and tariffs are imminent, it means that the short-term downward trend has ended and may even set a new high.
The above content is only a forecast for Monday’s market. It will be greatly affected by data and news, and may be adjusted in real time next week based on intraday trends. You can refer to this, but remember not to be swayed by emotions. We will participate with a light position, and the specific trading strategy can wait for my trading signal.

Gold Recovery Setup = Divergence + Support ClusterGold ( OANDA:XAUUSD ) fell to the lower line of the ascending channel and the Support zone($3,350-$3,326) , as I expected in my previous idea .
Gold is currently near a set of Supports .
Supports:
Support zone: $3,350-$3,326
Monthly Pivot Point: $3,333
Potential Reversal Zone(PRZ): $3,339-$3,329
Lower line of the ascending Channel
50_EMA(Daily)
Support lines
In terms of Elliott Wave theory , Gold appears to be completing a bearish wave 5 .
Also, we can see the Regular Divergence(RD+) between Consecutive Valleys .
I expect Gold to rise to at least $3,359 .
Second target: $3,367
Note: Stop Loss (SL) = $3,319
Do you think Gold can break the Support cluster by the end of trading hours?
Gold Analyze (XAUUSD), 1-hour time frame.
Be sure to follow the updated ideas.
Do not forget to put a Stop loss for your positions (For every position you want to open).
Please follow your strategy; this is just my idea, and I will gladly see your ideas in this post.
Please do not forget the ✅ ' like ' ✅ button 🙏😊 & Share it with your friends; thanks, and Trade safe.

GOLD - SHORT TO $2,880 (UPDATE)Gold 'Sell Trade' running 1,130 PIPS in profit to start the week. I hope you are all taking advantage of this free analysis & profiting from Gold's downside. Amazing move to start the new week, with much more downside expected.
Drop me a message @XTBCAP for Account Management & Investment opportunities✅

Tariffs, Trade Deals, & Central Bank Watch: Key Week in MarketsCME_MINI:NQ1! CME_MINI:ES1! CME_MINI:MNQ1! COMEX:GC1! CME_MINI:MES1! NYMEX:CL1!
This is a significant week in terms of macroeconomic headlines, key data releases, central bank decisions, and major trade policy developments. We get numbers for growth, inflation and decision and insights into monetary policy. Combining this with ongoing trade policy developments, we have a key week which may shape how the rest of the year unfolds.
Below is a consolidated summary of the latest trade negotiations, scheduled economic releases, and policy outlooks.
US - EU Trade Deal:
• US–EU Tariffs: The US will impose a 15% tariff on most EU goods, including cars, semiconductors, and pharmaceuticals, but retain a 50% tariff on steel and aluminium with a new quota system.
• Exemptions: Zero-for-zero tariffs agreed for agriculture, aircraft parts, and chemicals; aircraft exports are temporarily exempt.
• EU Commitments: The EU will invest $600 billion in the US and purchase $750 billion in US energy, mainly LNG.
• Agriculture: The EU will lower tariffs on many US agricultural goods, though not comprehensively.
• Political Reactions: EU leaders are mixed, Germany and the Netherlands praised the deal, France called it unbalanced, and Hungary viewed it unfavorably.
• The deal is not final until it is ratified by all EU national parliaments and the EU Parliament.
China Talks: US and China expected to extend their trade truce by 90 days. US-China meeting expected in Stockholm on Monday and Tuesday. Trump to freeze export controls to secure a deal. A group of US executives will visit China for trade discussions, organized by the US-China Business Council.
South Korea Trade Talks: Korea proposes a shipbuilding partnership with the US and is preparing a trade package.
UK–US Relations: PM Starmer and Trump to meet in Scotland to discuss the UK–US trade deal implementation, Middle East ceasefire, and pressure on Russia.
Thus far, the US has announced trade deals with the UK, Vietnam, Philippines, Indonesia, Japan and The EU. Trade delegations are working to finalize deals with China, Mexico, Canada
Key Economic Data Releases:
Monday: Treasury refunding financing estimates.
Supply: 2-Year and 5-Year Note Auction, 3 & 6-Month Bill Auction
Tuesday: US Advance Goods Trade Balance, Wholesale Inventories Advance, CB Consumer Confidence, JOLTS Job Opening (Jun), Atlanta Fed GDPNow, Australian CPI Q2
Supply: 7-Year Note Auction
Wednesday: German GDP Q2, EUR GDP Q2, US ADP Non-farm Employment, US GDP Q2, Crude Oil Inventories, Chinese Manufacturing PMI
Canada: BoC Interest Rate Decision, Rate Statement, Monterey Policy Report, BoC Press Conference
US: Fed Interest Rate Decision,FOMC Statement, Fed Press Conference.
Japan: BoJ Interest Rate Decision, Monetary Policy Statement
Thursday: EU Unemployment (Jun), US PCE & Core PCE Price Index (Jun)
Japan: BoJ Press Conference
Friday: EU CPI, US NFP, Unemployment Rate, Average Hourly Earnings, ISM Manufacturing PMI, Michigan 1-Year & 5-Year Inflation Expectations.
It is also a busy earnings week. See here for a complete earnings schedule .
Markets are interpreting trade deals as positive news thus far. The dollar is strengthening.
As we previously mentioned, we anticipate no rate cuts this year as economic data proves to be resilient and inflation largely under control. WSJ also posted an article stating that most tariffs costs are being absorbed by companies due to weaker pricing power. We previously wrote about this on our blog: “ In our analysis, the inflation impact of tariffs may not show up until Q4 2025 or early 2026, as tariff threats are mostly used as a lever to negotiate deals. While effective tariff rates have increased, as Trump reshapes how tariffs are viewed, cost pass-through to consumers will be limited in Q3 2025, as companies’ front-loaded inventory helps mitigate the risks of increased tariff exposure.
So, what we have is an interesting development shaping up where, while inflation may rise and remain sticky, it is yet to be seen whether slowing consumer spending will weaken enough to the point where companies must start offering discounts, which would nullify the tariff risk to the end consumer and result in companies absorbing all tariffs. This scenario will see reduced earnings margins leading into the last quarter and early 2026. However, it will materially reduce risks of higher inflation.”
In our view, the US dollar has a higher probability to rally in the short-term i.e., Q3 as markets re-align FX rate differentials. Bond yields stabilize, Equities continue pushing higher, while Gold retraces as previously mentioned. This in our view, is what investors and participants refer to as the Goldilocks scenario. If this plays out as expected we anticipate continued strength with AI, tech, energy and defense sectors outperforming into mid- 2026.
Institutional View: Morgan Stanley
Morgan Stanley also sees no rate cuts in 2025, despite market pricing for two 25 bps cuts. They forecast more aggressive cuts in 2026 due to:
• Tariff-related inflation emerging before labor market deterioration
• Slowing US growth, as fiscal support fades
• Impact of tighter immigration policy and global trade realignment
That said, MS continues to cite longer-term risks to the dollar, including:
• Twin deficits (fiscal + current account)
• Ongoing debate around USD’s safe haven status
• USD hedging activity picking up by international investors
• Strained credibility of the Fed due to tension between Fed Chair and the US Administration
How Fed policy evolves in Q4 2025 and Q1 2026 will depend heavily on the incoming Fed Chair nominee, who is expected to replace Jerome Powell in May 2026. This nomination could significantly influence future policy direction around growth and inflation targets.

XAUUSDXAUUSD trend If the price can still stand above 3249, it is expected that there is a chance that the price will rebound. Consider buying the red zone.
🔥Trading futures, forex, CFDs and stocks carries a risk of loss.
Please consider carefully whether such trading is suitable for you.
>>GooD Luck 😊
❤️ Like and subscribe to never miss a new idea!
